risk reward calculator: boost trading profits with sizing
Before you even think about entering a trade, a risk-reward calculator is the simple gut check that quantifies your potential profit against your potential loss. It boils everything down to a core formula—Potential Reward divided by Potential Risk—to spit out a clear ratio, like 1:2 or 1:3.
This isn't just about math; it's about forcing a disciplined, professional approach to trading, making sure your winners have the firepower to more than cover your losers.
Why a Risk Reward Calculator Is Your Best Trading Tool
Let's get one thing straight: successful trading isn't about the thrill of being right every single time. The real secret to staying in this game long-term is painfully simple but critical: manage your losses.
This is exactly where a risk-reward calculator becomes your most valuable partner, acting as a disciplined co-pilot for every trade you even consider. It strips away the emotional rollercoaster and gut feelings, replacing them with cold, hard numbers.
This little tool forces you to answer the two most important questions before you put a single dollar on the line:
- How much am I willing to lose on this trade?
- How much can I realistically expect to gain?
By answering these, you're building a clear framework. You define your stop-loss (your absolute pain point) and your take-profit level (your target). The calculator just does the simple math, giving you a ratio. This isn't just a number; it’s a strategic filter that helps you decide if a trade is even worth your time and capital.
The Mathematical Edge Professionals Rely On
Pro traders don't have a crystal ball. They have a mathematical edge. They understand that a few well-managed, significant wins can easily wipe out a string of small, controlled losses. This principle is the bedrock of consistent profits, and the risk-reward calculator is what enforces this discipline.
When you consistently hunt for trades with a favorable ratio, like 1:2 or higher, you're fundamentally shifting the odds in your favor. A 1:2 ratio means for every $1 you risk, you stand to make $2. With a structure like that, you could be wrong on two out of every three trades and still break even.
Push it to 1:3, and it gets even better—you only need to be right 25% of the time to be profitable.
The essence of trading is not about being right all the time, but about ensuring your profits on winning trades are substantially larger than your losses on losing ones. A risk-reward calculator is the simplest way to enforce this rule on every single trade.
This shift—from chasing wins to building a sustainable system—is what separates the amateurs from the pros. It moves you from gambling to calculated risk-taking, a cornerstone of any serious trading plan.
To build a truly solid foundation, explore our complete guide on risk management and trading strategies.
A Quick Guide to Risk Reward Ratios
To put this into perspective, here's a quick breakdown of what different ratios mean for your strategy.
| Risk Reward Ratio | What It Means For You | Strategic Implication |
|---|---|---|
| 1:1 | Your potential profit equals your potential loss. | You need a win rate above 50% just to be profitable. This can be a tough game to win long-term. |
| 1:2 | You're aiming to win twice as much as you're willing to lose. | Your win rate can be as low as 34% and you'll still break even. A much more forgiving strategy. |
| 1:3 | You're targeting a profit that is three times your maximum risk. | You only need to be right 25% of the time to make money. This is where a real edge starts to build. |
| 1:5+ | These are home-run trades where your potential gain is massive compared to your risk. | While rare, these trades can make your entire month or quarter. They require patience and a strong thesis. |
Remember, a higher ratio often means a lower probability of the trade hitting its target, so it's always a balancing act. But consistently seeking favorable ratios is non-negotiable for long-term success.
From Institutional Secret to Retail Standard
The idea of calculating risk-to-reward isn't new, but it used to be the domain of institutional firms with deep pockets for tech and analysts. As trading technology exploded, these same powerful analytical tools became available to everyone.
For instance, if you buy a stock at $50, set a stop-loss at $45, and aim for a profit target of $60, the math is simple. Your potential risk is $5, and your potential reward is $10. That’s a clean 1:2 risk-reward ratio.
Today, these calculators are standard-issue on trading platforms serving millions of traders worldwide. You can learn more about how these tools became essential by mastering the risk reward ratio in trading.
Ultimately, this tool is more than just a calculator; it’s a mindset trainer. It builds the discipline you absolutely need for long-term success in the markets.
Putting the Calculator to Work in Real Markets
Knowing the theory behind a risk/reward calculator is one thing, but making it a core part of your trading routine is where the magic happens. Let's step away from the abstract and see how this plays out in the heat of the moment with real market scenarios. This is where you translate knowledge into discipline.
We’ll walk through a long position, then flip the script for a short, and finish up by applying the same logic to an options trade. The goal here is to make these calculations feel like second nature—a quick, automatic check before you ever put capital on the line.
It all boils down to knowing three key numbers before you enter a trade. This simple visual breaks down the process of defining your risk, your potential reward, and the resulting ratio.
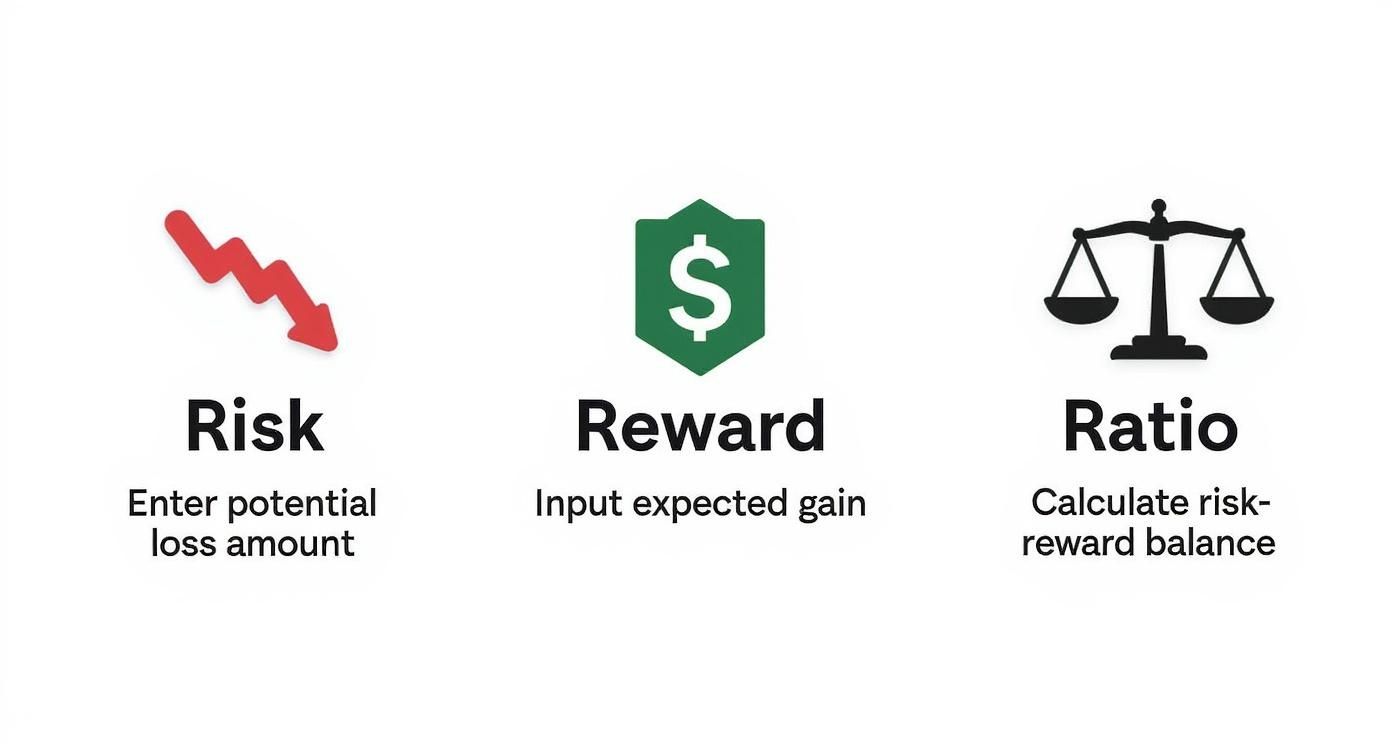
This graphic lays out the exact sequence every trader should follow: nail down your maximum loss, define your profit target, and then—and only then—decide if the ratio makes the trade worth taking.
Example One: Going Long on NVIDIA (NVDA)
Let's say NVIDIA (NVDA) has been on a tear but just pulled back to a key support level around $850. You see a classic dip-buying opportunity and believe the uptrend is ready to resume. Your analysis gives you a clear game plan.
- Entry Point: You decide to buy as the price bounces firmly off support, getting in at $855.
- Stop-Loss: To protect yourself if that support level fails, you place your stop-loss just underneath it at $840.
- Profit Target: Looking at the chart, you see major prior resistance near the $900 mark, making it a logical place to take profits.
Now, we just plug these numbers in.
- Potential Risk: $855 (Entry) - $840 (Stop-Loss) = $15 per share.
- Potential Reward: $900 (Target) - $855 (Entry) = $45 per share.
- Risk/Reward Ratio: $45 (Reward) / $15 (Risk) = 3.
What we have here is a clean 1:3 risk/reward ratio. For every dollar you’re risking, you have the potential to make three. That's a textbook professional-grade setup.
Example Two: Shorting the EUR/USD Forex Pair
Now let's switch gears to a different asset class and trade direction. Imagine the EUR/USD forex pair has just been smacked down from a major resistance level at 1.0850. Your read on the market is that a move lower is the path of least resistance.
- Entry Point (Short): You enter your short trade at 1.0840, right below that wall of resistance.
- Stop-Loss: You set your stop just above the resistance at 1.0880 to avoid getting shaken out by any minor wicks.
- Profit Target: There's a solid floor of support way down at 1.0720, which looks like an ideal target.
Let’s run the numbers from a short seller’s view.
- Potential Risk: 1.0880 (Stop-Loss) - 1.0840 (Entry) = 40 pips.
- Potential Reward: 1.0840 (Entry) - 1.0720 (Target) = 120 pips.
- Risk/Reward Ratio: 120 pips (Reward) / 40 pips (Risk) = 3.
Again, we've identified a trade with a solid 1:3 risk/reward ratio. This simple math gives you a clear, quantifiable edge.
By running every single potential trade through a risk/reward calculator first, you systematically filter out mediocre setups. This single habit forces you to engage only with opportunities that have a clear mathematical advantage, and it can completely transform your long-term results.
Example Three: Trading Options Contracts
The risk/reward calculator is just as crucial for options traders, even if the inputs look a little different. For a basic long call or put, your maximum risk is simply the premium you paid to own the contract. It’s finite and known upfront.
Suppose a stock is trading at $195, and your analysis tells you it's coiled for a big move higher. You decide to buy a call option with a $200 strike price that expires in 45 days.
- Premium Paid (Your Risk): The contract costs $5.00 per share, which comes out to $500 total ($5.00 x 100 shares). This is the absolute most you can lose.
- Profit Target: Your analysis leads you to believe the underlying stock could rally to $220 before your option expires. If it does, your $200 strike call would have an intrinsic value of at least $20 ($220 - $200).
- Potential Reward: $20 (Expected Value) - $5 (Premium Paid) = $15 per share, or a $1,500 total profit.
Let's check the ratio.
- Risk/Reward Ratio: $1,500 (Reward) / $500 (Risk) = 3.
Even in the world of options, the discipline of finding at least a 1:3 ratio is a powerful guide. As these examples show, it doesn't matter what you trade or in which direction—the risk/reward calculator is a universal tool for enforcing smart, disciplined trading decisions.
Connecting Risk Reward to Your Position Size
Spotting a trade with a fantastic risk-reward ratio is a great start, but it's only half the battle. The other, arguably more critical half is answering the question: "How much should I actually buy or sell?" This is where position sizing comes into play, acting as the crucial bridge between a good trade idea and your real-world capital exposure.
Think of position sizing as the secret to survival and long-term growth in trading. It's the mechanism that ensures a single bad trade—or even a string of them—doesn't blow up your account. By tying the 'risk' part of your R:R calculation to a non-negotiable capital-at-risk rule, you can trade with confidence, knowing your downside is always under control.
The Foundation: The 1% Rule
One of the most battle-tested principles in risk management is the 1% rule. The concept is simple but incredibly powerful: never risk more than 1% of your total trading capital on any single trade. Some traders might stretch this to 2%, but the core idea is the same—keep your exposure on any one idea tiny compared to your overall account.
This rule forces you to prioritize capital preservation above everything else. It completely removes the temptation to go "all-in" on a single high-conviction setup, which is one of the fastest ways to zero out an account. By risking only a tiny fraction of your portfolio, you give yourself the mathematical runway to withstand the losing streaks that every single trader faces.
Let's make this real with an example.
- Your Account Size: $25,000
- Maximum Risk Per Trade (1%): $250
- Your Mission: Make sure no single trade can lose you more than $250.
This $250 figure is now the anchor for every trade you take. It's the maximum loss you're willing to stomach, and it will directly dictate how many shares or contracts you can trade.
Calculating Your Position Size From Your Risk
Now, let's connect this maximum risk figure back to the trade setup you've already mapped out. You know your entry, your stop-loss, and your target. The key variable we need now is the distance between your entry and your stop-loss, which is your per-share risk.
The formula is dead simple: Position Size = Maximum Dollar Risk / Per-Share Risk
Let's say you're eyeing a stock trade with these parameters:
- Entry Price: $100
- Stop-Loss: $95
- Per-Share Risk: $100 - $95 = $5
Using your $250 maximum risk from the 1% rule, the math is straightforward: Position Size = $250 / $5 = 50 shares
By buying 50 shares, you've perfectly aligned this trade with your risk management rules. If the trade hits your stop-loss, your total loss will be exactly $250 (50 shares x $5 loss per share), which is precisely 1% of your account. This systematic process transforms trading from a gamble into a structured business. For a deeper dive, check out our guide on how to master your trades with a position size calculator.
Why This Method Is Non-Negotiable
This methodical approach to sizing your positions is what separates disciplined traders from the herd. It prevents catastrophic losses and helps smooth out your equity curve over the long haul.
A landmark 2021 study analyzing over one million trades found a shocking correlation between risk-reward ratios and profitability. The research revealed that traders who consistently aimed for a risk-reward ratio of at least 1:2 achieved a 34% probability of being profitable after 500 trades, even with a win rate as low as 40%.
The goal isn't just to find good trades. It's to size them correctly so your winners meaningfully grow your account while your losers are just small, manageable setbacks. A risk-reward calculator finds the opportunity; proper position sizing protects your capital so you can stay in the game.
Ultimately, using a risk-reward calculator without a solid position-sizing model is like driving a race car without a seatbelt. You might get away with it for a while, but one mistake can have devastating consequences. By integrating these two concepts, you build a robust framework that can handle market uncertainty and pave the way for consistent, long-term growth.
Why Your Win Rate Is a Deceptive Metric
Traders love to talk about their win rate. Especially new ones. There's an undeniable ego boost that comes from being "right," and it feels like the most direct path to growing an account.
But this obsession is one of the most dangerous myths in trading.
On its own, your win rate is a hollow, deeply misleading number. It tells you nothing about your actual profitability. You could win 90% of your trades and still watch your account slowly bleed out because your few losses are catastrophic.
On the flip side, some of the most successful traders I know lose more often than they win. Their secret isn’t being right all the time; it’s making sure their wins are mathematically massive compared to their losses. This is where the strict discipline of a risk reward calculator becomes your single greatest edge.
The Power of Asymmetric Returns
Pro trading is a game of probabilities, not crystal balls. You can’t eliminate losses, so don't even try. The real goal is to keep them small while letting your winners run wild. We do this by hunting for asymmetric returns—setups where the potential profit is a multiple of the potential loss.
A risk reward calculator forces you to define this asymmetry before you ever click the buy or sell button. When you start consistently taking trades with a 1:2 or 1:3 risk/reward ratio, you fundamentally change the math of your entire operation.
All of a sudden, you don’t need to be right most of the time to make a killing. You just need to stick to your plan. This is a massive mental shift, moving you from chasing the cheap thrill of a single win to focusing on the long-term health of your system.
Being profitable and being right are two entirely different things. A high win rate can feed your ego, but a positive risk-to-reward ratio is what will actually feed your account. Prioritize profitability over the need to be right on every trade.
How Risk Reward Flips the Win Rate Equation
Let's look at the simple but powerful math that connects your risk/reward to the win rate you actually need to be profitable. The relationship is inverse: the better your R/R, the less you need to win.
- At a 1:1 ratio, you have to win over 50% of your trades just to cover commissions and stay afloat. That's a high-pressure, coin-flip game.
- Jump to a 1:2 ratio, where your winners are double your losers, and the break-even win rate plummets.
- By the time you get to 1:3, you only need a couple of good trades to completely erase a string of small, controlled losses.
Just how much does this change things? Research highlights that at a 1:2 ratio, a trader only needs a 33.3% win rate to break even. At a 1:3 ratio, that number drops to just 25%. And at an impressive 1:5 ratio, you only need to be right 16.7% of the time. You can dive deeper into how ratios impact your break-even point at Luxalgo.com.
This table really drives the point home.
How Risk Reward Changes Your Break-Even Point
This table shows the required win rate you need just to break even at different risk-reward ratios. Notice how the pressure to be "right" completely evaporates as your R/R improves.
| Risk Reward Ratio | Required Win Rate to Break Even |
|---|---|
| 1:1 | 50% |
| 1:2 | 33.3% |
| 1:3 | 25% |
| 1:5 | 16.7% |
As you can see, superior risk management lets you focus on finding high-quality setups instead of desperately chasing frequent, low-quality wins.
Introducing Expectancy: The True Measure of Success
So if win rate is a flawed metric, what should you be tracking? The answer is expectancy. This is what the pros focus on. It’s a single number that combines your win rate, your average win, and your average loss to tell you the real story of your system's long-term health.
Here’s the formula: (Win Rate x Average Win) – (Loss Rate x Average Loss)
If the number is positive, your system makes money over time. If it’s negative, you’re on a path to blowing up your account, no matter how good your win rate feels.
Let's look at two different traders:
-
Trader A (High Win Rate): Wins 80% of their trades. Their average win is $50, but their average loss is a painful $400.
- Expectancy = (0.80 x $50) - (0.20 x $400) = $40 - $80 = -$40.
- This trader feels like a genius most of the time but is statistically losing $40 every time they place a trade.
-
Trader B (Low Win Rate): Wins only 40% of their trades. But their average win is $300, and their average loss is just $100.
- Expectancy = (0.40 x $300) - (0.60 x $100) = $120 - $60 = +$60.
- This trader is wrong more often than they're right, but their system is profitable, earning an average of $60 per trade.
Trader B is playing the long game. They understand that a lower win rate paired with a strong risk-reward ratio (a clean 1:3 in this case) is what builds a sustainable trading career. The risk reward calculator is the tool that helps you engineer this positive expectancy into every single trade you take.
From Theory to Practice: Sidestepping Traps and Using Advanced Tactics
Once you've got the risk/reward calculator dialed into your routine, you’ve built the foundation. But the real market loves to throw curveballs that test even the most disciplined trader. This is where we move past the simple math and learn how to sidestep common pitfalls while adopting more dynamic strategies.
The most common mistakes are almost always emotional. Fear makes you set stop-losses so tight you get shaken out of a perfectly good trade by normal market chop. Greed, on the other hand, makes you set profit targets based on a fantasy of what a stock could do, rather than what the chart says it's likely to do. Just knowing these psychological traps exist is the first step to beating them.
Pitfalls to Sidestep in Your Trading
One of the sneakiest ways traders sabotage themselves is by second-guessing their own analysis after the trade is live. You do your homework, calculate a perfect 1:3 risk/reward ratio, and pull the trigger. Then, the price wiggles against you, panic sets in, and you move your stop-loss "just to give it a little more room."
That single action completely destroys the original math. You’ve just turned a disciplined trade into a hopeful gamble.
Another classic error is ignoring the market's current volatility. A 20-pip stop-loss might be perfect in a quiet, range-bound market, but it's completely useless during a major news event. Your risk parameters can't be set in stone; they have to breathe with the market.
A risk/reward calculator is meant to enforce discipline before you enter a trade. The moment you override its logic because of fear or greed, you've abandoned your edge. You're no longer managing risk—you're just hoping.
To build a truly resilient framework, it's worth exploring the broader best practices for risk management, which can give you a bigger-picture view on protecting your capital.
Advanced Tactic 1: Scaling Out of Winners
As you get more comfortable, you'll realize that exiting a trade doesn't have to be an all-or-nothing event. Scaling out is a fantastic technique where you sell pieces of your position as it moves in your favor. It’s a brilliant way to blend risk management with profit-taking.
Imagine you're in a trade targeting a 1:3 risk/reward ratio. Instead of holding on for the whole move, you could:
- Sell 50% of your position once the price hits a 1:1 reward.
- Then, immediately move your stop-loss on the remaining 50% to your entry price (break-even).
This simple sequence is incredibly powerful. First, you've banked some profit and made it impossible for the trade to become a loser. Second, you’ve left the rest of your position on the table with zero risk, giving it the chance to run to your full target and become a home-run trade. It’s a huge psychological relief and helps smooth out your equity curve.
Advanced Tactic 2: Using Dynamic, Volatility-Adjusted Stops
A static, fixed-pip stop-loss is simple, but it's also a bit dumb. It doesn’t adapt. A much smarter approach is to use a dynamic stop-loss based on the market's current volatility. For this, the Average True Range (ATR) indicator is your best friend.
The ATR tells you the average price movement over a set period—it’s a direct measure of an asset’s volatility. So, instead of using a random 10-pip stop, you could place your stop at 2x the current ATR value below your entry price.
Here’s why that’s so much better:
- In volatile markets, the ATR value is higher. This automatically gives your trade a wider stop, preventing you from getting knocked out by the bigger price swings.
- In quiet markets, the ATR value is lower. This allows you to set a tighter stop, which in turn means you can use a slightly larger position size for the same amount of risk.
By using the ATR, your risk management becomes responsive and intelligent. You’re no longer relying on a rigid calculation; you’re adapting to the live market environment. This kind of flexibility is what separates amateur traders from the pros.
Common Questions from the Trenches
Once you start moving from the theory of risk management to actually putting money on the line, a few practical questions always pop up. It's one thing to read about a risk/reward calculator; it's another to use it when the market is moving. Let's tackle some of the most common situations traders face.
What's a Good Risk/Reward Ratio to Aim For?
There's no single magic number here. The "best" ratio is completely tied to your strategy's win rate. A scalper who wins 70% of their trades can do just fine with a 1:1 ratio. But for most of us, that's playing with fire.
As a general rule, most seasoned traders I know won't even look at a trade with a ratio below 1:2. It just gives you so much more breathing room.
Think about it: a 1:2 ratio means one winning trade erases two losers. This lets you be profitable even if you're only right 34% of the time. If you can find setups with 1:3 or better, you're building a system that can survive the inevitable losing streaks. Your job is to find the sweet spot that fits your strategy's historical performance and lets you sleep at night.
What If a Trade Moves Against Me but Misses My Stop Loss?
This is where discipline is forged. Your trade is in the red, hovering just a few ticks above your stop-loss. The temptation to drag that stop down "just a little bit" is huge. We've all been there. It's also one of the fastest ways to blow up an account.
The second you move your stop, you've thrown the entire risk/reward calculation out the window. Your well-planned 1:3 trade just became a 1:1 coin flip, or worse. You're no longer trading your plan; you're trading on pure hope. Your pre-defined stop-loss has to be non-negotiable. It's the foundation of your entire risk management plan.
Your trade plan is a contract you make with yourself before your emotions and your P&L are in the mix. Honoring your stop is honoring that contract, plain and simple. It's the only path to long-term consistency.
Can I Adjust My Profit Target if a Trade Is Working Well?
Yes, absolutely—but you need a system for it. Adjusting a target out of greed is just as bad as moving a stop out of fear. But adjusting it based on a pre-defined rule can be a powerful way to maximize winners.
This is especially true when a trade catches a wave of unexpected momentum. You don't want to cut a huge winner short just because it hit your initial target.
A trailing stop-loss is one of the best ways to handle this. For example, once the trade hits your first target at a 1:1 risk multiple, you could move your stop to your entry point (break-even). From there, as the trade keeps running, you can manually trail the stop under new swing lows or use an indicator like a moving average to do it for you. This locks in profit while still giving a strong trend the room it needs to run, turning a good trade into a great one.
Ready to put this into practice? ChartsWatcher gives you the tools to build, backtest, and automate your strategies with powerful scanners and alerts. Find your edge and start trading with a real plan. Get started today at ChartsWatcher.com.
