Real Time Stock Scanners: real time stock scanners for faster market signals
Real-time stock scanners are powerful tools that constantly dig through thousands of stocks, looking for trading opportunities that match your specific criteria. The key is that they send you alerts the moment something happens in the market. For any active trader who needs to act fast on price and volume changes, they're not just helpful—they're essential. This is a world away from traditional screeners that work with delayed data.
Why Real-Time Scanning Is a Game Changer
Think of the stock market as a massive, fast-moving river. An old-school, end-of-day stock screener is like a photo of that river from yesterday. It shows you where the currents were, but it's completely useless for navigating the water today.
A real-time stock scanner, on the other hand, is like having a high-tech sonar system on your boat. It’s constantly pinging the water, showing you exactly where the schools of fish—or profitable trades—are moving, right at this very second.
This is the fundamental shift: you're no longer reacting to old news. You're proactively finding and acting on live market movements. In the fast-paced markets we see today, a good setup can appear and disappear in just a few minutes, sometimes even seconds. Using delayed data is like trying to catch a hummingbird with a slow-motion camera; by the time the picture develops, the bird is long gone.
The Critical Difference Speed Makes
The real gap between a dynamic, real-time scanner and a static screener boils down to timing and purpose. Static screeners were built for a slower, more deliberate style of analysis. They’re great for finding long-term investments based on fundamentals that don't change during the day, like P/E ratios or yearly revenue growth. They give you a snapshot, which is fine if you're a value investor.
For a day trader, though, that delay is a deal-breaker. A scanner has to be a live video feed of the market, not a static photograph. This is where the real power comes in:
- Intraday Opportunities: Scanners are built to catch sudden volume spikes, stocks breaking through key resistance levels, or unusual pre-market action.
- Immediate Action: The alerts you get are actionable right now. This lets you enter and exit positions with precision, based on what the market is doing at this moment.
- Proactive Strategy: Instead of looking at charts after the close to see what you missed, you're actively hunting for setups as they form throughout the day.
A real-time scanner turns a trader from a market historian into an active market participant. It bridges the gap between seeing data and making a decision, letting you act on information that’s seconds old, not hours. This speed isn't just a nice feature; it's the engine that drives modern short-term trading.
Ultimately, getting this distinction is the first step. A real-time stock scanner isn’t just a fancy list of stocks. It’s a purpose-built system designed to cut through the overwhelming noise of the market and deliver only the signals that matter to your strategy, exactly when you need them.
How These Scanners Pinpoint Market Opportunities
To really get what a real-time stock scanner does, you have to look under the hood. It’s not some kind of market magic; it's a lightning-fast, four-stage process that sifts through millions of data points to flash a single, actionable alert on your screen. Understanding this flow is the key to seeing how opportunities are spotted in a split second.
This entire process is designed to turn the chaotic firehose of market data into a clean, manageable stream of potential trades. It’s a journey from raw feed to a perfectly refined alert.
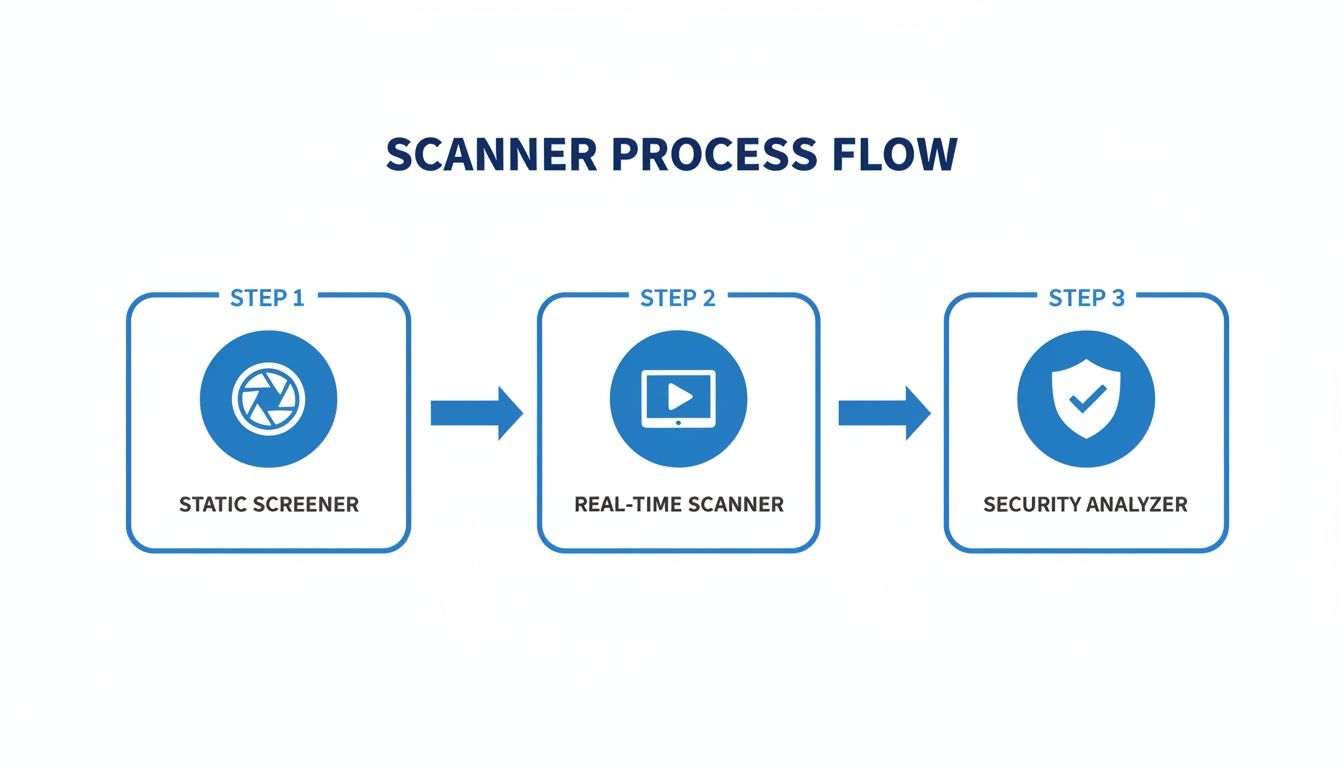
This visual nails the fundamental difference: a static screener takes a single snapshot in time, while a real-time scanner processes a continuous, live video feed of the market.
The Data Lifeline
It all begins with the data feed. Professional real-time stock scanners aren’t using the same delayed, watered-down data you get on free financial websites. They plug straight into the source—direct exchange data feeds that pump out raw, unfiltered market information as it happens.
This lifeline delivers two critical types of data:
- Level 1 Data: This is your core bid, ask, and last trade info. It tells you the exact price a stock can be bought or sold for right now.
- Level 2 Data: This goes a layer deeper, showing you the order book for a stock. You see the lineup of bids and asks at different price levels, which gives you a feel for market depth and where the supply and demand pressures are building.
By tapping into this raw data, the scanner sees the market exactly as it is, with zero delay or interpretation.
The Speed Imperative
Once the data hits, the next crucial piece is latency—the time it takes for that data to travel from the exchange to the scanner's engine. In day trading, milliseconds are everything. A one-second delay can be the difference between nailing a breakout and chasing it after the real move has already happened.
Think of it like trying to photograph a hummingbird’s wings. A normal camera just gives you a blur. You need a high-speed camera with a blistering shutter speed to capture the detail.
Low latency is the scanner's high-speed shutter. It ensures the picture of the market you're seeing is crystal clear and perfectly in focus at the moment of action, not a blurry image of what happened a second ago.
The best scanners are built from the ground up to crush this delay, processing information with sub-millisecond efficiency. This ensures the opportunities they flag are happening now.
The Filtering Brain
With a firehose of clean, low-latency data gushing in, the next job is to make sense of it all. This is where the filtering engine—the scanner's "brain"—comes in. It’s where your personal trading strategy comes to life.
You set the rules, and the scanner relentlessly checks them against every stock, every single second. These rules can be simple or wickedly complex, combining all sorts of conditions to zero in on your exact setup.
For instance, a trader hunting for momentum breakouts might build a filter like this:
- Price Condition: Stock price must be above its 50-day moving average.
- Volume Condition: Current 5-minute volume must be 300% higher than its average.
- Volatility Condition: The stock must have moved at least 2% in the last 15 minutes.
The scanner runs these checks across thousands of stocks at once. The moment a stock meets all three criteria simultaneously, it gets passed through the filter.
The Alert System
The final step is the alert. When the filtering brain finds a match, the system's job is to get it in front of you instantly. This isn't just a simple pop-up; it's the finish line for the entire high-speed process.
A professional-grade scanner gives you multiple ways to get these alerts—pop-up windows, custom sounds, or highlighted rows in a list. This is where platforms like ChartsWatcher really shine, letting you build custom dashboards where an alert can instantly sync up your charts and news feeds for immediate context. This final piece connects the scanner’s raw analytical power directly into your decision-making workflow, completing the journey from raw data to a trade-worthy opportunity.
Essential Features of a Professional Grade Scanner
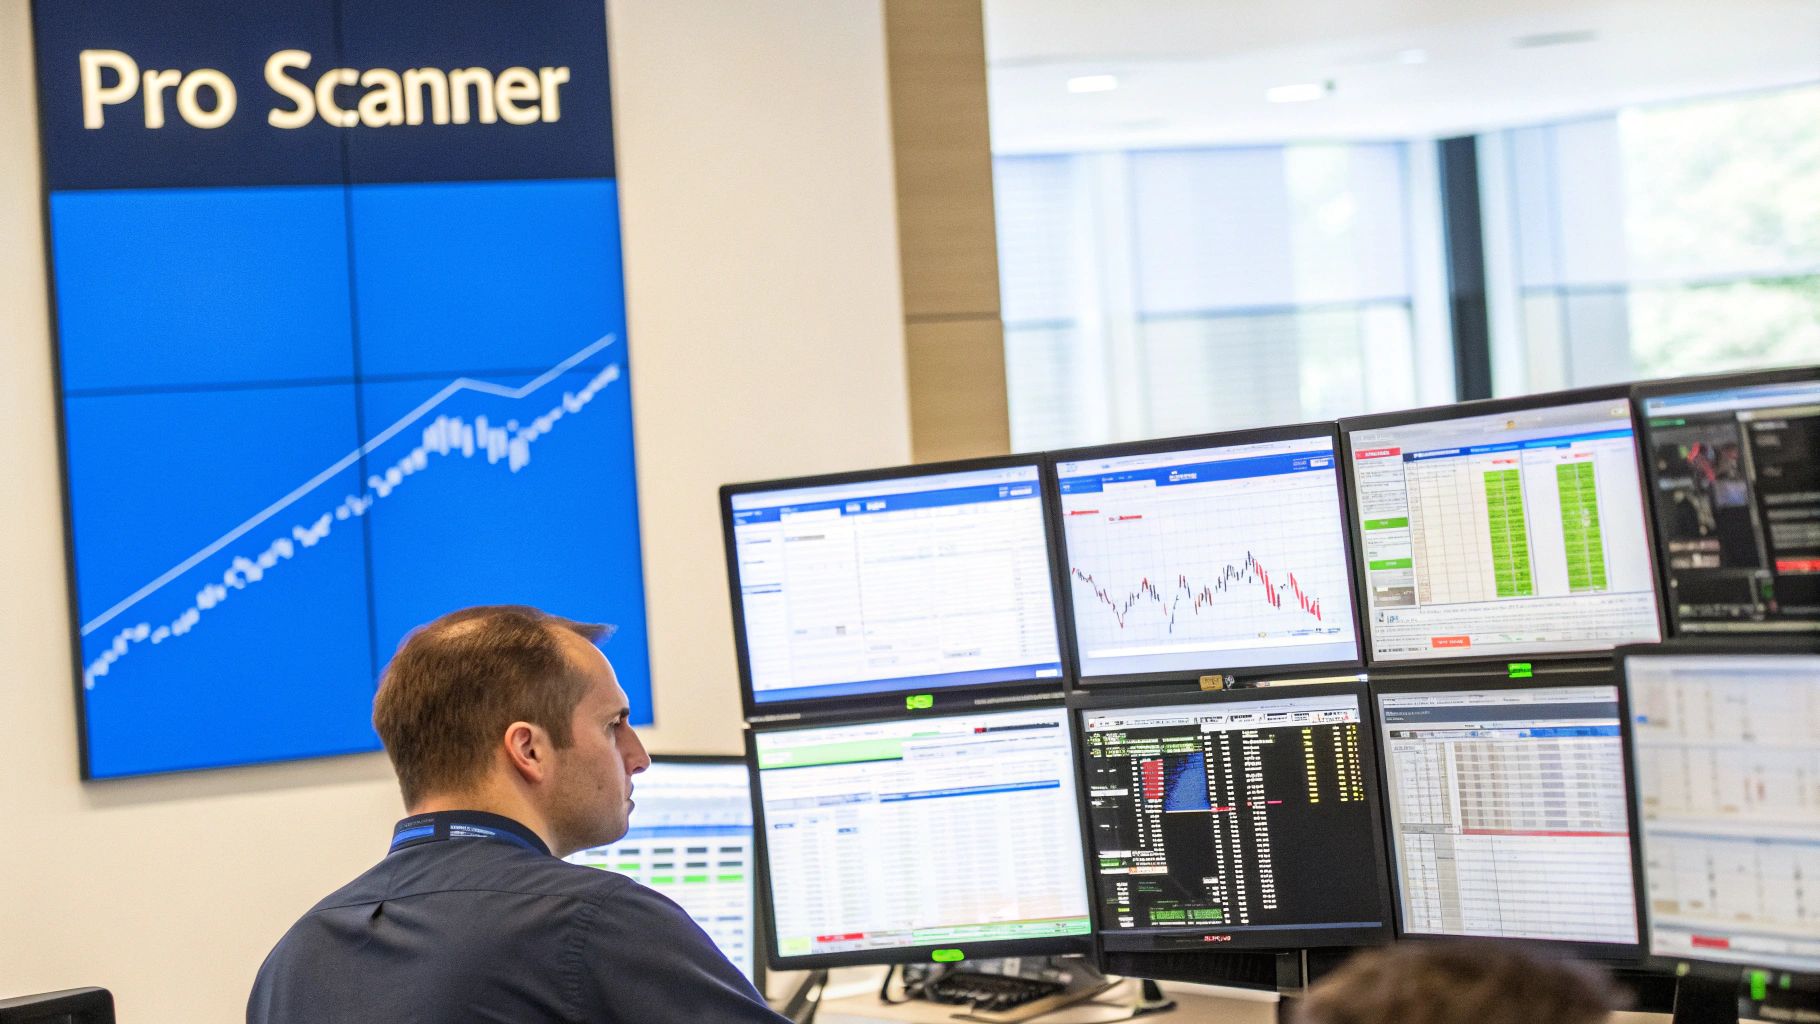
Moving from a basic tool to a professional-grade scanner is a lot like graduating from a simple pocket knife to a multi-tool. Sure, both can cut, but the multi-tool gives you a whole suite of specialized instruments for much more complex jobs. The same idea holds true for real time stock scanners; the advanced features are what really unlock a trader’s full potential.
These platforms go way beyond simple price and volume pings. They offer a depth of functionality that lets you build, test, and execute intricate strategies with surgical precision. Without these core features, a scanner is just a list generator. With them, it becomes a true trading partner.
Dynamic and Multi-Layered Filtering
The heart of any top-tier scanner is its ability to handle complex, multi-layered filtering. A serious trader needs to ask the market very specific questions, combining dozens of variables to find a precise setup. That requires a filtering engine that is both powerful and incredibly flexible.
Think of yourself as a detective at a crime scene. A rookie might just look for the obvious clues, like footprints. An expert, on the other hand, shows up with a full forensic kit, analyzing everything from microscopic fibers to chemical residues to build a complete picture of what happened.
A professional scanner is your forensic kit. It lets you layer criteria like:
- Technical Indicators: Go beyond simple price action. Scan for specific conditions like MACD crossovers, RSI levels dipping below 30, or price smashing through the upper Bollinger Band.
- Custom Formulas: This is where you can get creative. For instance, you could build a scan to find stocks where the 5-minute volume is greater than the entire average daily volume of the last 30 days.
- News-Based Triggers: Some of the best platforms can scan news feeds in real time, alerting you the moment a stock gets mentioned in a press release or a major financial outlet. Beyond just spotting market movements, many professional-grade scanners integrate advanced data, including capabilities for stock ticker enrichment.
Stock scanners have come a long way from the basic screeners of the 1990s. Today's powerhouses set the standard by streaming watchlists that can alert you to volume spikes 200% above average. By January 2026, it's projected that 85% of top day trading platforms will deliver sub-second updates—a massive leap from the 15-20 minute delays common in free tools, which often cause you to miss the most critical intraday moves.
The Trader’s Flight Simulator: Backtesting
One of the most powerful features separating the amateur tools from the professional ones is backtesting. This is your personal trading flight simulator. It lets you take a scanning strategy you've designed and run it against historical market data to see exactly how it would have performed.
Imagine you have a theory: stocks hitting a new 52-week high on double the average volume tend to pop another 5% over the next three days. With backtesting, you don't have to risk a single dime of real money to find out if you're onto something.
You can run your scan across years of historical data and get a detailed report. It will show every single time your criteria were met, how the stock performed afterward, and what your potential profit or loss would have been. This is an absolutely invaluable tool for refining your strategies and building the confidence you need before putting capital on the line.
The Customizable Trading Cockpit
Professional traders don't work with one-size-fits-all layouts. They need a custom-built dashboard—a trading cockpit where every tool and piece of information is placed exactly where they need it for peak efficiency. Any top-tier scanner must offer this deep level of customization.
This isn't just about changing colors or font sizes. It’s about creating a fully integrated workflow where every single component works in harmony. This is a core strength of platforms like ChartsWatcher, which empower traders to build their own unique environments.
A truly customizable cockpit lets you:
- Create Multiple Dashboards: You might have one layout for hunting pre-market gappers, another for tracking mid-day breakouts, and a third for your end-of-day analysis.
- Sync Windows Seamlessly: When you click an alert in your scanner, the chart window should instantly snap to that stock. At the same time, the news feed should populate with the latest headlines for that ticker.
- Save and Export Layouts: This feature is crucial. It allows you to move your perfect setup between computers or even share winning configurations with your trading group.
This ability to build a personalized, synced environment removes a ton of friction from your decision-making process. It allows you to flow from identifying an opportunity to analyzing it and taking action in one fluid, uninterrupted sequence—which is absolutely critical when every second counts. To take your setup even further, you might want to explore our guide on the best real-time stock alert apps.
Actionable Trading Strategies Using Real Time Scanners
A powerful tool is only useful if you know how to wield it. Having a professional-grade scanner is one thing; knowing precisely how to configure it to find actionable trading setups is what separates consistently successful traders from the rest. This is where theory meets practical application, turning a stream of market data into a clear plan of attack.
Transitioning from features to strategy means building a blueprint. We’ll outline proven methods traders implement every day using real time stock scanners. Each strategy is a specific lens through which to view the market, designed to find predictable patterns in the midst of chaotic price action.
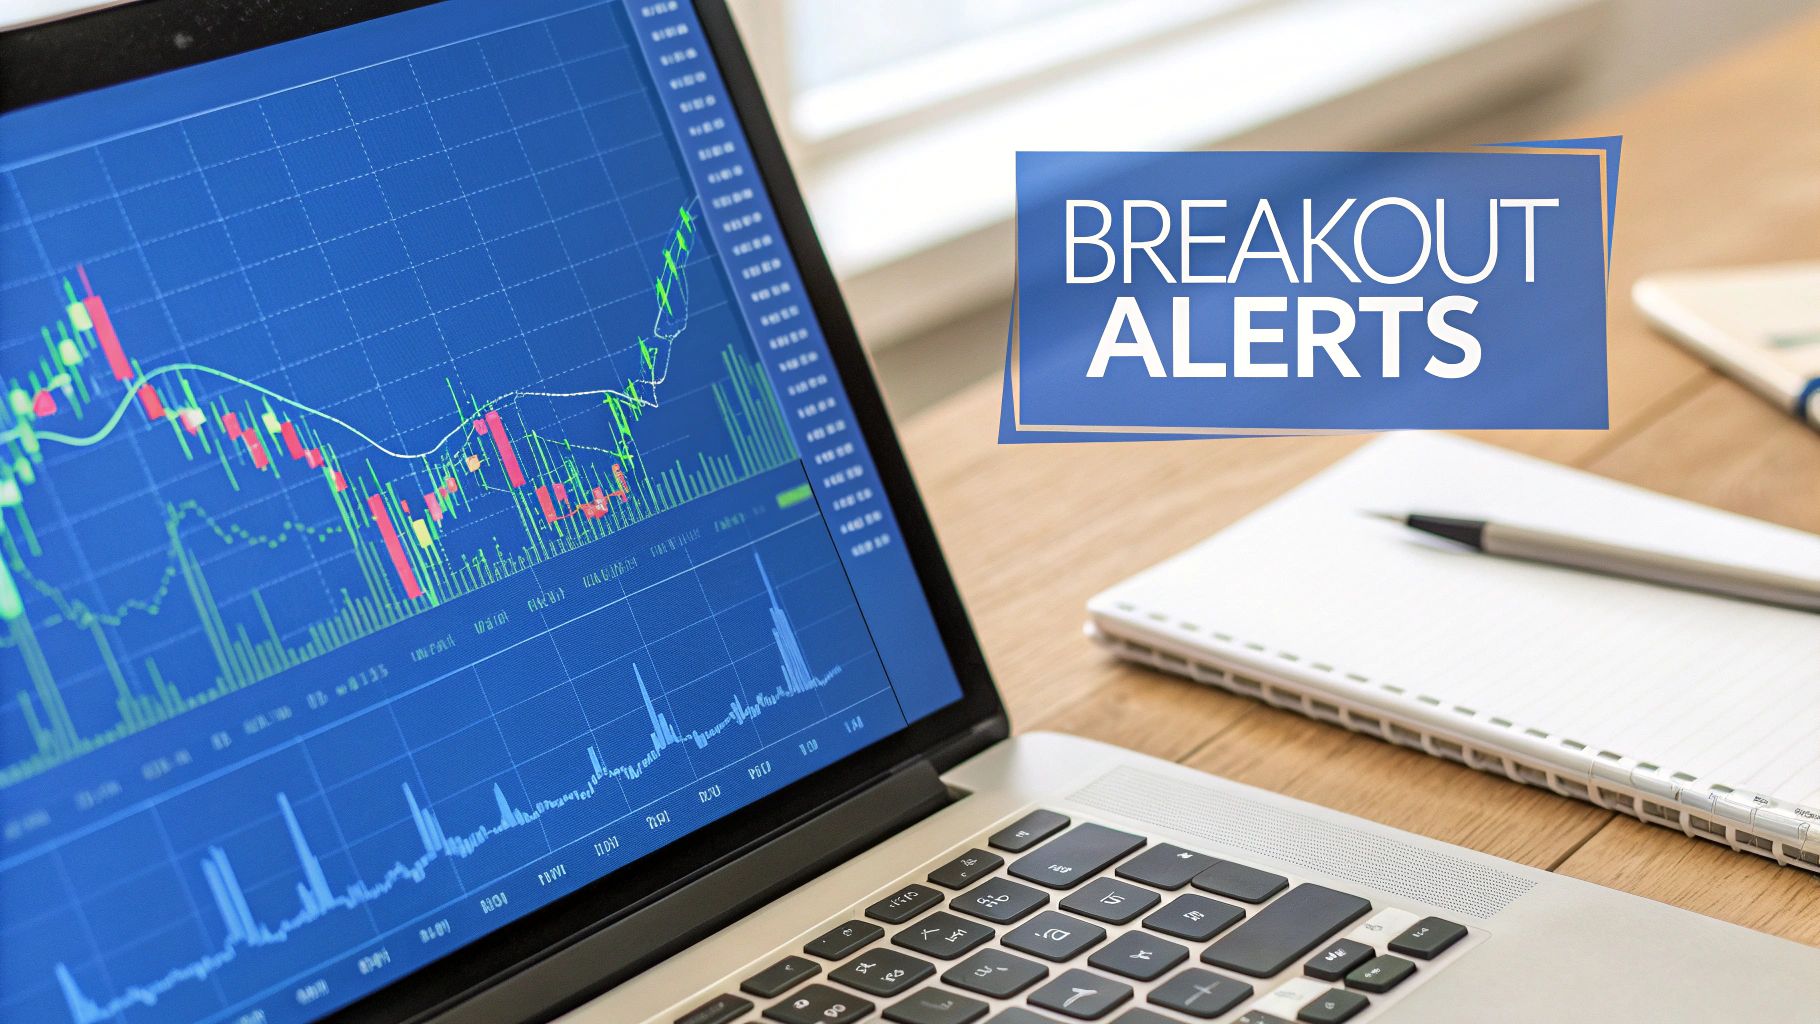
Hunting For Breakouts
Breakout trading is a classic momentum strategy. It’s all about identifying stocks that are punching through significant price ceilings, known as resistance levels. The logic here is simple: once a stock shatters a well-established barrier, it has a much higher chance of continuing in that direction, often with serious force. A real-time scanner is the perfect tool for this job.
To hunt for breakouts, you need to tell your scanner to watch for a specific cocktail of price action and volume. Volume is the critical piece of the puzzle. A breakout on low volume is often just a fake-out, while a massive surge in trading activity is what validates the move.
Here's a sample filter configuration for a breakout scan:
- Price Filter: Current price crosses above the 20-day high. This finds stocks challenging their recent peaks.
- Volume Filter: Current 5-minute volume is greater than 300% of the 5-minute average volume. This confirms strong buying interest is fueling the move.
- Float Filter: Share float is under 50 million. Lower-float stocks tend to move much more explosively once they finally break out.
When an alert from this scan hits your screen, you can immediately pull up the chart to confirm the setup and start planning your entry.
Capturing Morning Momentum
The market open is chaos. It's often the most volatile period of the day, but that chaos presents a ton of opportunity. The "Morning Momentum" strategy uses a scanner to find stocks already showing exceptional strength in the pre-market session, letting you act the moment the opening bell rings. These are usually stocks reacting to overnight news, a killer earnings report, or a big analyst upgrade.
Your scanner’s job is to find these pre-market "gappers"—stocks opening at a price significantly higher or lower than their previous close—and flag them for you.
The goal isn't just to find any stock that is gapping up. It's to find the ones with the volume and price action suggesting the momentum has legs and will continue into the regular session. This is proactive hunting at its finest.
A typical morning momentum scan might look like this:
- Pre-Market Gap Filter: Price is up more than 4% from yesterday's close.
- Pre-Market Volume Filter: Pre-market volume is over 100,000 shares, which weeds out illiquid stocks with no real institutional interest.
- Price Range Filter: Stock price is between $5 and $100. This helps focus your attention on a manageable universe of stocks.
This scan delivers a focused watchlist of the day's hottest stocks right at the open, giving you a head start.
Spotting Potential Reversals
While momentum strategies chase the trend, reversal trading is all about identifying the exact moment a trend gets exhausted and is likely to change direction. This usually means finding stocks that are "overbought" or "oversold"—they've moved too far, too fast, and are due for a snapback. This requires a more nuanced set of filters.
The demand for real time stock scanners has skyrocketed, with usage surging 45% year-over-year from 2023 to 2026, driven by these advanced capabilities. Modern platforms now offer over 1,000 screening criteria, including proprietary filters perfect for spotting complex patterns like reversals. You can discover more insights about the evolution of these advanced trading tools and their features.
To set up a scan for a potential bullish reversal (trying to catch a bottom), you could use these filters:
- Technical Indicator Filter: The Stochastic Oscillator is below 20, signaling an oversold condition.
- Price Action Filter: The stock has just made a new 10-day low.
- Confirmation Filter: Current price crosses above the 5-period moving average on the 15-minute chart. This shows a potential shift in short-term momentum.
This kind of scan helps you pinpoint stocks that are beaten down but are showing the very first signs of a potential bounce.
The table below offers a few more starting points, showing how different filter combinations can be tailored to various common trading styles.
Sample Scanner Configurations for Common Trading Strategies
| Trading Strategy | Primary Filter 1 | Primary Filter 2 | Primary Filter 3 | Objective |
|---|---|---|---|---|
| Gap and Go | Pre-Market Gap > 5% | Pre-Market Volume > 200k | Price > $5 and < $75 | Find stocks gapping up with high interest for a continuation play at the open. |
| High Volume Breakout | New 52-Week High | Relative Volume > 3.0 | Avg. Daily Volume > 1M | Identify stocks breaking to new annual highs on exceptionally high volume. |
| Dip Buying (Uptrend) | Price > 50-Day Moving Avg. | % Change from High < -10% | RSI (14) < 40 | Find strong stocks in a long-term uptrend that are experiencing a temporary pullback. |
| Bearish Breakdown | New 20-Day Low | Price < 200-Day Moving Avg. | Relative Volume > 2.0 | Locate stocks breaking key support levels with heavy selling pressure. |
Think of these configurations as recipes. They are excellent starting points, but the best traders constantly tweak and refine their scans to match their personal style and current market conditions. The key is to build a setup that consistently finds the opportunities you are best at trading.
Choosing the Right Stock Scanner for Your Needs
Picking the right scanner is a make-or-break decision for a trader. It’s like a pilot choosing an aircraft for a specific mission—you wouldn’t take a jumbo jet to go crop dusting, and you definitely shouldn't use a slow, long-term screener to scalp intraday moves. The tool has to match the job. Your choice needs to line up perfectly with your unique trading style and strategy.
So, how do you navigate the options? Think of it like you're evaluating a high-performance car. You'd inspect the engine for speed, the navigation system for its reach, the onboard computer for its intelligence, and the cockpit for how it feels to drive. A scanner is no different.
Evaluating Data Accuracy and Speed
The engine of any real time stock scanner is its data feed. This is the one area you absolutely cannot compromise on. You need data that is both dead-on accurate and delivered with the lowest possible latency. A delay of just a single second can be the difference between nailing a breakout and chasing a stock that has already left the station.
When looking at a platform, ask these questions:
- Data Source: Is it a direct feed from the exchanges, or is it coming from a less reliable third-party provider?
- Latency: Does the provider actually state their data delivery speed? Professional-grade tools will often brag about sub-second updates.
- Reliability: Is the platform known for staying stable during peak market chaos, or does it lag and freeze right when you need it most?
The shift to tools delivering data on every single trade has been a total game-changer. In fact, day traders using real-time scanners have been shown to achieve up to 30% higher win rates compared to those stuck with 15-minute delayed data.
Assessing Market Coverage and Filter Depth
Next up, you have to consider the universe the scanner can actually see. If you trade obscure small-cap stocks or international markets, a scanner that only covers the S&P 500 is completely useless to you. Make sure the platform covers the exchanges and assets you trade, including pre-market and after-hours sessions if that's part of your game plan.
Beyond just coverage is the scanner's intelligence—the depth of its filters. A basic scanner might let you filter by simple price and volume. A professional tool, like ChartsWatcher, lets you build multi-layered, complex queries. This is the difference between asking "show me stocks moving up" and asking "show me stocks hitting a 20-day high, on 3x average volume, with an RSI below 70, and a float under 20 million shares."
The depth of your scanner’s filters directly corresponds to the precision of your trading strategy. The more specific the questions you can ask, the higher the quality of the setups you will find.
Matching the Interface to Your Workflow
Finally, let's talk about the cockpit—the user interface (UI) and user experience (UX). The most powerful scanner on earth is worthless if it’s clunky and a pain to use. A scalper who jumps in and out of dozens of trades an hour has completely different UI needs than a swing trader who might place only one or two trades a day.
Look for a platform that you can really make your own. Can you create and save multiple layouts? Can you sync windows so that clicking an alert instantly brings up that stock on your chart and in your news feed? This kind of seamless integration is what turns a simple tool into a true trading command center, cutting down on friction and speeding up your decisions.
For an in-depth look at different platforms, check out our guide on the 12 best stock scanners for day trading in 2025. By carefully weighing these key pillars—speed, coverage, intelligence, and usability—you can find a scanner that acts as a true extension of your trading mind.
Common Questions About Real-Time Stock Scanners
Even after you get the basic idea of what a real-time stock scanner does, a few practical questions always seem to pop up. Let's tackle some of the most common ones I hear from traders so you can figure out how one of these tools might fit into your own workflow.
Screener Versus Scanner: What’s the Real Difference?
This is probably the most frequent question, and the answer comes down to one thing: time.
A traditional stock screener is like taking a snapshot of the market. It runs on data that’s already old—often delayed by 15 minutes or based on yesterday's closing prices. This makes it great for long-term investors looking for stocks based on static fundamentals, like a certain P/E ratio. A screener shows you what happened.
A real-time scanner, on the other hand, is a live video feed. It’s processing the market’s every move as it happens, second by second. For an intraday trader, this is non-negotiable. You need to react instantly when a stock suddenly gets a massive volume spike or breaks through a key price level. Scanners are built for action; screeners are built for analysis after the fact.
Can Beginners Use These Scanners Effectively?
Absolutely, but you have to go in with a plan. Firing up a scanner for the first time can feel like trying to drink from a firehose—alerts are flying everywhere. If you don't know what you're looking for, it's just noise.
The key is to start simple. Don't try to build some hyper-complex scan with a dozen different filters. Pick one or two specific, easy-to-understand strategies and focus on those.
Start by building a single scan, like one that finds stocks with unusually high relative volume. This lets you learn how the scanner thinks and how your strategy behaves in a live market, all without getting lost in the chaos. It transforms the scanner from a distraction into a focused hunting tool.
Plenty of platforms, including ChartsWatcher, have free or trial versions that are perfect for this. You can get your hands dirty, test your ideas with paper trading, and build confidence before you commit any real capital.
How Much Does a Professional Scanner Cost?
The price range for real-time stock scanners is pretty wide. You'll find everything from free, basic tools to institutional-level platforms that can run you several hundred dollars a month. The price usually boils down to a few key things:
- Data Quality and Speed: Getting the fastest, most reliable data straight from the exchanges costs money.
- Filter Depth: The power to build complex, multi-layered scans with your own custom formulas is a premium feature.
- Advanced Features: Things like historical backtesting, integrated news feeds, and algorithmic alerts all add to the price tag.
While a professional scanner is a subscription, it’s better to think of it as an investment in your trading business. The cost is often easily covered by the quality of opportunities it helps you find—the kind of setups you would almost certainly miss otherwise.
Ready to stop reacting to the market and start anticipating its every move? With ChartsWatcher, you get the institutional-grade speed, deep filtering, and fully customizable cockpit you need to execute your strategy with precision. Build your professional trading dashboard and start finding better opportunities today.
