Oversold Vs Overbought A Trader's Guide To Market Extremes
At its core, the difference between oversold and overbought is pretty simple. Oversold means an asset's price has dropped too hard, too fast, and might be ready for a bounce. Overbought is the opposite—the price has rocketed up and could be due for a pullback.
Think of them as tension gauges for the market, flagging when a price swing has gone to an unsustainable extreme.
Defining Market Extremes
In technical analysis, spotting when a stock is oversold or overbought is a cornerstone of timing your entries and exits. But let's be clear: these are not automatic buy or sell signals. They are warnings that the current momentum might be running out of gas.
A stock can stay stubbornly overbought in a monster uptrend or remain deeply oversold in a brutal downtrend, which is why context is everything.
The go-to tools for spotting these conditions are momentum oscillators—indicators that fluctuate between high and low bands. The most common ones you'll see are the Relative Strength Index (RSI) and the Stochastic Oscillator. They help traders quantify buying and selling pressure to see if a security is trading at an unusual price relative to its recent past.
Core Concepts Explained
Getting a handle on these conditions helps you sidestep classic trading blunders, like piling into a stock at the very peak of a rally or panic-selling at the absolute bottom.
- Oversold: This happens after a steep price decline. It suggests that the selling pressure is getting exhausted and the asset might be undervalued, creating a potential buying opportunity for contrarian traders looking to catch a reversal.
- Overbought: This follows a sharp price run-up. It implies that the buying frenzy is fading and the asset could be overvalued, signaling a potential chance to short the stock or take profits off the table.
The framework for these ideas was really cemented with the development of the Relative Strength Index (RSI). Historical data on U.S. stocks often reveals that 10-day forward returns average between 0.5%–0.8% after the RSI falls below 30 (oversold). In contrast, returns average just 0%–0.4% after the RSI climbs above 70 (overbought).
This statistical edge is exactly why professional scanning tools like ChartsWatcher are built to flag these specific RSI levels across thousands of stocks. You can dive deeper into how traders use these levels with this guide from IG.com.
Key Takeaway: Oversold and overbought conditions are not guarantees of a price reversal. They are simply indicators of stretched price action that demand confirmation from other signals before you even think about placing a trade.
Oversold Vs Overbought At A Glance
To make things even clearer, here's a quick side-by-side comparison of the two market states. It's a handy cheat sheet for remembering the key differences.
| Attribute | Oversold | Overbought |
|---|---|---|
| Market Psychology | Excessive pessimism or panic selling | Excessive optimism or euphoric buying |
| Price Action | Sharp, sustained price drop | Sharp, sustained price rise |
| Potential Outcome | Price rebound (bounce) | Price correction (pullback) |
| Common RSI Level | Below 30 | Above 70 |
| Implied Opportunity | Potential entry for a long position | Potential entry for a short position |
Ultimately, this table sums up the core dynamics. Oversold conditions are born from fear, while overbought conditions are fueled by greed. Recognizing which one is in play is the first step toward making smarter, more calculated trading decisions.
Using Key Indicators To Identify Market Extremes
Figuring out when a market is stretched too far in one direction isn't guesswork. It's more of a science, thanks to a specific class of technical indicators called oscillators. These tools help us visualize momentum and spot potential reversals by flagging oversold vs overbought conditions.
But here's the catch: not all indicators measure these extremes the same way. Relying on an indicator without knowing how it works is like flying a plane without reading the instruments—you might get lucky for a bit, but it's a disaster waiting to happen. The three workhorses for this job are the Relative Strength Index (RSI), the Stochastic Oscillator, and Bollinger Bands.
This chart gives you a clean visual breakdown of how oscillators signal these critical market states.
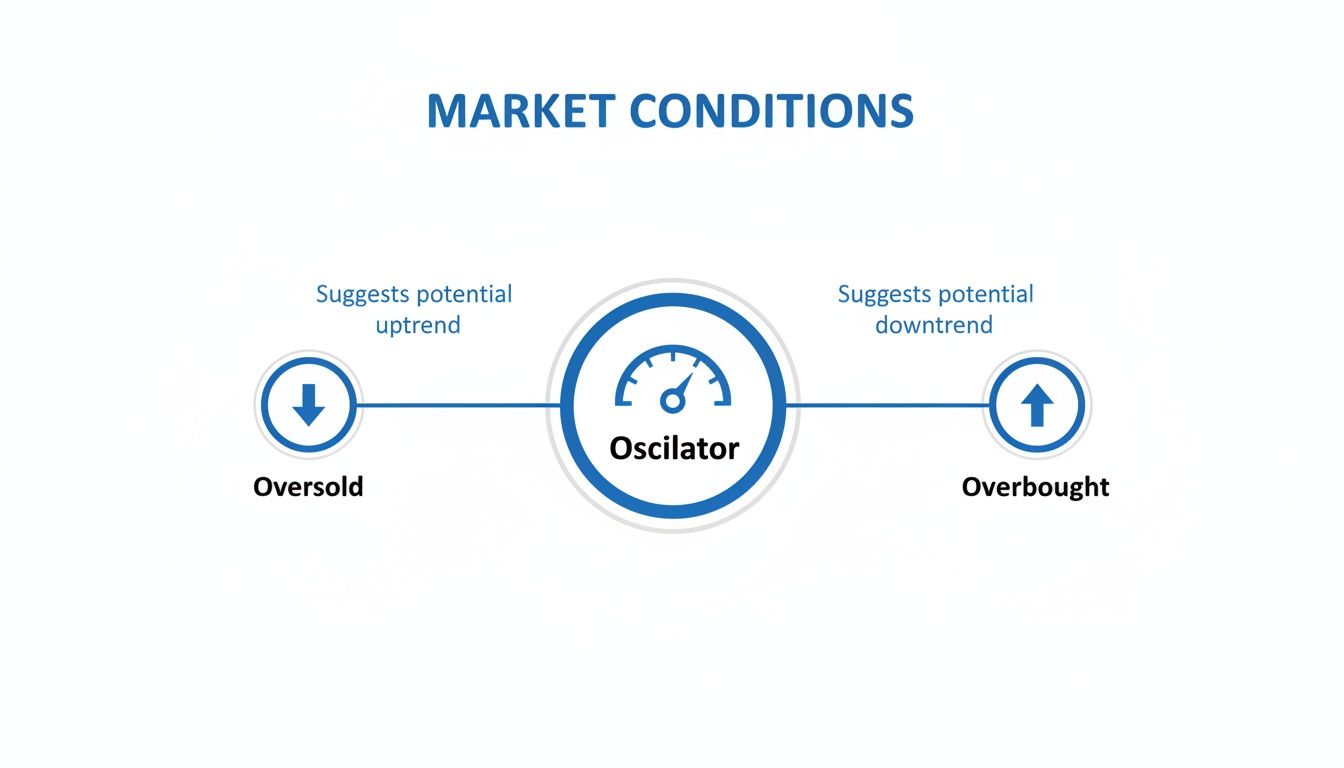
As you can see, an oscillator acts like a pressure gauge. Readings in the lower zone suggest an oversold condition, while readings in the upper zone point to an overbought one.
Relative Strength Index (RSI)
The Relative Strength Index, or RSI, is hands down the most popular momentum oscillator out there. Developed by J. Welles Wilder, it measures the speed and magnitude of price movements on a simple 0 to 100 scale. Its main job is to help traders see if an asset has moved too far, too fast.
The standard interpretation is straightforward:
- A reading above 70 suggests the asset is getting overbought and might be due for a pullback.
- A reading below 30 indicates the asset is oversold and could be ready for a bounce.
Now, these levels aren't sacred. In a monster uptrend, the RSI can stay pinned above 70 for a long time. In a brutal downtrend, it can live below 30. This is why some traders adjust the levels to 80/20 in volatile markets to filter out the noise. You can dig deeper into some of the top overbought and oversold indicators for traders in our detailed guide.
Stochastic Oscillator
Like the RSI, the Stochastic Oscillator is a momentum indicator that moves between 0 and 100. It also uses threshold levels—typically 80 for overbought and 20 for oversold—to signal potential turning points. At first glance, they seem almost identical, but under the hood, their calculations are worlds apart.
The key difference is in their formulas:
- RSI compares the size of recent gains to recent losses, giving you a read on the strength of the momentum.
- Stochastic Oscillator compares a security's closing price to its price range over a set period. It's built on the idea that in an uptrend, prices tend to close near their highs, and in a downtrend, they close near their lows.
Think of it this way: RSI measures the speed of the price move, while the Stochastic measures the position of the price within its recent trading range. A high RSI means prices went up fast; a high Stochastic reading means the price is closing near the top of its range.
Bollinger Bands
Bollinger Bands give you a totally different way to see overbought and oversold conditions. Instead of a bounded oscillator like the RSI or Stochastics, this indicator is made up of three lines drawn directly on the price chart: a simple moving average (the middle band) and two outer bands that represent standard deviations from that average.
Reading them is pretty intuitive:
- Overbought: When the price pushes up and touches or breaks above the upper band, it’s considered relatively high. This tells you the price has stretched significantly from its average and could snap back.
- Oversold: When the price drops and hits or falls below the lower band, it's considered relatively low. This is a sign that selling pressure might be running out of steam, and a bounce could be coming.
What makes Bollinger Bands so useful is that they are dynamic. They automatically get wider when volatility picks up and tighter when things calm down. This built-in adaptability helps them identify relative price extremes no matter what the market is doing.
Ultimately, no single indicator is a magic bullet. The sharpest traders use them in combination, always waiting for price action to confirm the signal before pulling the trigger. An RSI reading below 30 is a heads-up, but a strong bullish candle forming right after is a much better reason to get in the game.
Advanced Strategies With Divergence And Timeframes
Just spotting a basic oversold or overbought signal is a good first step, but the real trading edge comes when you start layering your analysis. The two most powerful techniques you can add are divergence and multi-timeframe analysis. Getting these right will help you pinpoint high-probability reversals and, just as importantly, avoid fighting a monster trend you can't see on your chart.
Acting on an RSI reading below 30 or above 70 by itself is a classic rookie move. Experienced traders are always scanning for a mismatch between what the price is doing and what the indicator is telling them. That disconnect is called divergence, and it often shows up right before a major trend runs out of gas.
The Power Of Bullish And Bearish Divergence
Think of divergence as a bright red flag that momentum is sputtering, even while the price keeps pushing to new extremes. It’s a sign that the fuel driving the move is running low. There are two flavors you absolutely need to know.
Bullish Divergence (Oversold Signal) This pattern pops up when an asset’s price carves out a new low, but your momentum indicator (like RSI or Stochastics) makes a higher low. It’s the classic setup you want to see in an oversold market.
- Price Action: Making lower lows as sellers stay in control.
- Indicator Action: Making higher lows, showing that selling momentum is fading fast.
- What It Means: Despite the lower price tag, the selling pressure is losing steam. This is often the first warning that the downtrend is exhausted and a bounce or bullish reversal is on the table.
Bearish Divergence (Overbought Signal) This is the mirror image. It happens when the price pushes to a fresh high, but the indicator forms a lower high. You'll find this setup lurking in overbought markets.
- Price Action: Making higher highs as buyers push the price up.
- Indicator Action: Making lower highs, signaling that buying momentum is drying up.
- What It Means: The rally might look impressive on the surface, but the weakening indicator reveals that the buying power is fading. It’s a huge warning sign that an uptrend could be topping out, setting the stage for a reversal.
Trader's Insight: Divergence is one of the most reliable leading indicators out there. When you spot bullish divergence in an oversold market, it’s a far more compelling reason to buy than just an oversold reading alone.
Aligning Signals With Multi-Timeframe Analysis
Another common pitfall is trading an oversold signal in a vacuum. A stock can look dangerously overbought on a 15-minute chart while it's just starting a massive breakout on the daily chart. If you act on that short-term signal, you’re trying to short a freight train.
This is where multi-timeframe analysis saves your bacon. The whole idea is to use the longer timeframes to figure out the dominant trend and then use the shorter timeframes to nail your entry and exit.
Let’s say you’re a swing trader who lives on the daily chart. Here’s how you’d use this approach:
- The Big Picture (Weekly Chart): First, zoom out to the weekly chart. If the trend is screaming upwards, your job is to look for buying opportunities, period. You shouldn't even be thinking about shorting.
- Your Main Chart (Daily Chart): Now, drop down to your daily chart. You notice the price is pulling back and the RSI is getting close to that 30 oversold level. This is a potential entry point that lines up perfectly with the bigger uptrend.
- Timing the Entry (4-Hour Chart): Finally, you can drill down to a 4-hour or 1-hour chart to fine-tune your entry. Here, you wait for the RSI to dip into oversold territory and then look for bullish divergence or a strong confirmation candle before pulling the trigger on a long trade.
This top-down process makes sure you're swimming with the current, not against it. It helps you filter out the noise and focus only on the setups where the odds are stacked in your favor. When you combine divergence with multi-timeframe analysis, you turn a simple oversold reading into a complete, context-aware trading strategy.
Building A Practical Trading Strategy
Knowing the difference between oversold vs overbought is one thing. Turning that knowledge into a profitable, repeatable trading strategy is a whole different ball game.
A solid plan moves beyond simply spotting an extreme RSI reading and builds a complete system with clear rules for entry, exit, and risk management. Without this structure, you're just guessing. The goal is to create a mechanical process that strips emotion out of your trading decisions.
Let's break down how to construct two distinct strategies: one for buying oversold dips and another for shorting or selling overbought peaks. Both will hinge on confirmation and strict risk controls—the stuff that keeps you in the game long-term.

A Checklist For Trading Oversold Conditions
When a stock enters oversold territory, the herd is panicking. Your job is to stay calm, wait for the selling pressure to exhaust itself, and look for signs that buyers are cautiously stepping back in. This checklist will give you a disciplined approach for going long.
- Wait for the Initial Signal: This part is purely mechanical. You wait for the 14-period RSI to dip below 30. This is your initial alert—a flashing light that an asset is potentially undervalued. It is not a buy signal.
- Confirm the Reversal: Do not buy just because RSI is low. The crucial next step is to wait for the RSI to cross back above the 30 level. This is your first real clue that momentum might be shifting from bearish back to bullish.
- Validate with Price Action: An indicator signal is worthless without price confirming the story. Look for a clear bullish candlestick pattern forming right as the RSI crosses back above 30. Think classic reversal patterns like a hammer, a bullish engulfing candle, or a morning star formation.
- Define Your Risk: Before you even think about hitting the "buy" button, find the most recent swing low—the absolute bottom of the recent price dip. Your stop-loss order gets placed just below this level. This protects your capital if the reversal turns out to be a fakeout.
- Calculate Position Size: Your risk is the distance between your entry price and your stop-loss. Adjust your position size so that a move to your stop results in a manageable loss, typically 1-2% of your total trading capital.
This methodical process ensures you never jump the gun. You're patiently waiting for the market to prove that the downward momentum has faded before you put a single dollar at risk.
Key Rule: Never, ever treat an oversold indicator as a standalone buy signal. Always require confirmation from both the indicator itself (crossing back above 30) and the price action on the chart.
A Checklist For Trading Overbought Conditions
The strategy for handling overbought conditions is the mirror opposite. Here, the market is euphoric, and your goal is to spot the first signs of buyer exhaustion before a potential pullback or reversal kicks in.
- Wait for the Initial Signal: The process starts when the 14-period RSI moves above 70. This is your heads-up that the asset is getting stretched and potentially overvalued. Again, this is not a sell signal.
- Confirm the Reversal: The real trigger is waiting for the RSI to cross back below the 70 level. This suggests that the intense buying pressure is finally starting to fizzle out.
- Validate with Price Action: As the RSI drops below 70, look for a bearish candlestick pattern to confirm the momentum shift. Common patterns to watch for include a shooting star, a bearish engulfing pattern, or an evening star.
- Define Your Risk: Your defensive line is the most recent swing high—the very peak of the recent rally. Place your stop-loss order just above this level to limit your losses if the uptrend unexpectedly roars back to life.
- Set Your Target and Manage Risk: A common target for a mean-reversion trade is the 20-period moving average. Make sure your potential profit (the distance to your target) is at least 1.5 to 2 times your potential loss (the distance to your stop-loss). This keeps your risk-to-reward ratio healthy.
By following these checklists, you transform the abstract concepts of oversold and overbought into a concrete, rules-based trading plan. This discipline is what separates traders who get consistent results from those who are just riding an emotional rollercoaster.
Finding Opportunities With ChartsWatcher Scans
Theory is great, but let's be honest: manually hunting for oversold and overbought setups across thousands of stocks is a recipe for frustration. This is where automation becomes your best friend. A powerful scanning tool like ChartsWatcher lets you build custom screeners that do the heavy lifting, digging up high-probability opportunities in real-time.
This whole process is about turning the trading rules we just discussed into an automated workflow. You stop guessing and start systematically finding assets that meet your exact criteria for a potential trade.

Building Your Oversold Stock Scanner
First up, let's build a scanner to pinpoint potentially undervalued stocks that are getting stretched to the downside. The goal here is simple: filter out all the market noise and laser-focus on liquid stocks hitting specific technical triggers.
Here’s how you can build your first oversold scan in ChartsWatcher, step-by-step:
- Set the Primary Condition: The RSI is the heart of this scan. We'll set the filter to find stocks where the 14-period RSI is below 30. This is our initial flare, telling us a stock has officially entered oversold territory.
- Add Liquidity Filters: A killer setup on an illiquid stock is a trap waiting to happen. To make sure we're only looking at companies that are actively traded, we'll add two critical filters. First, set Average Volume (30-Day) to be greater than 1,000,000. Second, set the Price to be greater than $5 to steer clear of penny stock chaos.
- Refine Your Universe: You can dial this in even further by specifying which exchanges to scan (like NYSE or NASDAQ) or by focusing on certain market cap ranges.
Once that's configured, the scanner will continuously sift through the market, serving you a clean, actionable list of stocks that match every single one of your rules.
Creating The Parallel Overbought Scan
Now, let's create the mirror image—a scanner to find overbought stocks that might be running out of steam and due for a pullback. The logic is almost identical, but we’re hunting for signs of excessive buying instead of selling exhaustion.
- Primary Condition: Tweak the main filter to find stocks where the 14-period RSI is above 70. This flags assets that have had a strong, potentially unsustainable run-up.
- Liquidity Filters: We'll use the same quality control metrics here. Set Average Volume (30-Day) to be greater than 1,000,000 and Price greater than $5.
With these two scanners running, you’ve essentially automated the entire discovery phase for both long and short mean-reversion strategies. For some more advanced ideas, check out our guide on the top stock RSI screener tips.
Pro Tip: Don't just stop at one indicator. ChartsWatcher lets you stack conditions. For example, you could add a filter requiring the price to be below the 200-day moving average on your oversold scans. This helps ensure you're not trying to catch a falling knife in a stock that's in a nasty long-term downtrend.
Activating Real-Time Alerts and Backtesting
Finding a setup is only half the battle; timing is everything. ChartsWatcher lets you create real-time alerts based on your custom scans. That means you get an instant notification via email or in the app the moment a stock meets your criteria. You'll never miss an opportunity because you blinked.
But before you put any real capital on the line, you absolutely must validate your strategy. This is where backtesting comes in. The platform’s backtesting engine lets you run your oversold or overbought scanning strategy against years of historical data. This process spits out the metrics that actually matter:
- Win Rate: What percentage of trades made money?
- Average Gain/Loss: How much did the winners make versus what the losers lost?
- Max Drawdown: What was the biggest hit your account would have taken?
By digging into this data, you can see exactly how your oversold vs overbought strategy would have performed in the past. This historical perspective is invaluable for tweaking indicator settings, optimizing your entry and exit rules, and building the confidence to actually pull the trigger when real money is at stake.
The Classic Mistakes Traders Make at Market Extremes
Knowing the difference between oversold vs overbought is a great first step, but plenty of otherwise sharp traders get tripped up by a few classic, predictable traps. Getting a handle on these mistakes is how you stop giving back profits and start protecting your capital from totally avoidable losses.
One of the quickest ways to blow up an account is fighting a powerful trend. A trader spots the RSI poking above 70, immediately mashes the sell button, and then just watches in horror as the stock keeps ripping higher. They've forgotten a fundamental market truth.
Key Insight: Overbought can always get more overbought, and oversold can always get more oversold. In a market that’s clearly trending, these conditions are often a sign of strength, not a signal that the party's over.
Jumping the Gun Without Confirmation
Another major pitfall is treating an indicator flash as a direct order to trade. An RSI dip below 30 isn't a buy signal; it's a tap on the shoulder telling you to pay attention. Acting on that initial alert without waiting for any kind of proof that buyers are actually stepping in is just straight-up gambling.
Here’s how this mistake usually plays out:
- The Trap: A trader sees a stock’s RSI hit 29 and buys, thinking they’ve perfectly timed the absolute bottom.
- The Reality: The stock keeps tanking, and the RSI grinds along in oversold territory for days, racking up ugly losses.
- The Fix: A patient trader waits. They wait for the RSI to not just hit 30, but to cross back above it. Then, they look for other clues, like a bullish candlestick pattern, to confirm that momentum has actually turned.
Trading in a Vacuum
Finally, a huge number of traders get so focused on one chart that they completely ignore the bigger picture. They’ll try to scalp an oversold bounce just minutes before a major inflation report drops, wondering why their perfect technical setup got steamrolled. You can't ignore the context.
Just as bad is sticking to one-size-fits-all indicator settings. The standard 14-period RSI might be fine for a steady blue-chip stock, but it could be way too sluggish for a volatile tech name or a fast-moving crypto asset. Never assume the default settings are right for what you're trading. Smart traders always test their tools and tweak the parameters to fit the instrument and their timeframe.
Common Questions Answered
Let's clear up some of the most common questions traders have when they first start digging into oversold and overbought conditions. Getting these concepts right is a huge step forward.
Can a Stock Stay Oversold or Overbought for a Long Time?
Yes, absolutely. This is one of the most painful lessons for traders who jump the gun. In a monster uptrend, a stock's RSI can ride above 70 for weeks, sometimes even months. The same thing happens in reverse during a nasty downtrend, where the RSI can get pinned below 30 and stay there.
This is exactly why you can't trade on an indicator signal alone. Seeing an "overbought" reading in a raging bull market is more often a sign of incredible strength, not a signal that the top is in. You always have to look at the bigger picture—the primary trend is king.
Which Indicator is Best for This?
There's no magic bullet here; the "best" indicator is the one that fits your trading style. The RSI is hands-down the most popular because it's a straightforward way to measure the speed and change of price movements. The Stochastic Oscillator, on the other hand, is great for seeing where the current price closed relative to its recent high-low range.
If you want a more dynamic view, Bollinger Bands are fantastic because they expand and contract based on volatility. A lot of seasoned traders will actually layer these tools. For instance, they might see an RSI reading pop into overbought territory, but they'll wait for the price to actually touch the upper Bollinger Band before even thinking about a short. It’s all about building confirmation.
Is It Better to Trade With the Trend or Against It?
Trying to pick tops and bottoms by shorting overbought signals or buying oversold ones is a classic counter-trend strategy. It can be incredibly profitable, but it's also a higher-risk game. For most traders, a more reliable approach is to use these signals to find better entry points within an existing trend.
A Smarter Way to Trade: Imagine a stock is in a solid uptrend. Instead of trying to short every overbought signal, you ignore them completely. You wait for the inevitable pullback, the one that pushes the RSI down into oversold territory (below 30). That dip is your chance to buy in at a better price and ride the next wave up. This way, you're trading with the market's main momentum, not fighting it.
Ready to turn this theory into a real, tradable edge? ChartsWatcher gives you the powerful scanning and backtesting tools needed to find, test, and act on these setups with confidence. Start building your custom oversold and overbought scans today.
