Top Stock RSI Screener Tips for Smarter Trading in 2025
Unleash the Power of RSI: Supercharge Your Stock Picks
Want to identify overbought and oversold stocks quickly? A reliable stock RSI screener is essential. This listicle presents seven powerful stock RSI screeners to streamline your stock analysis and enhance your trading strategies. Discover the top platforms for 2025 and beyond, offering features like customizable dashboards and real-time data, so you can pinpoint promising investments efficiently. Learn how these tools can help you find winning trades and avoid those showing weakness by quickly identifying stocks with high or low RSI values. This article covers ChartsWatcher, TradingView Stock Screener, Finviz Stock Screener, StockFetcher, TC2000 Stock Screener, Yahoo Finance Stock Screener, and Zacks Stock Screener.
1. ChartsWatcher: A Powerful Stock RSI Screener and So Much More
ChartsWatcher is a highly customizable stock market scanning software designed for serious traders seeking a competitive edge. Whether you're a professional analyst, an institutional investor, or an independent day trader, ChartsWatcher's dynamic platform empowers you to create personalized screen configurations tailored to your specific needs. Its comprehensive suite of tools goes beyond basic stock screening, offering real-time alerts, advanced charting, integrated newsfeeds, and, importantly for our focus, robust filtering based on technical indicators like the Relative Strength Index (RSI). This makes it a powerful stock RSI screener that allows traders to identify potential overbought or oversold conditions quickly.
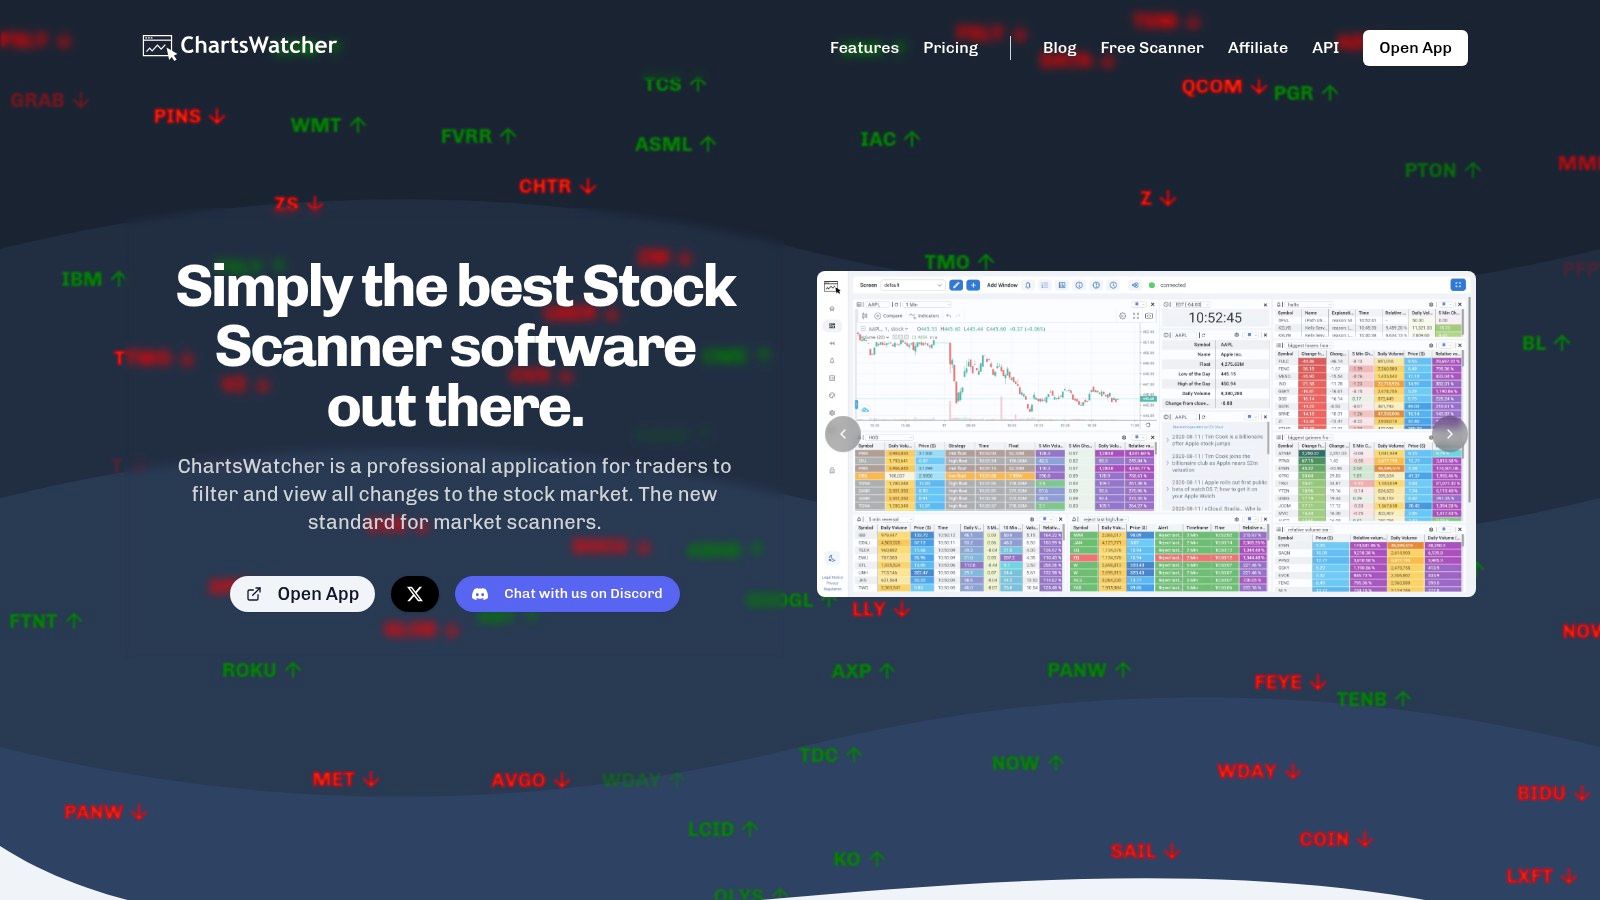
Imagine having up to eight different interactive windows open simultaneously, each displaying critical market information. One window might show a real-time stock RSI screener filtering for stocks with an RSI below 30 (a potential buy signal). Another could be tracking your customized watchlist, while a third displays a candlestick chart with overlaid technical indicators. This level of multi-faceted market observation is precisely what ChartsWatcher provides. You're not just passively observing the market; you're actively engaging with it, armed with real-time data and powerful analytical tools. For those focused on RSI, the ability to create highly specific filters allows you to pinpoint stocks meeting your precise RSI criteria, whether it's looking for overbought conditions, potential reversals, or simply tracking stocks within a specific RSI range.
One of ChartsWatcher's key strengths lies in its extensive filtering and alert capabilities. You can build complex, precise trading strategies based on various market indicators, including the RSI, moving averages, volume, and candlestick patterns. For example, using ChartsWatcher as a stock RSI screener, you could set an alert to trigger when a stock on your watchlist crosses below a certain RSI threshold, signaling a potential overselling situation and a buying opportunity. This level of granularity allows you to fine-tune your approach and react quickly to market fluctuations. Furthermore, the backtesting feature (available in the Pro Plan) allows you to test your RSI-based strategies against historical market data, giving you valuable insights into their potential effectiveness before implementing them in live trading.
ChartsWatcher understands the diverse needs of traders and offers flexible pricing plans to accommodate them. The free basic plan provides access to essential features, allowing users to experience the platform and explore its core functionalities. For those requiring more advanced tools like backtesting, import/export configurations, and access to a broader range of data, the Pro Plan, priced at $74.99/month (billed annually), provides a robust solution. While the annual billing might be a drawback for some preferring month-to-month flexibility, the comprehensive feature set justifies the cost for serious traders.
Compared to other stock screeners, ChartsWatcher distinguishes itself with its high degree of customization, the ability to create multiple screen configurations, and the depth of its filtering and alert options. While some screeners may focus solely on basic technical indicators, ChartsWatcher empowers traders to create sophisticated, multi-layered strategies incorporating real-time data, news, and advanced charting.
Setting up ChartsWatcher is straightforward. After creating an account and choosing your preferred plan, you can begin customizing your dashboards. The intuitive interface allows you to drag and drop different window types, configure filters, and set alerts based on your specific requirements. The platform is designed to be user-friendly, even with its extensive feature set, making it accessible to both experienced traders and those new to market scanning software. To effectively utilize ChartsWatcher as a stock RSI screener, take advantage of the filtering options. Experiment with different RSI thresholds, combine RSI filters with other technical indicators, and utilize the backtesting feature to optimize your strategies.
Pros:
- Highly customizable dashboard with up to 8 window types and multiple screen configurations.
- Extensive filter and alert options supporting complex, precise trading strategies.
- Backtesting feature enabling users to validate strategies with historical market data.
- Flexible pricing plans including a free tier and scalable options for different trader needs.
- Real-time market data and newsfeeds integrated with customizable keywords and alerts.
Cons:
- Advanced features like backtesting and import/export configurations require a paid subscription.
- Pricing plans billed annually may be less appealing for users preferring month-to-month flexibility.
Website: https://chartswatcher.com
ChartsWatcher represents a significant step forward in market scanning technology, offering a potent combination of professional-grade tools, user-centric design, and affordability. Its ability to function as a highly effective stock RSI screener, combined with its broader suite of features, makes it a valuable asset for any serious trader aiming to navigate the complexities of the stock market.
2. TradingView Stock Screener
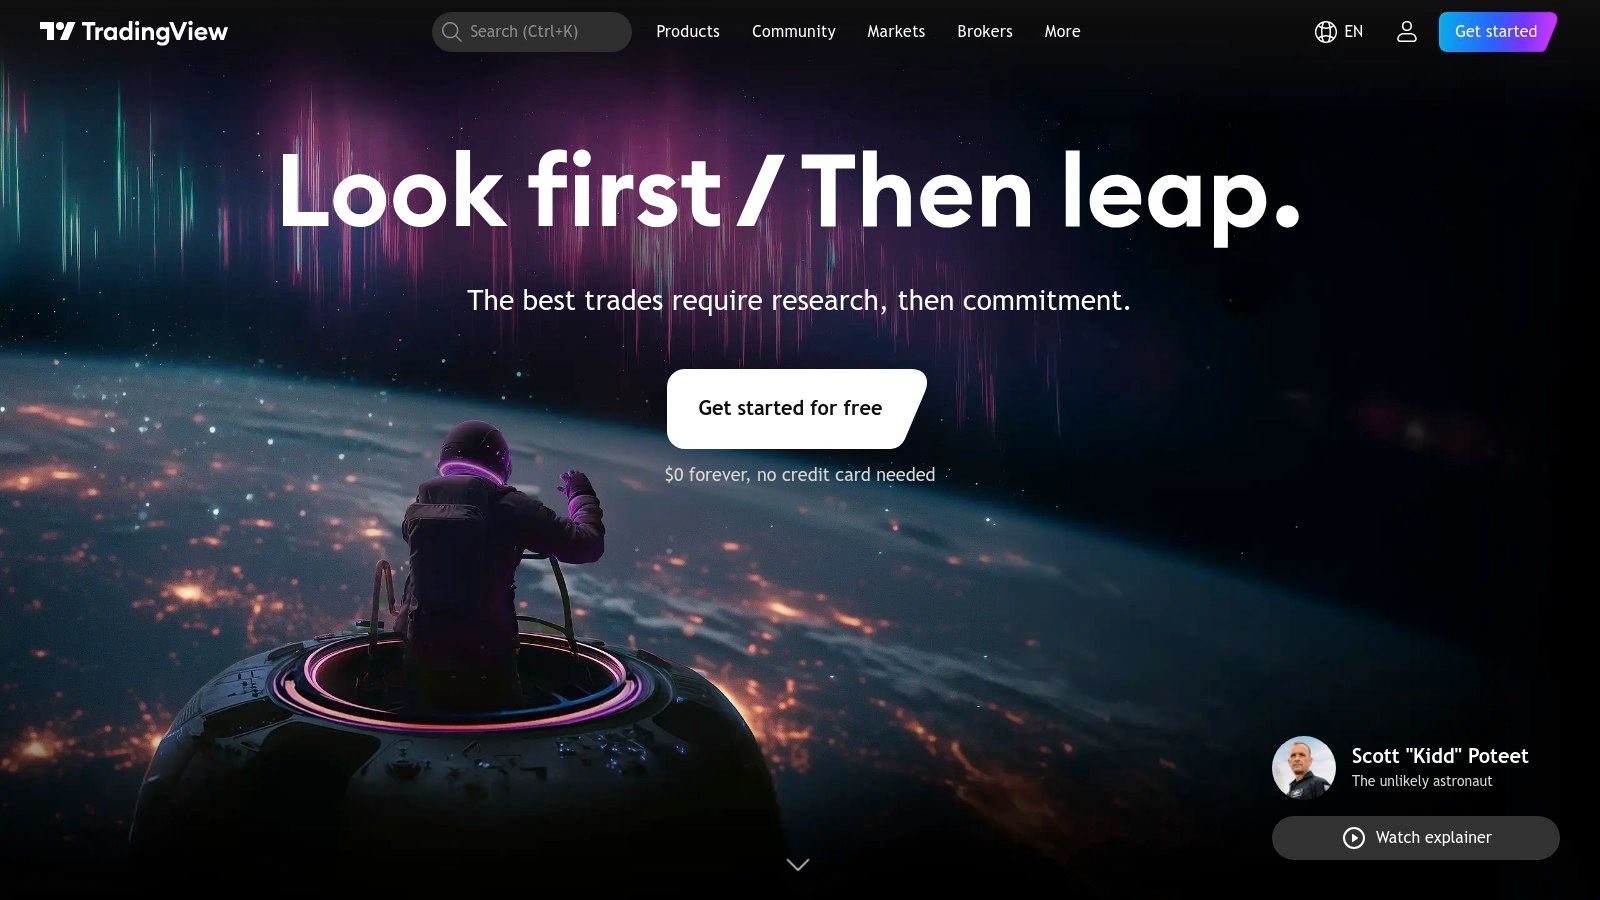
TradingView is a popular platform among professional traders, stock market analysts, and independent investors, and its built-in stock screener is a key reason why. This robust tool provides comprehensive stock RSI screening capabilities, utilizing real-time data and seamlessly integrating with TradingView’s renowned interactive charting platform. Whether you're a seasoned trader looking for complex RSI setups or a beginner just starting to explore technical analysis, TradingView’s stock RSI screener offers a powerful suite of features to help identify potential trading opportunities. The platform offers both free and premium tiers, catering to different needs and budgets. This flexibility makes it a valuable tool for anyone looking to incorporate Relative Strength Index (RSI) analysis into their investment strategy. It allows users to scan for stocks based on specific RSI values across a wide range of timeframes, from 1 minute to 1 month, and combine those filters with hundreds of other technical indicators. This ability to fine-tune your search criteria makes it an extremely versatile tool for identifying stocks that meet your precise requirements.
One of the standout features of the TradingView stock RSI screener is its ability to scan across multiple timeframes. This is crucial for traders who use multiple timeframes in their analysis, as it allows them to identify stocks that show RSI signals across different charts. For example, a swing trader might look for stocks that are oversold on the weekly chart but showing bullish RSI divergence on the daily chart. Day traders can use shorter timeframes (1m, 5m, 15m, etc.) to find stocks exhibiting overbought or oversold conditions for quick scalping opportunities. This flexibility in timeframe analysis makes the TradingView screener suitable for a variety of trading styles. You can further refine your search by customizing the overbought and oversold thresholds. Rather than sticking to the traditional 30 and 70 values, you can adjust them to suit your specific strategy and risk tolerance.
The real power of the TradingView stock RSI screener lies in its ability to combine RSI filters with over 100 other technical indicators. This allows you to create highly specific scans to pinpoint stocks that meet your exact criteria. For instance, you could screen for stocks with an RSI below 30 (oversold) that are also showing a bullish MACD crossover. This combination of indicators helps confirm the potential for a price reversal and reduces false signals. The platform's interactive charts, directly integrated with the screener, allow you to visualize the RSI indicator alongside price action and other technical indicators. This integration provides a comprehensive view of the stock's technical picture and aids in making informed trading decisions. The platform also supports market scanning across global exchanges, allowing international investors to screen for opportunities in different markets.
For those new to stock screening or TradingView itself, navigating the sheer number of features can feel overwhelming initially. Learn more about TradingView Stock Screener for helpful tips and guides. While the free version of TradingView offers significant functionality, unlocking the full potential of the screener, including intraday charting and more extensive historical data, requires a paid subscription. Premium plans range from $14.95 to $59.95 per month, depending on the chosen tier. This cost can be a barrier for some users, especially those just starting. Furthermore, while the platform does offer some backtesting capabilities, these are limited in the free plan. More advanced backtesting features are reserved for premium subscribers.
Despite these limitations, TradingView's user-friendly interface, powerful customization options, excellent charting capabilities, large and active community, and the availability of a mobile app for on-the-go screening, make it a top choice for stock RSI screening. Whether you're a day trader, swing trader, or long-term investor, the TradingView stock RSI screener provides the tools and data you need to effectively analyze the market and identify potential trading opportunities based on RSI and a host of other technical indicators. Its versatility and comprehensive features justify its place as a leading stock screener for both individual investors and financial institutions.
3. Finviz Stock Screener
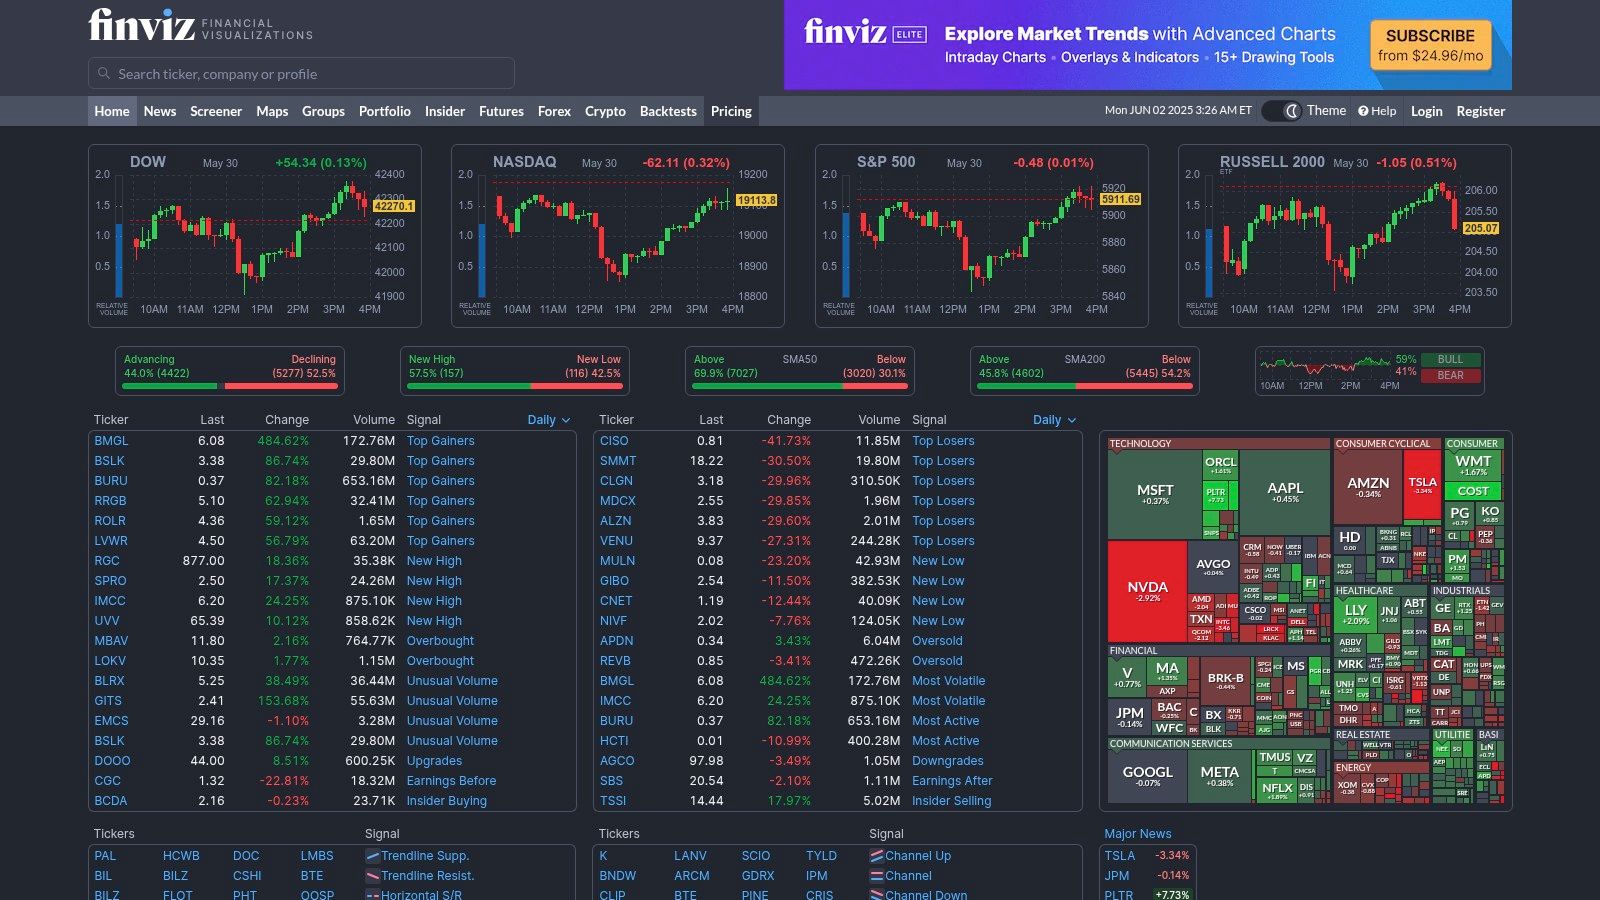
Finviz (Financial Visualizations), a name synonymous with efficient stock screening, earns its spot on this list as a powerful and versatile tool for traders seeking to leverage the Relative Strength Index (RSI). Whether you're a seasoned professional or a novice investor, Finviz provides a robust platform for identifying potential trading opportunities based on RSI values, alongside a wealth of other technical and fundamental indicators. This makes it an invaluable asset for anyone incorporating RSI into their stock analysis. Specifically, if you’re looking for a stock RSI screener, Finviz should be a top contender for its ease of use and comprehensive filtering options.
One of Finviz’s core strengths lies in its user-friendly interface. Even with its extensive feature set, the platform remains remarkably intuitive. Locating and applying the RSI filter is straightforward, allowing you to quickly define your desired RSI range. For instance, if you're hunting for oversold stocks, you can set the RSI filter to display stocks with an RSI below 30. Conversely, if you’re interested in overbought conditions, you could set the range above 70. This flexibility allows traders to tailor their searches to specific RSI strategies, whether they are looking for mean reversion trades or momentum plays. Beyond the basic RSI filter, Finviz allows users to combine RSI criteria with a multitude of other technical and fundamental filters. You could, for example, search for stocks with an RSI below 30 that also have a positive earnings per share growth rate, effectively integrating fundamental analysis into your RSI-driven search.
The platform’s visualization tools further enhance its value. Finviz offers interactive heat maps that provide a visual representation of market performance across different sectors and industries. This broad market overview can be particularly insightful when used in conjunction with RSI screening, helping you identify sectors exhibiting relative strength or weakness within specific RSI ranges. This feature is a boon for traders looking to identify sector-specific opportunities based on combined RSI and market trend analysis.
Finviz offers both free and Elite subscriptions. While the free version provides access to core screening functionalities, including the RSI filter, it does come with delayed data (15-20 minutes). For professional traders who require real-time data, the Elite version is a worthwhile investment at $24.96 per month. This subscription also unlocks pre-market data, advanced charting features, and export capabilities, allowing for more in-depth analysis and efficient record-keeping.
While Finviz excels in many areas, it’s essential to be aware of its limitations. Currently, Finviz focuses primarily on US markets, so international traders may find its scope restrictive. Additionally, while charting functionalities are available, they are less comprehensive than those offered by dedicated charting platforms. Finally, the lack of a mobile app might be a drawback for traders who prefer on-the-go access.
Compared to other stock screeners, Finviz strikes a good balance between functionality and affordability. Platforms like TradingView offer more advanced charting but often come with a higher price tag. Free screeners may lack the depth of filtering options and data quality that Finviz provides.
To get started with using Finviz as a stock RSI screener, simply navigate to the screener section on the website (https://finviz.com). From the descriptive filter dropdown menu, locate the "Technical" section. Within this section, you'll find the RSI indicator. Select your desired RSI range, and combine it with other filters as needed. Clicking "Filter" will generate a list of stocks meeting your specified criteria.
In summary, Finviz is a highly effective stock RSI screener, particularly suited for traders focused on the US market. Its intuitive interface, comprehensive filtering options, and integration of fundamental data make it a valuable tool for both novice and experienced traders. While limitations exist, the combination of features and affordability makes Finviz a strong contender in the realm of stock screening tools.
4. StockFetcher
StockFetcher stands out as a powerful stock RSI screener meticulously designed for technical traders who prioritize the Relative Strength Index (RSI) as a key indicator in their analysis. Unlike more general stock screeners, StockFetcher specializes in technical analysis, offering a unique plain-English query language that makes constructing complex RSI-based screening strategies remarkably intuitive. This platform empowers users to move beyond basic RSI thresholds and delve into sophisticated pattern recognition, divergence detection, and multi-timeframe analysis. It's a tool built for those who want to harness the full potential of the RSI indicator.
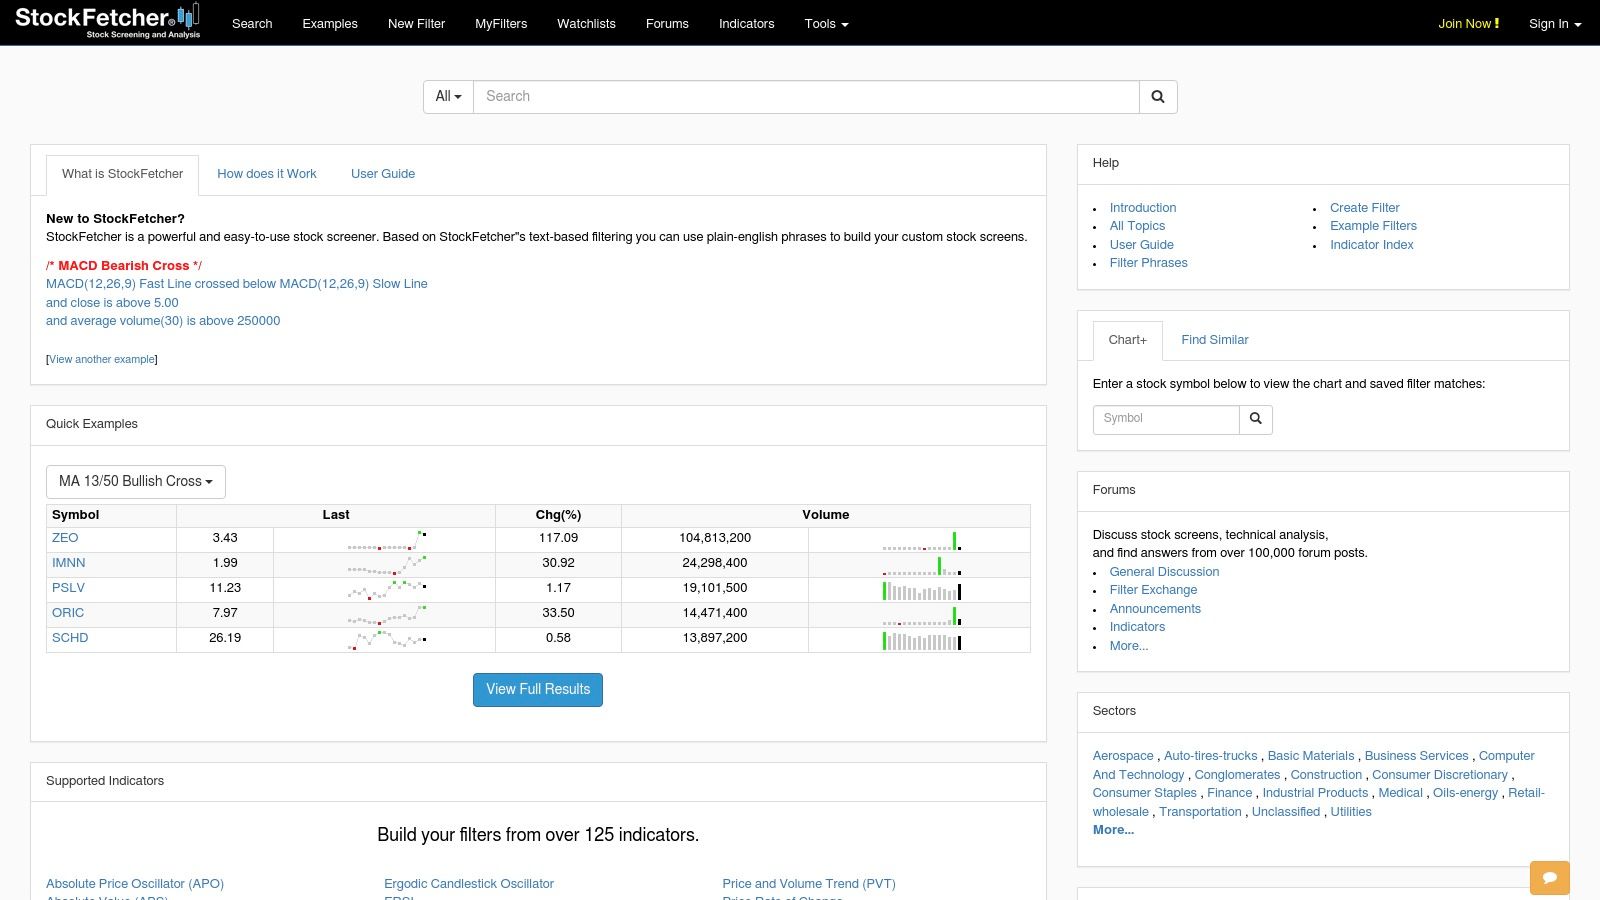
For professional traders, StockFetcher provides the flexibility to design highly specific stock RSI screener queries. For example, imagine searching for stocks exhibiting bullish RSI divergence on the daily chart, coupled with a recent crossover above 30 on the hourly chart. With StockFetcher's natural language interface, constructing this complex query becomes straightforward. You could type something like "Daily RSI Divergence Bullish AND Hourly RSI crosses above 30," eliminating the need for complicated coding or syntax. This allows traders to focus on the strategy itself, rather than wrestling with the tool. This functionality becomes invaluable when backtesting intricate RSI strategies across different market conditions and timeframes, providing crucial insights for optimizing trading approaches.
StockFetcher goes beyond simple screening by offering advanced RSI pattern recognition. It can automatically identify classic RSI patterns like the “W” bottom or “M” top, alerting traders to potential reversal opportunities. Furthermore, its divergence detection capabilities highlight instances where price action diverges from RSI movement, a powerful signal often foreshadowing trend changes. This functionality is particularly beneficial for day traders seeking quick identification of short-term trading setups based on RSI dynamics.
For financial institutions and stock market analysts, StockFetcher's historical backtesting features are essential. They allow for rigorous testing of RSI-based strategies against years of market data, helping to determine the efficacy and risk profile of different approaches. This data-driven approach to strategy development is crucial for managing risk and maximizing returns in any market environment. StockFetcher empowers analysts to fine-tune their RSI parameters and identify optimal entry and exit points based on historical performance.
Independent investors can also benefit significantly from StockFetcher's capabilities. While the platform is powerful enough for professional use, its plain-English query system makes it accessible even to those without extensive coding experience. Investors can use pre-built RSI templates or create their own custom screens to find stocks meeting specific RSI criteria. The email alert functionality ensures that investors are promptly notified when a stock triggers their predefined RSI thresholds, eliminating the need for constant market monitoring.
Stock trading educators can utilize StockFetcher as a powerful teaching tool, demonstrating practical applications of RSI analysis to their students. The visual representation of RSI patterns and divergences, coupled with the ability to backtest strategies, provides a valuable learning experience. Students can experiment with different RSI settings and observe the impact on historical performance, reinforcing their understanding of this crucial technical indicator.
While StockFetcher offers a compelling suite of tools, it's essential to be aware of its limitations. The platform's interface, though functional, has a dated design compared to more modern platforms. Furthermore, its focus on technical analysis means it lacks comprehensive fundamental data, which may be a drawback for investors who integrate fundamental analysis into their decision-making. The learning curve, while mitigated by the natural language interface, can still be steep for complete beginners. Finally, access to the full feature set requires a subscription of $8.95 per month.
Despite these limitations, StockFetcher's specialized focus on RSI, coupled with its powerful screening and backtesting capabilities, makes it a worthwhile investment for traders and analysts who prioritize the RSI indicator in their technical analysis. For those seeking a dedicated stock RSI screener that goes beyond basic functionality, StockFetcher provides the depth and flexibility needed to uncover valuable trading opportunities. You can explore the platform further by visiting their website at https://stockfetcher.com.
5. TC2000 Stock Screener
For serious traders seeking a robust and highly customizable stock RSI screener, TC2000 by Worden stands out as a professional-grade platform. It goes beyond basic RSI screening, offering institutional-quality data, advanced analytical tools, and real-time updates that empower users to make informed trading decisions based on sophisticated RSI strategies. This platform caters to those who demand precision, speed, and in-depth analysis in their stock market endeavors. Its comprehensive features and data quality make it a compelling choice for discerning traders and investment professionals who prioritize efficient and effective RSI-based stock screening.
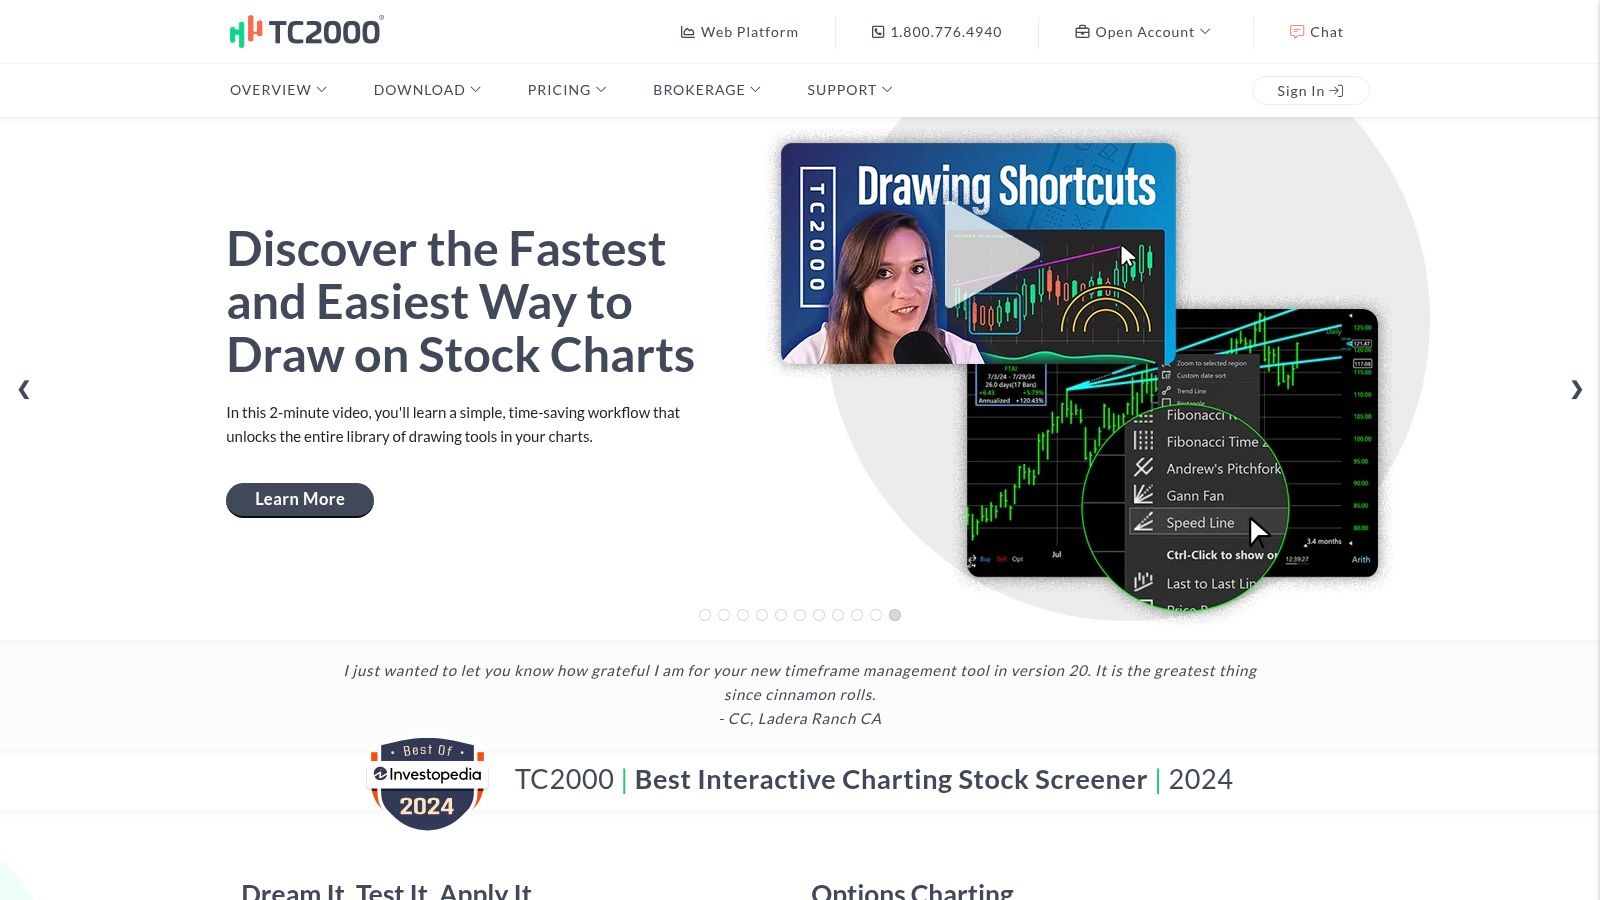
TC2000’s key strength lies in its ability to provide real-time RSI screening with sub-second updates. In the fast-paced world of stock trading, timely data is crucial. This rapid update speed allows traders to identify potential trading opportunities based on RSI fluctuations as they occur, maximizing their ability to react to market movements. Furthermore, TC2000 doesn't stop at basic RSI calculations. It facilitates advanced RSI divergence and pattern scanning, enabling users to identify hidden bullish or bearish signals that might be missed with simpler tools. For traders who develop their own RSI-based strategies, the platform allows for custom RSI indicator creation and modification. This flexibility empowers users to tailor their RSI analysis to their specific trading styles and preferences.
A standout feature of TC2000 is its integration with professional trading platforms. This seamless integration simplifies order execution and streamlines the trading workflow, allowing users to move from analysis to action quickly and efficiently. The platform also provides comprehensive historical RSI data analysis, enabling backtesting and strategy optimization. By studying historical RSI performance, traders can refine their approaches and improve the effectiveness of their RSI-based trading strategies. For a deeper dive into RSI strategies, you can learn more about TC2000 Stock Screener and RSI applications in general.
TC2000's commitment to supporting its users is evident in its excellent customer support and training resources. They offer extensive documentation, tutorials, and webinars to help users navigate the platform's features and maximize their understanding of RSI analysis. This commitment to user education is particularly valuable given the platform's complexity. TC2000 also boasts powerful backtesting and strategy development tools, enabling users to rigorously test their RSI strategies against historical data. This functionality allows traders to fine-tune their approaches and optimize their parameters for maximum effectiveness.
While TC2000 offers significant advantages for the professional trader, it also has some drawbacks to consider. The platform's subscription tiers are relatively expensive, ranging from $29.95 to $149.95 per month. This pricing structure may be prohibitive for casual traders or those with limited budgets. Additionally, the complex interface, while powerful, can overwhelm casual traders who are new to technical analysis or the TC2000 platform. Mastering the platform’s full range of features requires a significant time investment. Finally, while offering extensive coverage of US markets, TC2000 has limited international market coverage. This limitation can be a drawback for traders interested in global markets.
In summary, the TC2000 stock RSI screener earns its place on this list due to its professional-grade data quality, advanced analytical tools, and real-time updates. Its focus on customization, integration with trading platforms, and comprehensive historical data analysis makes it a compelling choice for serious traders. However, potential users should be mindful of the cost and the time investment required to master its functionalities. If you’re a professional trader, stock market analyst, or part of a financial institution looking for a robust and customizable RSI screening tool, TC2000 deserves serious consideration. It is also a valuable asset for independent investors, stock trading educators, and those interested in using stock scanners and screeners for day trading. For those seeking a sophisticated RSI solution, TC2000 offers a powerful set of features to enhance trading strategies and potentially improve investment outcomes. You can explore the platform and its features further on their website: https://www.tc2000.com.
6. Yahoo Finance Stock Screener
For those seeking a free and readily accessible entry point into the world of stock RSI screening, the Yahoo Finance Stock Screener is a worthy contender. It offers a balanced combination of simplicity and functionality, making it particularly attractive for retail investors and those new to technical analysis. While it may not possess the depth of premium platforms, its integration with the broader Yahoo Finance ecosystem provides a convenient hub for research and analysis. This screener allows you to filter stocks based on RSI values, helping you identify potentially overbought or oversold conditions in the market. This tool empowers you to incorporate RSI into your investment strategy without the financial commitment required by more advanced platforms. It's a valuable tool for quickly scanning the market and narrowing down potential investment opportunities based on RSI indicators.
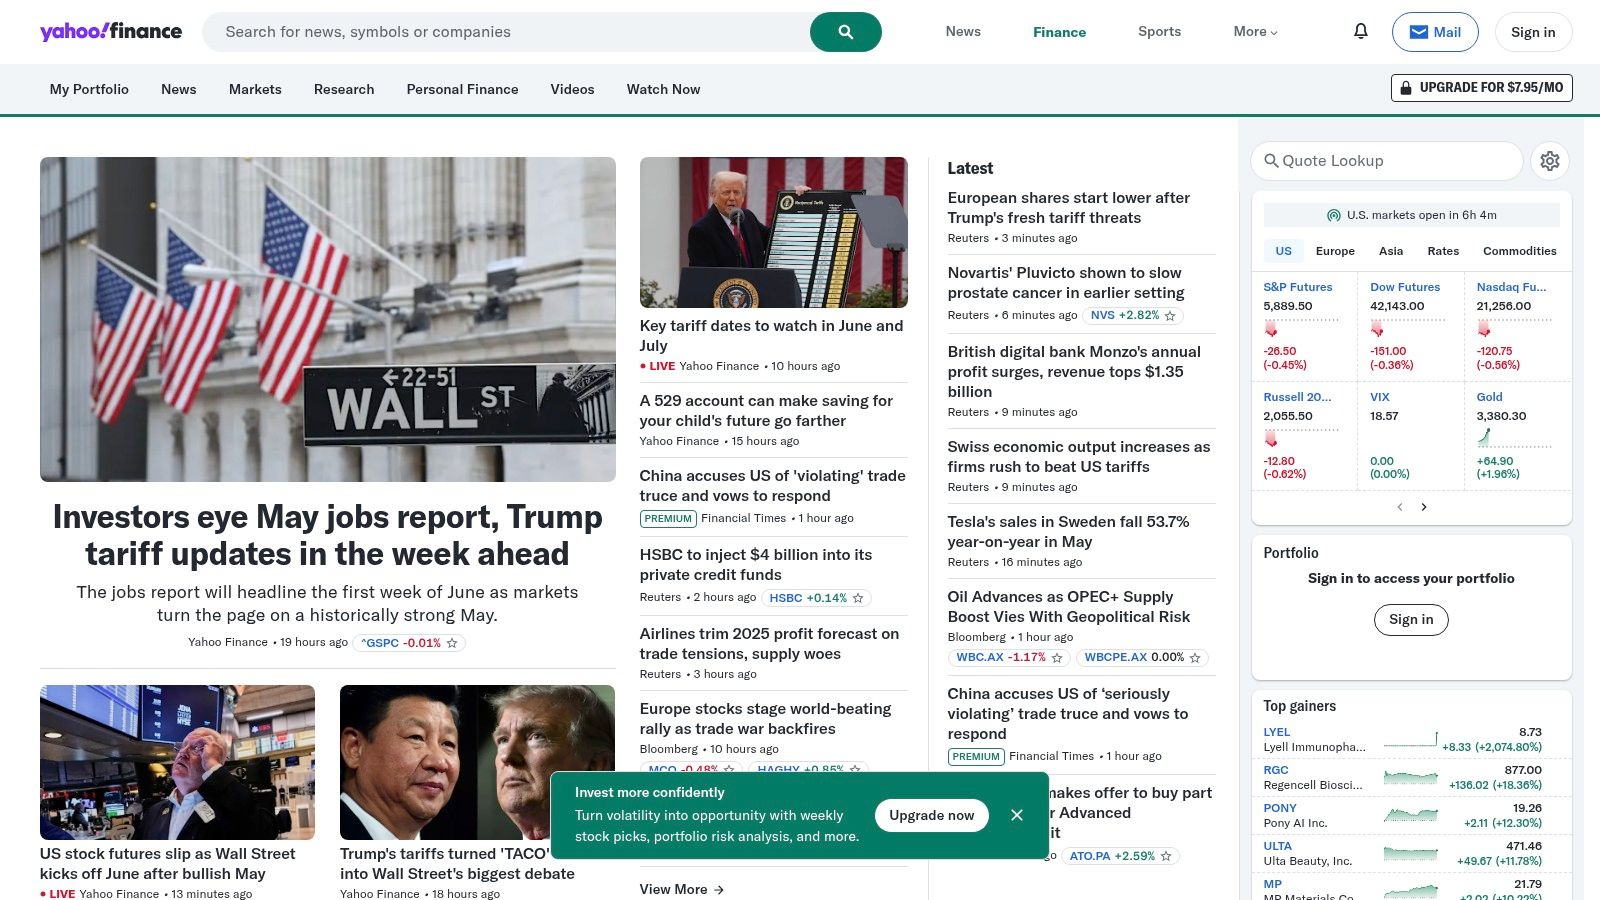
The key advantage of the Yahoo Finance Stock Screener is its seamless integration with the wealth of financial data available on the Yahoo Finance platform. Once you've identified potential investments through the RSI screener, you can delve deeper into individual stock performance, news, analyst ratings, and financial statements, all within the same ecosystem. This integration streamlines the research process, allowing you to quickly move from initial screening to in-depth analysis. For example, if your screen reveals a company with an attractive RSI, you can immediately access its historical performance data and recent news headlines on Yahoo Finance to gain a more comprehensive understanding of its potential.
This tool’s strength lies in its simplicity and accessibility. The interface is clean and straightforward, making it easy to navigate and customize your screening criteria. The screener requires no registration for basic RSI filtering, allowing users to quickly experiment with different RSI thresholds and observe the results. This user-friendly design is particularly beneficial for beginners who are still learning the nuances of RSI and technical analysis. Experienced traders will also appreciate the quick and easy access to RSI data, even if they utilize other platforms for more in-depth analysis.
The Yahoo Finance Stock Screener shines in its accessibility. It’s completely free to use, eliminating any financial barrier to entry for those exploring RSI-based stock screening. This cost-effectiveness is a major advantage for individual investors and those working with limited budgets. It allows users to gain practical experience with RSI analysis without the recurring costs associated with many other platforms.
While the Yahoo Finance Stock Screener offers a convenient and free way to filter stocks based on RSI, it's crucial to acknowledge its limitations. The platform offers basic RSI threshold filtering, but lacks the customization options found in more specialized technical analysis tools. You can set the desired RSI range, but you won't have access to more advanced features like customizable lookback periods or the ability to combine RSI with other technical indicators. This limits the complexity of the strategies you can implement using this screener. For example, while you can screen for stocks with an RSI below 30 (often considered oversold), you can’t easily combine this with other indicators like moving averages or volume filters. Compared to platforms like TradingView or Finviz, which cater to more experienced traders, the Yahoo Finance offering has fewer screening criteria and less advanced charting capabilities.
Furthermore, its technical analysis features are basic. While sufficient for initial screening, they are not designed for in-depth charting or backtesting. Traders who rely on advanced charting tools, custom indicators, or historical simulations will need to supplement the Yahoo Finance Stock Screener with other platforms.
In conclusion, the Yahoo Finance Stock Screener earns its place on this list as a valuable free resource for integrating RSI analysis into your investment process. It’s especially suited for beginners and retail investors who are looking for a user-friendly and accessible platform to begin exploring the power of RSI. While seasoned traders may find its features limited, the free access, clean interface, and integration with Yahoo Finance’s extensive financial data ecosystem make it a worthwhile tool for quick RSI checks and preliminary stock screening. Its simplicity and ease of use make it an excellent starting point for anyone interested in incorporating RSI into their investment strategy.
7. Zacks Stock Screener
For investors seeking a blend of technical and fundamental analysis, the Zacks Stock Screener offers a powerful platform that integrates Relative Strength Index (RSI) screening with their proprietary research and earnings data. This makes it a valuable tool for those who want to incorporate both technical indicators and fundamental insights into their investment decisions. While other screeners might focus solely on technical indicators, Zacks goes a step further by combining RSI with fundamental factors like earnings estimate revisions and their renowned Zacks Rank system. This holistic approach can help identify stocks that exhibit both technical momentum and strong underlying fundamentals. This is particularly beneficial for investors who believe that combining these two perspectives leads to a more robust investment strategy.
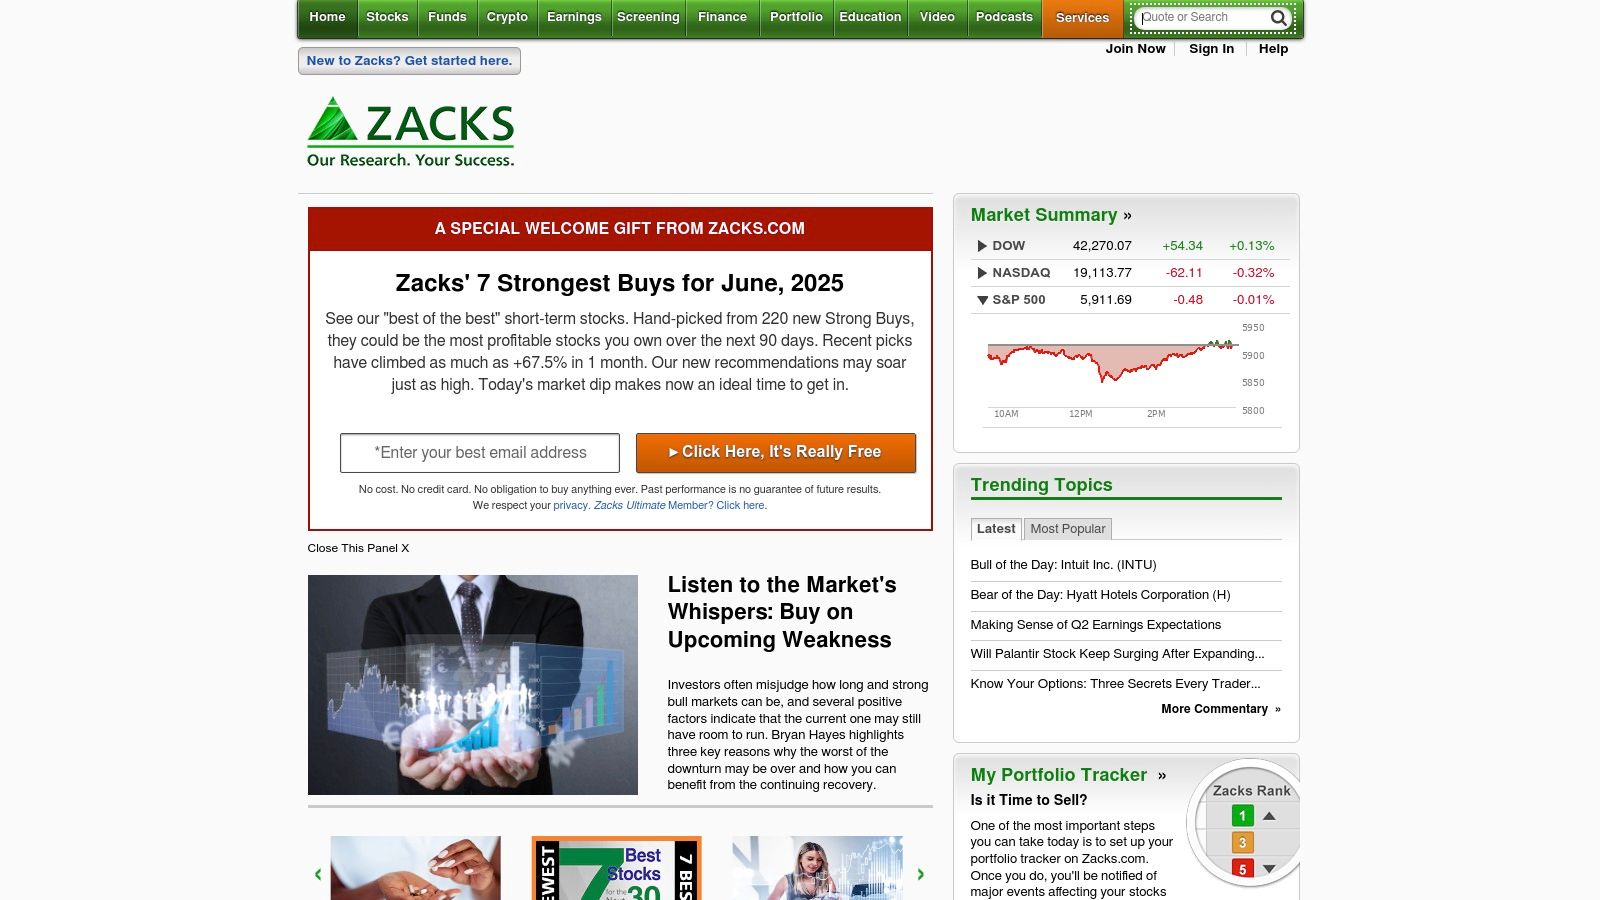
The Zacks Stock Screener allows users to filter stocks based on specific RSI ranges, enabling them to identify overbought or oversold conditions. For example, a trader might search for stocks with an RSI below 30, indicating potentially oversold conditions and a possible buying opportunity. Conversely, they could screen for stocks with an RSI above 70, suggesting overbought conditions and a potential selling signal. The platform further enhances the RSI screening by allowing users to combine it with the Zacks Rank, a proprietary rating system that grades stocks from 1 (Strong Buy) to 5 (Strong Sell) based on the consensus of analyst earnings estimate revisions. This allows for a more nuanced analysis, potentially identifying stocks with strong upside potential that are also exhibiting favorable RSI trends.
One of Zacks' key differentiators is the integration of technical RSI with fundamental data. Users can compare a stock's RSI against its industry and sector averages, offering a contextualized view of its relative strength. This comparative analysis can provide valuable insights into whether a stock's momentum is outpacing or lagging its peers. Furthermore, Zacks provides professional research reports that incorporate RSI analysis, giving users access to expert commentary and insights on potential investment opportunities. These reports often delve deeper into the factors influencing a stock's RSI, providing a more comprehensive understanding of its price movements.
The platform also offers practical features like email alerts for RSI-based screening results. This allows users to stay informed about changes in their chosen stocks’ RSI without constantly monitoring the platform. They can customize the alerts based on their specific criteria, such as when a stock’s RSI crosses a predefined threshold. This automation can save significant time and ensures that traders don't miss crucial trading signals.
While the Zacks Stock Screener offers powerful features, it's essential to be aware of its limitations. The platform's strength lies in its combined technical and fundamental approach. However, for traders solely focused on technical analysis, the platform might feel less flexible. The customization options for RSI are somewhat limited compared to dedicated technical analysis platforms. For instance, while you can screen based on standard RSI periods (like 14 days), adjusting the calculation methodology or adding custom indicators might not be possible.
The platform’s interface, while comprehensive, can also feel cluttered and complex, particularly for new users. Navigating the various features and data points can require some time and effort to master. Furthermore, access to the full suite of features requires a premium subscription, which can be expensive at $249/year. This cost might be prohibitive for some individual investors. However, for professional traders, financial institutions, and serious investors, the combination of professional research, fundamental data integration, and RSI screening might justify the price.
In summary, the Zacks Stock Screener deserves its place on this list because of its unique ability to integrate RSI analysis with a robust fundamental research platform. It's particularly well-suited for investors who value a combined approach, leveraging both technical and fundamental indicators for informed decision-making. While the cost and complexity may be drawbacks for some, the platform's powerful features and professional research quality make it a valuable tool for serious investors. The Zacks Stock Screener can be accessed at https://www.zacks.com.
Stock RSI Screener Tools Comparison
| Product | Core Features / Capabilities | User Experience & Quality ★ | Value & Pricing 💰 | Target Audience 👥 | Unique Selling Points ✨ |
|---|---|---|---|---|---|
| 🏆 ChartsWatcher | Custom dashboards (8 window types), backtesting (Pro), real-time alerts & filters | ★★★★☆ Highly customizable, efficient | Free basic; Pro $74.99/mo (annual) | Pro traders, analysts, investors | Multi-screen setups, import/export configs |
| TradingView Stock Screener | Real-time RSI screening, 100+ technical indicators | ★★★★☆ User-friendly, strong charting | Free & $14.95–$59.95/mo (premium) | Retail & pro traders | Interactive RSI charts, large community |
| Finviz Stock Screener | RSI & fundamental filters, heat maps, export results | ★★★☆☆ Clean UI, strong fundamentals | Free & $24.96/mo Elite | US market traders, beginners | Visual heat maps, affordable premium tier |
| StockFetcher | Natural language RSI queries, advanced backtesting | ★★★★☆ Powerful but dated UI | $8.95/mo Subscription | Advanced technical traders | Plain-English queries, complex RSI screens |
| TC2000 Stock Screener | Sub-second RSI updates, professional-grade data | ★★★★★ High quality, customizable | $29.95–$149.95/mo | Institutional & serious traders | Real-time data, professional integrations |
| Yahoo Finance Stock Screener | Basic RSI filtering, portfolio tracking | ★★★☆☆ Simple, clean interface | Free | Retail investors, beginners | Free with financial news integration |
| Zacks Stock Screener | RSI + proprietary fundamental research & earnings | ★★★☆☆ Research quality, somewhat complex | $249/year | Investors seeking research depth | Combines RSI with earnings & sector analysis |
Picking the Perfect Stock RSI Screener
Finding the ideal stock RSI screener from the array of options available, including platforms like ChartsWatcher, TradingView, Finviz, StockFetcher, TC2000, Yahoo Finance, and Zacks, requires careful consideration. Throughout this article, we've explored the strengths and weaknesses of several leading platforms, highlighting their unique features and capabilities. Remember, the best stock RSI screener for you depends on individual factors such as your trading style (day trading, swing trading, etc.), experience level, and specific analytical needs. Prioritize features that align with your investment strategy, whether it's real-time data, customizable alerts, backtesting capabilities, or seamless integration with your existing trading platforms.
For those seeking a comprehensive understanding of market dynamics, exploring technical indicators like the RSI is crucial. To enhance your analysis further, consider delving into broader analytical methods. For example, learning about various time series analysis techniques can provide valuable insights into market trends and potential trading opportunities. This knowledge, coupled with the right stock RSI screener, empowers you to make more informed decisions.
Ultimately, a powerful stock RSI screener isn't just a tool; it's a strategic asset that can significantly enhance your trading performance. By carefully evaluating your needs and selecting the platform that best fits your criteria, you're taking a proactive step towards achieving your financial goals. Streamline your stock screening process and uncover potential opportunities with ChartsWatcher, a platform known for its robust RSI screening capabilities. Visit ChartsWatcher today and experience the power of a sophisticated stock RSI screener.
