Mastering Supports and Resistance A Trader's Guide
In the world of trading, some concepts are so fundamental they're like the laws of gravity. Support and resistance are exactly that—the invisible battle lines where the market’s future is constantly being decided.
You can think of support as a price floor where buyers consistently show up, putting a stop to any further decline. Resistance, on the other hand, is the price ceiling where sellers tend to emerge in force, halting a rally in its tracks. Getting a grip on these key levels is your first real step toward reading market psychology and spotting potential turning points before they happen.
Decoding the Market's Invisible Battle Lines
Imagine a game of tennis, but the ball is the market's price. The ground is your support level. Every time the price drops and hits it, a wave of buying pressure acts like a racket, bouncing it right back up.
Conversely, think of an invisible ceiling hanging just overhead—that's resistance. When the price rallies up to that point, selling pressure swats it back down. These aren't just random lines on a chart; they are intense decision-making zones where fortunes are made and lost.
These levels aren't magic. They're forged by the collective psychology of every single person in the market. They represent historical price points where a huge number of traders decided to either buy or sell, creating a kind of "memory" in the market. When the price revisits one of these zones, traders often react in the same way, which only reinforces the level's strength.
The Foundation of Technical Analysis
For any serious trader, mastering support and resistance is simply non-negotiable. It’s the framework that helps you make sense of chaotic price action and build strategies that actually work.
By identifying these zones, you can:
- Anticipate Market Reactions: Pinpoint areas where the price is likely to stall, reverse, or break out with serious momentum.
- Improve Entry and Exit Points: Time your trades more effectively by aiming to buy near support and sell near resistance.
- Manage Risk Strategically: Place your stop-loss orders just beyond these levels. This protects your capital if a level breaks and the market moves against you.
Think of support and resistance as the grammar of the market's language. Without understanding these basic rules, you're just staring at random letters and symbols, unable to read the story the price is trying to tell you.
At its core, all of this comes down to the timeless struggle between supply (sellers) and demand (buyers). A support zone tells you that demand is overpowering supply, preventing prices from falling further. A resistance zone signals the opposite: supply is overwhelming demand, putting a cap on any more price increases.
As we dig deeper, you’ll learn exactly how to spot these zones, figure out which ones are truly significant, and use them to gain a clear edge in your trading.
How to Identify Different Types of Market Levels
When most traders first hear about support and resistance, they picture simple horizontal lines on a chart. But in reality, these critical market levels are much more dynamic than that. They show up in several different forms, and learning to spot each one is key to adapting your strategy as the market ebbs and flows.
Think of it like this: if you only know how to spot horizontal levels, you're missing a huge part of the story the market is telling you.
Horizontal Levels: The Classic Price Floor and Ceiling
The most common and easiest to spot are horizontal support and resistance levels. These are the classic price barriers formed by connecting previous peaks (highs) and troughs (lows). When a price tries and fails to push above a certain point multiple times, it carves out a horizontal resistance line.
On the flip side, when the price repeatedly drops to a specific low and buyers consistently step in, it establishes a solid horizontal support level. These static lines are powerful because they represent price points where a large number of traders previously made a collective decision to either buy or sell. They become psychological battlegrounds.
Trendlines: Support and Resistance in Motion
Markets don't just move sideways; they trend. This is where trendlines become an essential tool. Unlike their horizontal cousins, trendlines are dynamic, moving along with the price to map out the market's upward or downward momentum.
In an uptrend, you draw a trendline by connecting a series of higher lows. This creates a rising support level. In a downtrend, you connect a series of lower highs, which forms a declining resistance level.
- Uptrend Support: As long as the price bounces along this rising line, the bullish trend is considered healthy. A break below it is often the first warning sign of a potential reversal.
- Downtrend Resistance: If the price keeps hitting this falling line and turning back down, the bearish trend remains in control. A clean break above it can signal that buyers are finally wrestling back control.
This constant tug-of-war between buyers and sellers is what creates these crucial zones.
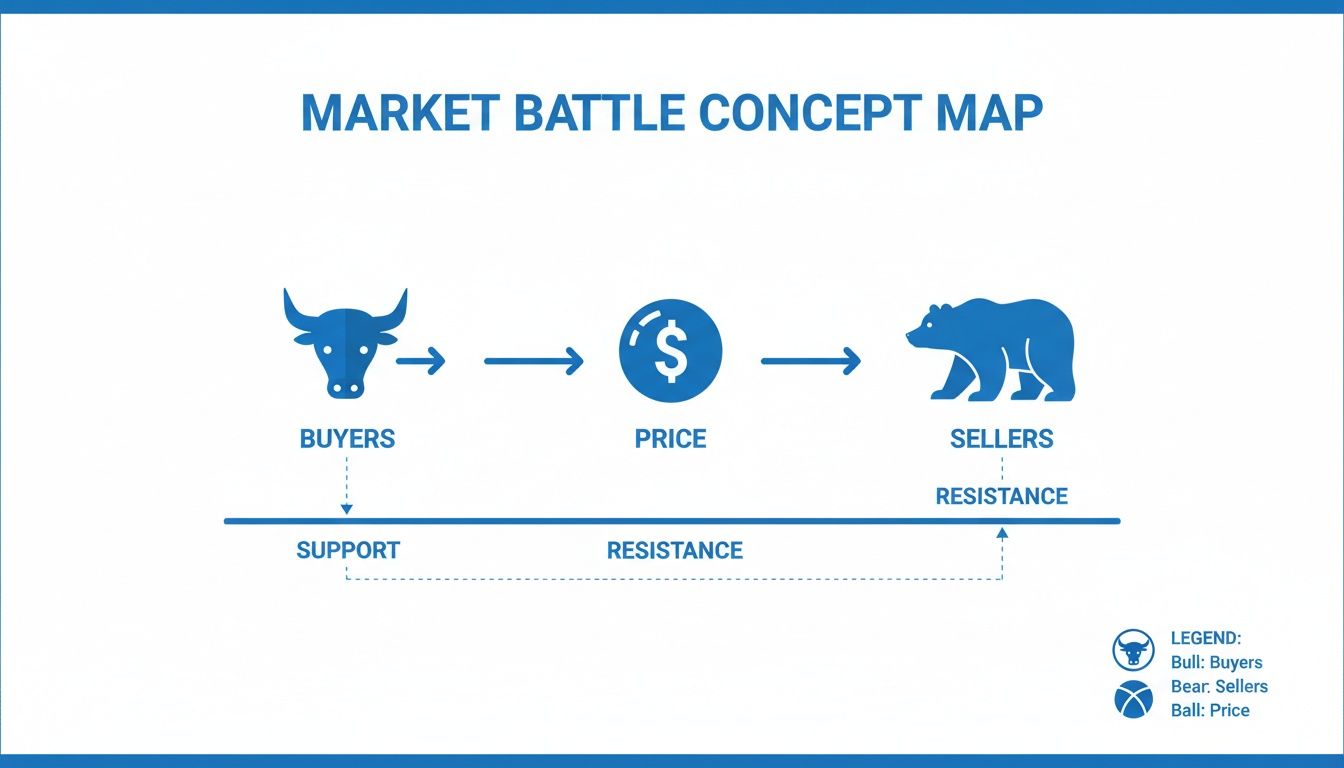
You can see how support acts as a floor held up by buyers (bulls), while resistance is a ceiling defended by sellers (bears). These levels define the market's trading range.
A Quick Guide to Support and Resistance Types
Understanding the key differences between static and dynamic levels helps traders adapt to various market conditions. This table breaks down the main types at a glance.
| Level Type | How It's Formed | Best For Identifying | Key Characteristic |
|---|---|---|---|
| Horizontal | Connecting historical price highs or lows at the same level. | Clear price ceilings and floors in ranging markets. | Static; the price level does not change over time. |
| Trendlines | Connecting a series of higher lows (uptrend) or lower highs (downtrend). | The strength and direction of a prevailing trend. | Dynamic; the price level changes with the trend's slope. |
| Moving Averages | A calculated indicator that smooths out price action over a period. | Areas of value in trending markets; often used by institutions. | Dynamic; automatically adjusts as new price data comes in. |
| Fibonacci | Mathematical ratios applied to a prior major price swing. | Potential reversal points after a strong move (pullbacks). | Predictive; projects future levels based on past price action. |
Mastering all four gives you a much more robust framework for analyzing any chart, in any market condition.
Moving Averages: The Self-Fulfilling Prophecy
Another incredibly powerful form of dynamic support and resistance comes from moving averages (MAs). You don't draw these lines yourself. Instead, they are indicators calculated by averaging price over a specific period, smoothing out the noise.
Big-money institutions pay very close attention to key MAs, which often makes them act like self-fulfilling prophecies.
The 50-day and 200-day moving averages are two of the most-watched indicators on Wall Street. When a stock's price drops toward its 200-day MA from above, it will often attract a wave of institutional buying, turning the average into a formidable support zone.
When the price is above a moving average, the MA often acts as support. When the price is below it, that same MA tends to become resistance. Because they adjust automatically to new price action, they are a cornerstone tool for anyone trying to trade with the trend.
Fibonacci Retracements: Anticipating the Bounce
Finally, we have a more predictive tool known as Fibonacci retracements. This technique uses specific ratios derived from the Fibonacci sequence to pinpoint potential reversal zones. The core idea is that after a big move up or down, the market will often pull back—or "retrace"—a predictable portion of that move before continuing in the original direction.
The key Fibonacci levels to watch are 38.2%, 50%, and 61.8%.
Traders draw these levels from the start to the end of a major price swing (e.g., from a swing low to a swing high). This projects potential areas where a pullback might run out of steam. For instance, after a huge rally, the price might fall back to the 50% retracement level, find a floor there, and then launch its next leg up.
If you want to get good at this, you can learn more about how to draw Fibonacci retracement levels and add this forward-looking technique to your analysis.
Each of these types—horizontal lines, trendlines, moving averages, and Fibonacci levels—gives you a unique lens for viewing the market's structure. The real magic happens when you find a spot on the chart where multiple types of support or resistance line up. That's a high-confidence zone where you can plan a trade with a much clearer edge.
Separating Strong Levels From Market Noise
Anyone can draw lines on a chart. The real skill is knowing which of those support and resistance levels actually matter. Many are just market noise—brief pauses with little real predictive power. To trade well, you have to learn to tune out the chatter and zero in on the zones where the real market battles are fought and won.
This validation process is what separates casual chart-watchers from professional traders. It's about having a framework to measure a level's strength. By focusing on three critical factors—the number of touches, the timeframe, and trading volume—you can build a much clearer, more reliable picture of the market's structure.
The Power of Multiple Touches
The simplest way to size up a level's importance is to count how many times the price has respected it in the past. Think of it like a boxer testing an opponent's guard. A single tap might just be a probe. But if that guard holds firm after three, four, or five solid hits, you know you're dealing with a serious defense.
It's the same in the market. A support or resistance level that has been tested and held multiple times is far more trustworthy. Each "touch" reinforces its significance, showing that a large group of traders remembers this price and is ready to act there again. A level with five historical touchpoints is exponentially stronger than one with only two.
Timeframe Is Everything
Not all levels are created equal, and their weight is heavily dictated by the timeframe they appear on. A support level on a 5-minute chart might matter to a scalper, but it’s practically invisible compared to a level that has held firm for months on a weekly chart.
A support or resistance level identified on a higher timeframe (like weekly or monthly charts) will almost always be more significant than one found on a lower timeframe (like hourly or 15-minute charts).
Why? Higher timeframes represent the collective decisions of more market participants over a longer period. A weekly support level reflects months of accumulated buying pressure, making it a formidable barrier. Always start your analysis on a higher timeframe to map out the major battlegrounds before you zoom in to find your entry.
Volume: The Ultimate Confirmation Signal
If price is what the market is doing, volume tells you the conviction behind it. It's the ultimate truth-teller. A price level tested on whisper-thin volume doesn't mean much. But a level that holds strong during a massive surge in trading activity? That's a clear sign of a significant power struggle.
Here's how to think about it:
- High volume at support: This suggests a wave of aggressive buyers stepped in, absorbing all the selling pressure to defend the price.
- High volume at resistance: This shows that sellers emerged in force, overwhelming the buyers and slamming the brakes on the rally.
That spike in activity confirms that big money is participating at that level, validating its importance. If you really want to dig into how transaction data can pinpoint key price zones, you can master the volume profile indicator for better trading in our detailed guide.
The Role Reversal Principle
One of the most powerful confirmation signals happens when a level breaks and then flips its role. This classic concept, known as role reversal, is a cornerstone of technical analysis and something you'll see play out time and time again.
When a strong support level is decisively broken, it often transforms into a new ceiling of resistance. The buyers who were previously defending that price are now underwater. If the price rallies back to their entry point, many will sell just to get out at breakeven, creating a new wall of supply.
Conversely, when resistance is smashed, it frequently becomes the market's new floor of support. This dynamic gives you clear confirmation that the market's psychology has shifted, offering a high-probability area to plan your next move.
Practical Trading Strategies for Key Levels
Spotting strong support and resistance levels is a great start, but it’s only half the battle. The real magic happens when you turn that analysis into a profitable trade. Once you’ve mapped out these key price zones, you can start looking for high-probability setups. This is where theory hits the pavement.
Two core strategies are the bread and butter of trading these levels: range trading and breakout trading. Each one shines in different market conditions, and getting a handle on both gives you a versatile toolkit for almost any scenario.
Let's break down how each approach works, with a clear blueprint for entries, risk management, and taking profits.
The Bounce Strategy for Range Trading
Range trading—often just called "the bounce"—is your go-to strategy when the market is stuck moving sideways. The idea is simple but incredibly effective: you buy when the price falls to a solid support level and sell (or short) when it climbs to a tough resistance level.
Think of it like a game of Pong. You're betting the price will keep bouncing between the established floor and ceiling.
Here’s a step-by-step guide to playing the bounce:
- Identify the Range: Find a chart with a clear, well-tested support floor and resistance ceiling. The more times these levels have held, the stronger the range.
- Wait for the Test: Patience is everything. Don't jump in just because the price is getting close. Wait for it to actually touch the level and show you a reaction.
- Look for an Entry Trigger: At support, a bullish candlestick pattern like a hammer or a bullish engulfing bar is a great signal. It tells you buyers are stepping in, giving you the green light to go long.
- Set Your Stop-Loss: This is non-negotiable. Place your stop-loss just below the support level. This caps your risk if the level suddenly gives way.
- Define Your Profit Target: Your first target should be the resistance level at the top of the range. This setup usually offers a fantastic risk-to-reward ratio.
This method works because it plays on the market's tendency to revert to the mean within those established boundaries.
The Breakout Strategy for Trending Markets
While the bounce strategy is perfect for sideways action, the breakout strategy is designed to catch big moves when a new trend is about to start. This approach is all about capitalizing on momentum when the price finally punches through a key level.
A breakout is a clear sign that the balance of power between buyers and sellers has dramatically shifted.
A breakout from a long-term consolidation range often kicks off a powerful, sustained move. It’s like a dam breaking—the longer the pressure builds, the more explosive the release.
Here’s how to trade a breakout:
- Identify a Key Level: Pinpoint a major support or resistance level that has been holding the price back.
- Wait for a Decisive Break: Don’t get faked out! You need to see a strong candle close clearly beyond the level. A tiny wick poking through doesn't count.
- Confirm with Volume: A true breakout should come with a big spike in trading volume. This shows there’s real conviction behind the move.
- Place Your Entry: You have two options. You can enter right after the breakout candle closes, or you can wait for a "retest," where the price pulls back to touch the broken level (which has now flipped its role) before taking off again.
- Set a Protective Stop-Loss: For a breakout above resistance, place your stop just below that now-broken level. For a breakdown below support, place it just above.
This strategy thrives on volatility and is one of the best ways to get in at the beginning of a fresh trend. It requires quick thinking but can lead to some massive wins.
Real-World Application in Major Indices
These strategies aren't just textbook theory; they play out every day in major markets. Take the S&P 500 during the volatile month of December 2025, for instance. The index ran into a wall of resistance in the 6877-6900 zone while finding critical support between 6766 and 6778, which held strong on recent tests.
Historical data shows that when key supports like this are breached, it has triggered 5-7% corrections 72% of the time during high-volatility periods over the last five years. These zones are battlegrounds where institutional orders pile up, often confirmed by volume spikes that were recently 45% above average at these levels. Traders who understood these dynamics were able to nail bounce strategies off support, often achieving risk-reward ratios of 1:3.
You can explore more on how these levels are shaping the markets in this detailed market technicals report from Chronicle Journal.
Common Trading Pitfalls You Need to Avoid
Knowing how to trade support and resistance is an incredibly powerful skill, but the road to getting there is littered with traps that can wipe out a trading account. Getting a handle on these common mistakes is the first step toward building the discipline you need to survive. Many traders learn these lessons the hard way, but you don't have to.
The most infamous trap is the false breakout. This is when the price punches through a key level, sucking in eager traders, only to violently reverse and snap back into its old range. This "fakeout" leaves breakout traders stuck on the wrong side of the market. These bull and bear traps are a constant threat to anyone who jumps the gun.
To sidestep this costly error, patience and confirmation are your best friends. Don't just enter the second a price touches or slightly crosses a level. Wait for a candle to close decisively beyond it. A strong, full-bodied candle closing above resistance or below support is much better proof that a real shift in momentum is underway.
Mistaking Noise for a Signal
One of the fastest ways to sabotage your own analysis is by cluttering your charts. New traders often fall into the trap of drawing dozens of lines, connecting every minor peak and trough until their screen looks like a tangled mess. This doesn't create clarity; it creates confusion.
When your chart is overloaded, you start seeing phantom support and resistance levels everywhere, making it impossible to spot the zones that actually matter. Stick to the big, obvious levels—the ones you can see clearly on higher timeframes and that have been tested multiple times. A clean chart leads to clear thinking.
Another classic mistake is setting your stop-loss way too close to your entry. It feels safe, like you're minimizing risk, but it fails to account for the normal ebb and flow of the market.
Placing a stop-loss just a few ticks below a support level is a recipe for getting stopped out by random noise, even if your trade idea was completely right.
Give your trade some breathing room. Place your stop a reasonable distance beyond the level to absorb that volatility. This one tweak can dramatically cut down on those frustrating trades that get stopped out right before rocketing in your favor.
Fighting the Prevailing Market Current
A single support or resistance level, no matter how strong it looks, rarely has enough power to single-handedly reverse a dominant market trend. A frequent—and expensive—mistake is trying to "catch a falling knife" by buying at a minor support level while the market is in a freefall.
It’s like trying to swim upstream against a powerful river current. You might make a tiny bit of progress, but the odds are overwhelmingly stacked against you. Always, always analyze support and resistance within the context of the bigger picture.
- In a strong uptrend: Your focus should be on buying dips at support or trading breakouts above resistance.
- In a strong downtrend: Your best bets are selling rallies at resistance or trading breakdowns below support.
Aligning your trades with the primary trend is one of the simplest and most effective ways to put the odds in your favor. Trading against it requires immense skill and perfect timing—a high-stakes game best left to seasoned pros. By steering clear of these common pitfalls, you can start trading support and resistance more effectively and with a lot more confidence.
Building Your Blueprint for Market Analysis
This guide has shown that support and resistance are far more than simple lines on a chart. They're dynamic zones that give us a window into the market's collective psychology—the constant tug-of-war between buyers and sellers. We’ve walked through how to spot different levels, why you absolutely must validate them to filter out market noise, and how to put it all together with practical trading strategies.
The journey from novice to pro is built on this very foundation. You now have the tools to see the market not as a chaotic mess of price ticks, but as a structured environment with clear battlegrounds. Real mastery, though, comes from rolling up your sleeves and putting in the work through consistent application, sharp observation, and disciplined risk management.
Creating Your Personal Framework
Every trader's blueprint will be a little different, but the core principles never change. The real goal here is to build a repeatable process for breaking down charts and making decisions you can stand behind. As you shape your personal blueprint, it's always a good idea to explore different asset classes and their history, even looking at specific issuances like commercial mortgage-backed securities from 2006 vintages.
Your framework should always include:
- Routine Analysis: Make it a habit to map out key support and resistance on higher timeframes. This gives you the big-picture context you need before you even think about a trade.
- Strategy Selection: Look at the market conditions. Is the price action screaming for a bounce strategy, or is a breakout more likely?
- Risk Definition: This is non-negotiable. Never enter a trade without knowing exactly where your stop-loss will be and where you plan to take profits.
The ultimate takeaway is this: successful trading isn't about finding some magical, secret indicator. It's about building a robust, personalized system based on proven principles like support and resistance. Your blueprint is your map for navigating the markets with a clear, strategic edge.
We can't stress this enough: take these concepts and apply them on a demo account. Get your hands dirty. Practice identifying levels, watch how price reacts when it gets there, and test your strategies without putting a single dollar on the line. This is how you build the confidence needed to turn knowledge into consistent results. It’s this disciplined practice that forges a successful trader.
Frequently Asked Questions
Even after you get the hang of support and resistance, a few questions always seem to pop up when you start applying it to live charts. It's one thing to see these concepts in a textbook, but it's another to use them when real money is on the line.
Let's clear up some of the most common sticking points to help you trade with more confidence.
Is Support and Resistance Trading Profitable?
Absolutely, it can be—but it's no magic bullet. The profitability of trading support and resistance comes down to your discipline, how you manage risk, and your skill in spotting the levels that actually matter. Countless successful trading strategies are built on this very foundation.
The trick is to use these levels as a starting point, not the whole strategy. You need to look for other clues, like a specific candlestick pattern or a surge in volume, to confirm your idea. A trader who just blindly buys every time a price touches a support line is probably going to have a rough time. But a trader who waits for that confirmation and always keeps a solid risk-to-reward ratio? That’s how you build a consistently profitable system.
The profitability of using support and resistance isn't in the lines themselves, but in the structured, disciplined trading plan you build around them. It provides a logical framework for making decisions rather than trading on emotion.
What Is the Difference Between Support and Demand Zones?
This is a great question, and while traders often use the terms interchangeably, there’s a subtle but critical difference.
A support level is usually thought of as a single, sharp price line where buyers have stepped in before. It's a precise point on the chart based on past lows.
A demand zone, however, is a wider price area where a big cluster of buy orders is likely sitting. Think of it this way: a support level is like the fine edge of a knife, while a demand zone is the whole flat of the blade. Demand zones are often more reliable because they capture a range of prices, making them less likely to be wiped out by a single, quick price spike.
How Do You Know When a Level Is Broken?
This is where a lot of new traders get tripped up. It's a classic mistake to see the price poke through a level for a second and assume it's broken. This is how you get caught in a "false breakout," or "fakeout."
Most disciplined traders want to see a candle close decisively beyond the level.
- For a resistance break, you’re looking for a strong, full-bodied candle to close clearly above the line.
- For a support break, you need to see a solid candle close confidently below the line.
A long wick that stabs through the level only to snap back is a sign of rejection, not a breakout. To really nail it, add a volume filter. A true, powerful breakout should happen on a noticeable spike in trading volume—that's the market showing you there’s real conviction behind the move.
Ready to stop guessing and start seeing the market's structure with clarity? ChartsWatcher provides the advanced scanning and charting tools you need to automatically identify and backtest key support and resistance levels. Find high-probability setups faster and build a more strategic trading plan today. Explore our features.
