Master the Volume Profile Indicator for Better Trading
Decoding the Volume Profile Indicator
The Volume Profile indicator offers traders a unique perspective on market activity. It's not about simply tracking volume over time. Instead, it reveals the volume distribution across different price levels. This transforms raw trading data into a visual map of where buying and selling pressure is concentrated.
Understanding Volume Distribution
Think of the market as a bustling auction. The Volume Profile indicator shows us a histogram of trading activity at each price point. High-volume areas indicate significant trading, suggesting a consensus between buyers and sellers. These high-volume zones often function as support and resistance levels, influencing future price action.
Low-volume areas, on the other hand, represent prices where fewer transactions occurred. This suggests less agreement on value and implies the price could move swiftly through these levels. Recognizing these dynamics gives traders valuable insight into potential market reactions.
The Point of Control (POC) and Value Area
The Volume Profile indicator highlights important market levels. The Point of Control (POC) is the price with the highest traded volume within a specific timeframe. In a balanced market, this often sits near the midpoint of a trading range. Traders use the POC to identify potential support and resistance zones and assess market sentiment. For example, a POC near the bottom of a range might suggest bearish sentiment. Conversely, a POC near the top could signal bullishness.
If the POC aligns with other indicators, like moving averages on a TradingView chart, it can reinforce the idea of a fair market price. Traders often place orders around these key levels, anticipating a return to the perceived fair value indicated by the POC.
The Value Area (VA) represents the price range where the majority of trading happened. Usually covering 70% of the total volume, the VA offers insight into the price range where most traders perceive value. The VA's upper and lower boundaries often serve as dynamic support and resistance.

Interpreting Volume Profile Shapes
The shape of the Volume Profile offers further clues about market sentiment and potential future price movement. A bell-shaped profile suggests a balanced market. A skewed profile hints at directional pressure. A right-skewed profile, for instance, might indicate increased buying pressure and the possibility of further upward movement.
Analyzing profile shapes is a valuable technique for confirming existing trends or anticipating reversals. This nuanced analysis goes beyond basic price and volume, providing a deeper understanding of the market's underlying forces.
Essential Elements of Volume Profile: Beyond the Basics
What separates a novice from a skilled volume profile analyst? It's the ability to go beyond simply identifying the Point of Control (POC). Truly understanding the volume profile means delving into the wealth of information it offers about market dynamics and how its various components interact.
Deciphering Profile Shapes: A Glimpse into Market Psychology
The shape of the volume profile provides valuable insights into the prevailing market psychology. A bell-curved profile, similar to a normal distribution, often suggests a balanced market with buyers and sellers in relative equilibrium.
A bimodal profile, featuring two distinct peaks, can indicate periods of price disagreement and the potential for increased volatility.
Finally, skewed profiles, leaning heavily to one side, often signal directional pressure. A right-skewed profile, for example, might suggest aggressive buying and a possible upward trend.
The Value Area: Identifying High-Value Trading Zones
The Value Area (VA) represents the price range where a significant portion, typically 70%, of the total trading volume takes place. This area, defined by the Value Area High (VAH) and Value Area Low (VAL), acts as crucial support and resistance levels.
If the price nears the VAH, traders might consider selling, anticipating a potential reversal toward the POC. Conversely, buying near the VAL could be a strategy if a bounce back toward the POC is anticipated. This approach can be particularly effective in calmer, low-volatility markets. Learn more about the Value Area and trading strategies at TradingSim.
Volume Imbalances and Liquidity Voids: Spotting Untapped Opportunities
Understanding asset valuation is essential for effective use of the volume profile indicator. If you're looking to improve your understanding of this area, resources on startup valuation can provide helpful insights. Within the volume profile itself, look for volume imbalances. These are areas where significantly more volume has occurred at specific price levels compared to the surrounding areas. These imbalances can often precede significant price movements.
Liquidity voids, areas with unusually low volume, represent potential zones of rapid price acceleration. This is because there's less resistance to price movement in these areas.
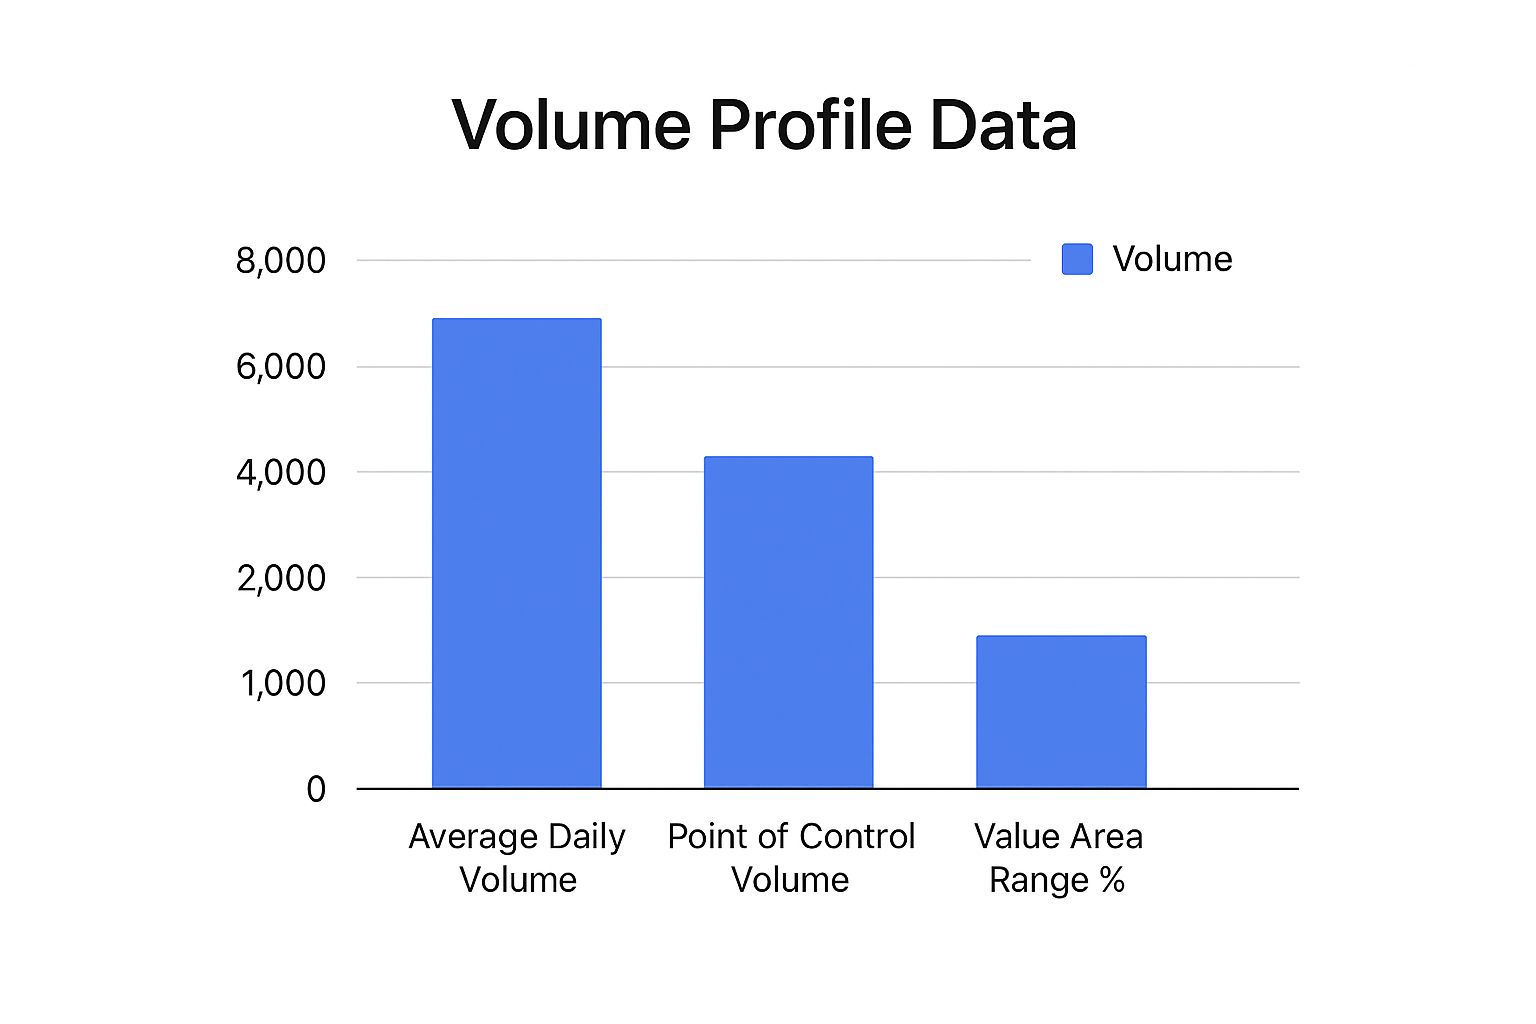
This chart visualizes the Average Daily Volume, Point of Control Volume, and Value Area Range percentage. The Point of Control volume significantly exceeds the average daily volume, highlighting a strong price level. A tighter Value Area Range percentage suggests concentrated trading activity.
Unveiling Market Inefficiencies
Many traders utilize the volume profile indicator to identify and exploit market inefficiencies often overlooked by those relying solely on traditional indicators. You might be interested in learning more about volume spread analysis. By analyzing profile shapes, volume imbalances, and liquidity voids, experienced traders can anticipate potential price movements before they become apparent on standard indicators.
This proactive approach can lead to improved entry and exit points, with the potential to maximize profits and minimize risks. For example, recognizing a developing poor high/low formation, characterized by low volume at extreme price levels, can signal a potential price reversal.
To further enhance your understanding, let's explore the core components of the Volume Profile in more detail:
Volume Profile Core Components
A comprehensive overview of the essential elements of the Volume Profile Indicator and their significance in trading analysis.
| Component | Definition | Trading Significance |
|---|---|---|
| Point of Control (POC) | Price level with the highest traded volume | Represents the strongest level of support/resistance; price tends to revert to the POC |
| Value Area High (VAH) | The upper boundary of the Value Area | Acts as a resistance level; selling pressure may increase as price approaches the VAH |
| Value Area Low (VAL) | The lower boundary of the Value Area | Acts as a support level; buying pressure may increase as price approaches the VAL |
| Value Area (VA) | Price range containing 70% of the total traded volume | Indicates the price range where most trading activity occurred; traders often look for price to remain within or return to the VA |
| Volume Imbalance | Area with significantly more volume than surrounding areas | Potential for future price movement; often precedes breakouts or reversals |
| Liquidity Void | Area with significantly less volume than surrounding areas | Potential for rapid price movement; lack of resistance/support |
This table summarizes the key elements of the volume profile, highlighting their definitions and importance in technical analysis. Understanding these components allows traders to gain a deeper insight into market dynamics and make more informed trading decisions.
Implementing the Volume Profile Indicator in Your Platform
Moving from theory to practice, let's explore how to effectively implement the volume profile indicator on your trading platform. This guide will walk you through setting up and optimizing this powerful tool, highlighting key differences and configurations across popular platforms like TradingView, NinjaTrader, and MetaTrader.
Platform-Specific Implementations: TradingView, NinjaTrader, and MetaTrader
Each platform offers its own version of the volume profile indicator, each with its own quirks and advantages. TradingView, known for its robust charting tools, provides several volume profile variations, including the Fixed Range Volume Profile (FRVP) and the Session Volume Profile (SVP). These offer different ways to visualize volume data based on specific timeframes or trading sessions.
NinjaTrader, a favorite among futures traders, often features a highly customizable volume profile indicator that integrates seamlessly with its advanced charting capabilities. You can typically adjust parameters like the time period, point of control calculation, and value area percentage.
MetaTrader, widely used in forex trading, usually requires adding a custom volume profile indicator through its MQL4/MQL5 programming language. While this might require a bit more initial setup, it offers significant flexibility for traders seeking specific functionality. This allows for precise integration with your existing expert advisors and indicators.
Crucial Configuration Parameters: Fine-Tuning Your Analysis
Regardless of the platform you choose, understanding key configuration parameters is crucial for accurate analysis. Time period selection significantly influences the profile's shape and interpretation. Shorter periods, like those used on intraday charts, reveal short-term volume dynamics. Longer periods, on the other hand, uncover more structural, long-term volume distribution.
Another key parameter is the profile type. Standard volume profiles display the total volume at each price level. Bid/ask volume profiles, however, differentiate between buy and sell volume, offering deeper insights into order flow. You might be interested in: How to backtest trading strategy - the complete playbook for modern traders. Furthermore, visualization settings, such as color schemes and histogram bar width, impact the profile's clarity and readability.
Optimizing for Your Trading Style: Day Trading vs. Long-Term Analysis
The best volume profile configuration depends heavily on your trading style. Day traders, focusing on short-term price fluctuations, benefit from shorter time periods and visualizing intraday volume patterns. For example, a day trader might use a 15-minute or 30-minute chart with a session volume profile to identify intraday support and resistance levels.
Conversely, long-term traders analyzing weekly or monthly charts gain a broader perspective of volume distribution over extended periods. This helps them identify long-term value areas and potential accumulation/distribution zones. A swing trader, for instance, might analyze a daily or weekly chart with a fixed range volume profile to identify significant high-volume nodes that act as key support and resistance. This allows for a more strategic approach to identifying longer-term trading opportunities.
By understanding these platform-specific nuances, crucial configuration parameters, and optimization techniques for different trading styles, you can effectively leverage the volume profile indicator to improve your trading decisions.
High-Probability Trading Strategies Using Volume Profile
Now that we've covered the basics of the Volume Profile indicator, let's dive into how you can use it to develop effective trading strategies. Traders often look to the Volume Profile to pinpoint high-probability entry and exit points, regardless of market conditions.
Range-Bound Markets: Identifying Value
In range-bound markets, price tends to fluctuate between the Value Area High (VAH) and the Value Area Low (VAL). This creates an opportunity to buy near the VAL, anticipating a move towards the Point of Control (POC), and to sell short near the VAH, expecting a pullback towards the POC. This strategy utilizes the historical volume data within the Value Area, providing insights into levels of perceived value.
- Entry: Buy near the VAL or sell short near the VAH.
- Stop Loss: Place your stop loss just beyond the VAL (for buys) or the VAH (for sells).
- Take Profit: Aim for the POC or the opposite end of the Value Area.
Trending Markets: Confirming Momentum
The Volume Profile can also be valuable in trending markets, offering confirmation of trend strength and direction. Watch for shifts in the Point of Control (POC). A rising POC often suggests sustained buying pressure and a strengthening uptrend, while a falling POC can indicate selling pressure and a potential downtrend.
- Entry: Buy in an uptrend when the price retraces to a newly established, higher POC. Sell short in a downtrend when the price bounces to a newly established, lower POC.
- Stop Loss: Place your stop loss below the previous POC in an uptrend, or above the previous POC in a downtrend.
- Take Profit: Employ a trailing stop loss or a multiple of your risk for your take-profit target.
Market Transitions: Identifying Breakouts
The Volume Profile becomes invaluable for validating breakouts. A breakout supported by significant volume within the breakout candle confirms the move's strength, suggesting a higher probability of continuation. Conversely, a low-volume breakout might signal a false breakout, susceptible to reversals.
- Entry: Enter after a breakout, confirmed by high volume within the breakout candle exceeding the volume at previous resistance levels.
- Stop Loss: Set your stop loss just below the breakout point.
- Take Profit: Use technical targets based on prior price swings or projected move measurements derived from chart patterns.
Managing Risk with the Volume Profile
Regardless of your trading strategy, effective risk management is paramount. The Volume Profile can help determine appropriate stop-loss placement and position sizing.
- Stop Loss Placement: Place stop-loss orders outside key volume nodes to avoid getting stopped out by minor price fluctuations within high-volume areas.
- Position Sizing: Use the Value Area's height to gauge volatility. A wider Value Area suggests higher volatility, warranting smaller positions to manage risk. A narrower Value Area indicates lower volatility, potentially allowing for larger positions.
The following table summarizes the key differences between the various strategies utilizing the Volume Profile. It provides a quick reference guide for traders looking to apply this indicator in different market conditions.
Volume Profile Trading Strategies Comparison: This table compares different trading approaches using the Volume Profile indicator across various market conditions and timeframes.
| Strategy Type | Market Condition | Entry Signal | Exit Signal | Risk Level | Timeframe |
|---|---|---|---|---|---|
| Range Trading | Range-bound | Buy near VAL, Sell Short near VAH | POC or opposite end of Value Area | Moderate | Day trading to Swing Trading |
| Trend Confirmation | Trending | Price retracement to a higher POC (uptrend) or bounce to a lower POC (downtrend) | Trend reversal or profit target | Moderate | Swing Trading to Long-term |
| Breakout Validation | All market conditions | High volume breakout candle | Price reaches significant support/resistance or profit target | Moderate to High | Day trading to Swing Trading |
By understanding and correctly applying these strategies in different market environments, traders can greatly improve their ability to find high-probability trading opportunities. Remember that no indicator is perfect. Combining the Volume Profile with other analytical tools and adhering to sound risk management principles is always recommended.
Amplifying Your Edge: Volume Profile With Other Indicators
The volume profile indicator is a powerful tool on its own, but combining it with other technical analysis tools can significantly enhance market understanding. This synergistic approach helps confirm signals, filter out market noise, and provides a more holistic market view.
Enhancing Momentum Indicators With Volume Profile
Momentum indicators, such as the Relative Strength Index (RSI) and Moving Average Convergence Divergence (MACD), measure the speed and magnitude of price changes. However, they often lack the context of volume. This is where the volume profile becomes invaluable.
Pairing momentum indicators with the volume profile allows traders to validate signals against actual traded volume. A bullish RSI divergence, for instance, becomes more compelling when the volume profile reveals increasing volume at lower price levels. This suggests strong buying pressure, supporting the potential reversal. On the other hand, a bearish MACD crossover coupled with a high-volume node in the volume profile at the breakdown point reinforces the potential for further downside.
Integrating Trend Indicators and Volume Profile
Trend indicators, such as moving averages and trend lines, help identify the prevailing market direction. However, differentiating genuine breakouts from false moves can be difficult with trend indicators alone. The volume profile adds a critical layer of confirmation.
A breakout above a trend line supported by a high-volume node strengthens the breakout’s validity. Conversely, a low-volume breakout might signal a false breakout, increasing reversal risks. Similarly, observing high volume as the price crosses a moving average reinforces the potential trend shift.
Combining Volatility Measures With Volume Profile
Volatility indicators, like Bollinger Bands, measure price fluctuation. Combining Bollinger Bands with volume profile insights can reveal valuable information.
For example, a price reaching the upper Bollinger Band with low corresponding volume in the volume profile could suggest a weakening trend. Alternatively, a price touching the lower Bollinger Band with high volume might signal strong buying interest and a potential price bounce. This combined approach can uncover hidden opportunities missed by single-indicator strategies.
Practical Application: A Real-World Example
Imagine a scenario where the RSI shows a bullish divergence. Analyzing the volume profile reveals increasing volume near the divergence point, confirming buying pressure. If the price then breaks above a key resistance level with high volume, as indicated by the volume profile, it further validates the long trade.
This example illustrates how converging signals create a high-probability trading opportunity. The volume profile acts as a crucial confirmation tool, clarifying potentially ambiguous signals. This is the power of integrating the volume profile with other indicators—achieving a more complete understanding of market dynamics. By layering these tools, traders gain a multi-dimensional perspective, improving market anticipation and trading decisions. This enhanced analysis ultimately leads to more informed choices and potentially better outcomes.
Advanced Volume Analysis Techniques for Serious Traders
Building on the basics of the volume profile indicator, this section explores advanced techniques used by professional traders. These methods offer a deeper understanding of market structure and potential price movements.
Unveiling Long-Term Market Structure With Composite Profiles
Composite volume profiles merge volume data across multiple time periods to offer a comprehensive view of long-term market structure. This differs from standard profiles, which usually concentrate on a single trading session or a set timeframe. By compiling volume over extended periods, composite profiles highlight high-volume areas that act as strong support and resistance levels.
This information is crucial for identifying major turning points and long-term value areas in the market. Knowing these key levels can help traders make more informed decisions about entries and exits.
Split Profiles: Uncovering Intra-Session Behavior
Split profiles divide volume data according to specific parameters. This might include differentiating between buy and sell orders or analyzing different trading sessions separately. This breakdown reveals intra-session behavior patterns that can often predict short-term price action.
For instance, if a split profile reveals substantially higher buy volume in the morning session versus the afternoon session, it might indicate weakening buying pressure. This could suggest a potential reversal later in the day, providing valuable insights into the session's dynamics.
Critical Profile Formations and Their Interpretations
Certain profile formations provide essential clues about potential future price movements. Three key formations are particularly important for traders to recognize:
- Poor Highs/Lows: These are marked by low volume at extreme price levels. Poor highs/lows often hint at possible reversals as the extremes lack sufficient volume to sustain the price move.
- Excess Areas: These are zones with extremely high volume. Excess areas signal potential exhaustion of buying or selling pressure. A large excess area at a price high, for example, could foreshadow a significant decline.
- Balance/Imbalance Patterns: Balanced profiles, often resembling a bell curve, suggest market equilibrium. This hints at potential consolidation. Conversely, imbalanced profiles suggest directional pressure, indicating potential breakouts.
How Institutional Traders Utilize Developing Profile Shapes
Institutional traders carefully track developing volume profiles during trading sessions. They analyze how volume is distributed at different price points to anticipate short-term price direction.
For example, if an institutional trader sees a developing poor high with diminishing volume, they might predict a reversal and open short positions. This real-time approach to volume profile analysis helps them capitalize on potential market moves before they become apparent to others.
Multi-Timeframe Volume Analysis: A Comprehensive Market Perspective
Analyzing volume profiles across various timeframes provides a comprehensive understanding of market dynamics. Traders using weekly, daily, and intraday charts with volume profile analysis gain a well-rounded perspective.
A long-term uptrend confirmed by a weekly composite volume profile, combined with a short-term pullback to a high-volume node on a daily volume profile, could signal an attractive buying opportunity. This multi-timeframe approach often reveals opportunities that single-timeframe traders might overlook.
These advanced volume profile analysis techniques offer traders early indications of potential turning points and continuation patterns. This information provides a significant edge, helping serious traders anticipate market movements and optimize their trading strategies.
Avoiding Common Volume Profile Pitfalls and Limitations
The volume profile indicator, while a powerful tool, has its limitations. Understanding these pitfalls is crucial for accurate interpretation and maximizing its effectiveness. Let's explore some common challenges and strategies to mitigate them.
Market Type Considerations: Equities, Futures, and Forex
Volume interpretation differs across market types. Equities markets often have distinct high and low volume periods, influenced by news, earnings reports, and market sentiment. Futures markets, with continuous trading and leverage, can show more consistent volume, although still affected by economic data and price movements. Forex, a decentralized 24/5 market, has constant volume flow, making traditional volume profile interpretations less clear.
Adapting your approach is essential. For equities, focusing on relative volume changes within specific periods can be more insightful. In forex, using tick volume or shorter timeframe volume profiles offers a more granular view. For more advanced strategies, explore additional resources on advanced trading strategies.
The Impact of After-Hours Trading and Overnight Gaps
After-hours trading can distort volume profiles, especially in equities. This data, representing a smaller, less liquid market, can create misleading interpretations of regular market hours activity.
Similarly, overnight gaps cause discontinuities. Gaps, representing price jumps without trading, make volume distribution assessment difficult. Consider session volume profiles to isolate regular hours or adjust your timeframe to exclude after-hours activity and gaps.
Navigating Low-Liquidity Environments
Volume profiles are less reliable in low-liquidity environments. Thinly traded markets experience exaggerated price swings due to limited buying/selling pressure. This can lead to false breakouts or breakdowns.
Low-volume nodes may not indicate significant support or resistance. Confirm volume profile signals with other indicators, focus on price action, or adjust your strategy to account for increased volatility and decreased reliability.
Case Studies of Failed Volume-Based Trades
Analyzing failed trades despite seemingly strong volume profile signals is invaluable. A breakout from a high-volume node might fail due to a news event. Support at a low-volume node could break down due to a large sell order.
Examining these scenarios helps identify warning signs and develop strategies. For instance, if volume profile signals often fail during high volatility, reduce position sizes or avoid trades during these periods.
Maintaining Your Edge During Unusual Market Conditions
No indicator is foolproof. Unexpected events can disrupt patterns and invalidate setups. Maintaining an edge requires flexibility.
Continuously evaluate market conditions and adapt. During volatility or uncertainty, rely less on volume profiles and focus on other tools or risk management techniques. Acknowledging limitations and being flexible helps you use the volume profile effectively while protecting your capital.
Ready for professional charting and scanning tools? Visit ChartsWatcher today.
