Mastering Intraday Trading Chart Patterns for Quick Wins
Intraday chart patterns are the market's language, a visual story of supply and demand playing out in real time. For traders, they offer a clear roadmap, translating the constant tug-of-war between buyers and sellers into recognizable shapes that hint at where the price is headed next.
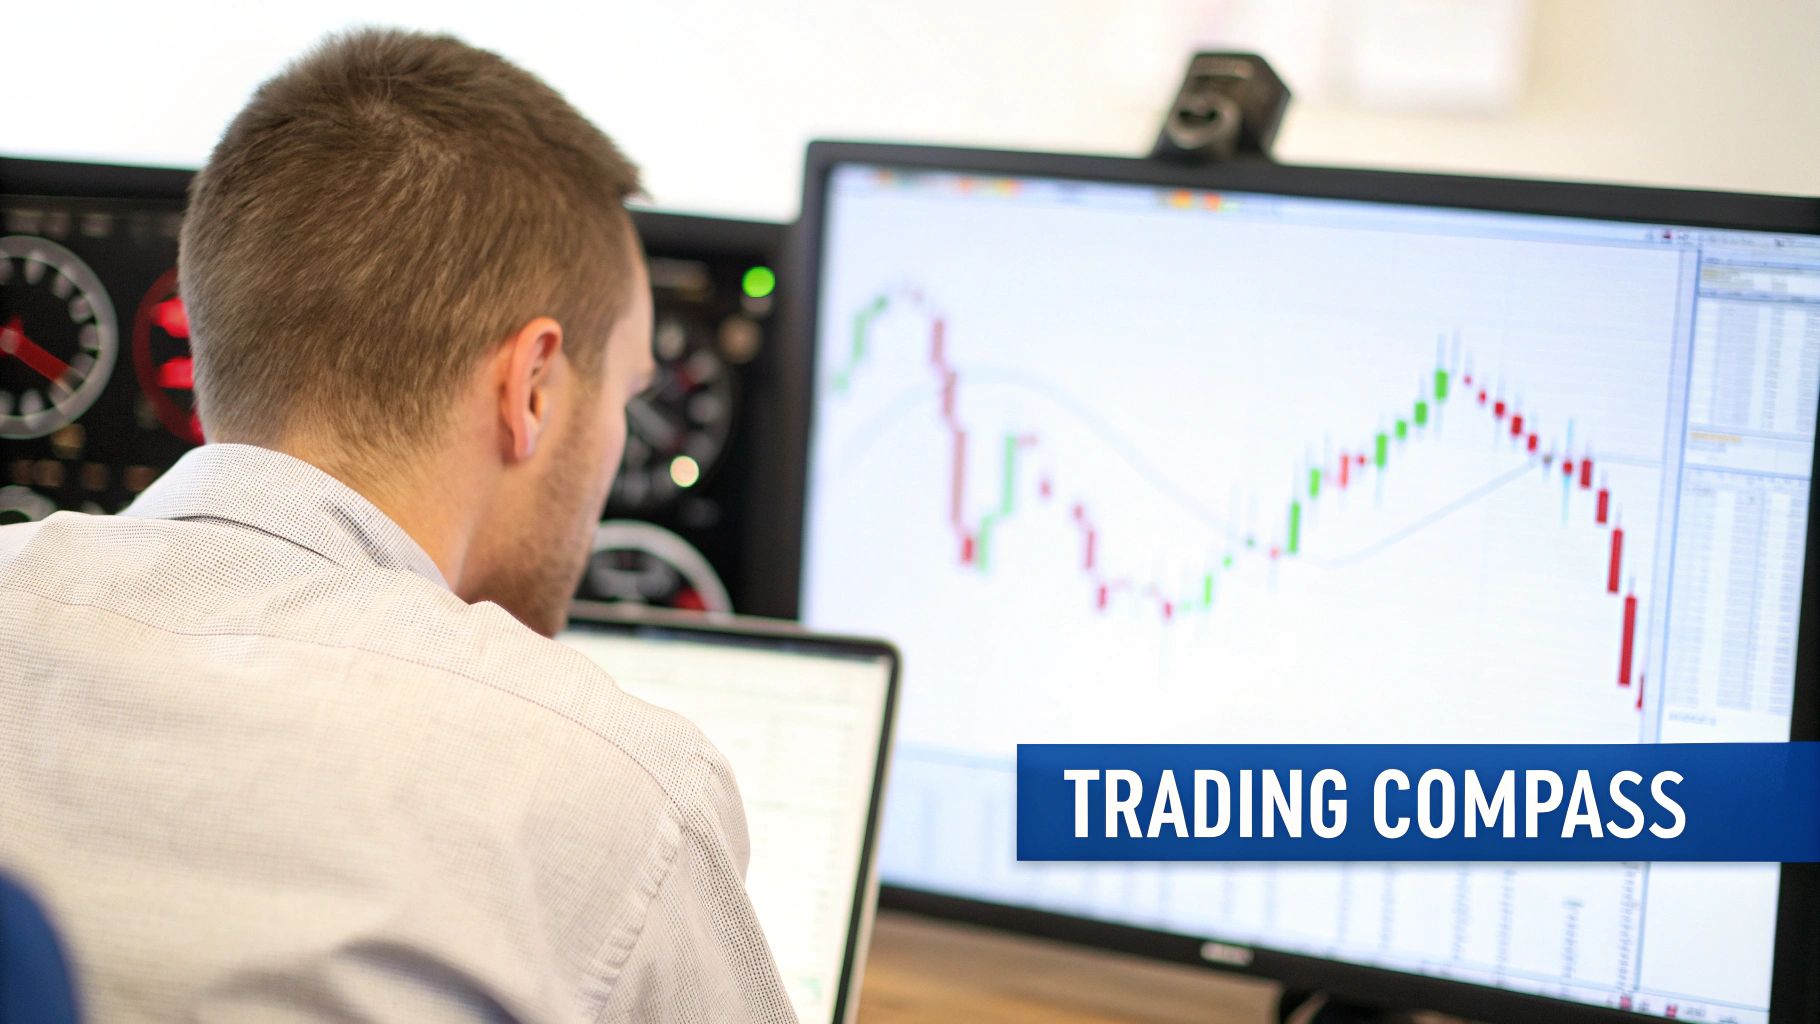
Why Intraday Chart Patterns Are Your Trading Compass
Ever tried to navigate a storm without instruments? You might get by on gut instinct, but the odds are seriously stacked against you. For a day trader, trying to navigate the market's choppy, fast-moving waters without understanding chart patterns is just as risky. These patterns are your essential cockpit instruments, giving you real-time feedback on market psychology and momentum.
These formations aren’t just squiggles on a screen. They’re the real-time stories of fear, greed, and indecision unfolding minute by minute. Learning to spot them means you can start anticipating price moves instead of just reacting to them, turning what looks like market chaos into a series of structured, manageable opportunities.
Reading the Market's Story
Every pattern tells you something important. A period of tight, sideways consolidation might scream indecision. A sharp, high-volume breakout, on the other hand, signals a powerful new consensus. By learning to read these cues, you gain a massive edge. You're no longer just chasing price changes; you're proactively hunting for setups that offer a solid risk-to-reward ratio. This is the shift from gambling to strategic, disciplined trading.
Think of each chart pattern as a recurring plot in the market’s ongoing narrative. The characters (stocks) and settings (market conditions) always change, but the underlying psychological dramas of fear and greed play out in surprisingly predictable ways.
This framework below shows exactly how patterns, market psychology, and momentum fit together to create your trading compass.
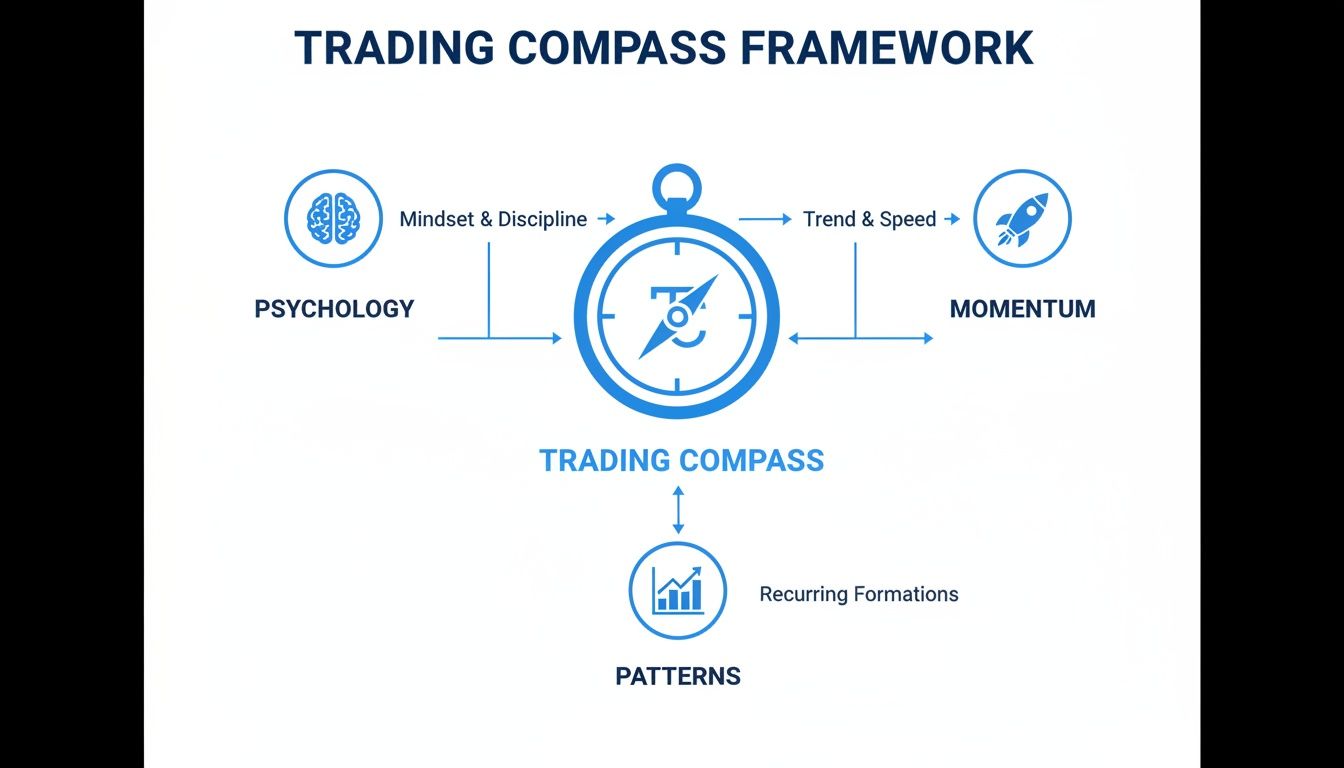
As you can see, successful pattern trading isn’t just about memorizing shapes. It’s about understanding the human behavior and the market forces that create them in the first place.
To get started, here's a quick look at the patterns we'll be breaking down in this guide.
Quick Guide to Common Intraday Patterns
This table provides a high-level overview of the key chart patterns we'll cover, what type of pattern they are, and what they generally signal to a trader.
| Pattern Name | Pattern Type | Primary Signal |
|---|---|---|
| Flag | Continuation | Trend is pausing before continuing |
| Pennant | Continuation | Brief consolidation before the next leg |
| Double Top/Bottom | Reversal | Potential trend change is imminent |
| Head & Shoulders | Reversal | Classic sign of a topping or bottoming trend |
| Rising/Falling Wedge | Reversal | Momentum is weakening, reversal likely |
| Inside Bar | Continuation/Reversal | Indecision; breakout could go either way |
| Breakout/Retest | Confirmation | Confirmation of a new price direction |
Think of this as your cheat sheet. We'll dive much deeper into the specifics of each one, but it's a good reference point to have.
From Theory to Practical Application
The real power of these patterns is that they are quantifiable. Intraday setups like flags, wedges, and the head-and-shoulders pattern have observable success rates that can help you manage risk and set realistic price targets.
For example, a classic pattern known as the opening-range breakout historically makes its most powerful moves within the first 30–45 minutes of the opening bell. This gives traders a specific, high-probability window to focus their attention. You can learn more about these statistical tendencies and how intraday patterns repeat on TradeThatSwing.
Ultimately, mastering intraday chart patterns gives you a repeatable framework for making sense of market behavior. It's a foundational skill that will serve as our roadmap for the rest of this guide, where we’ll get into the nitty-gritty of how to spot these patterns and, more importantly, how to trade them.
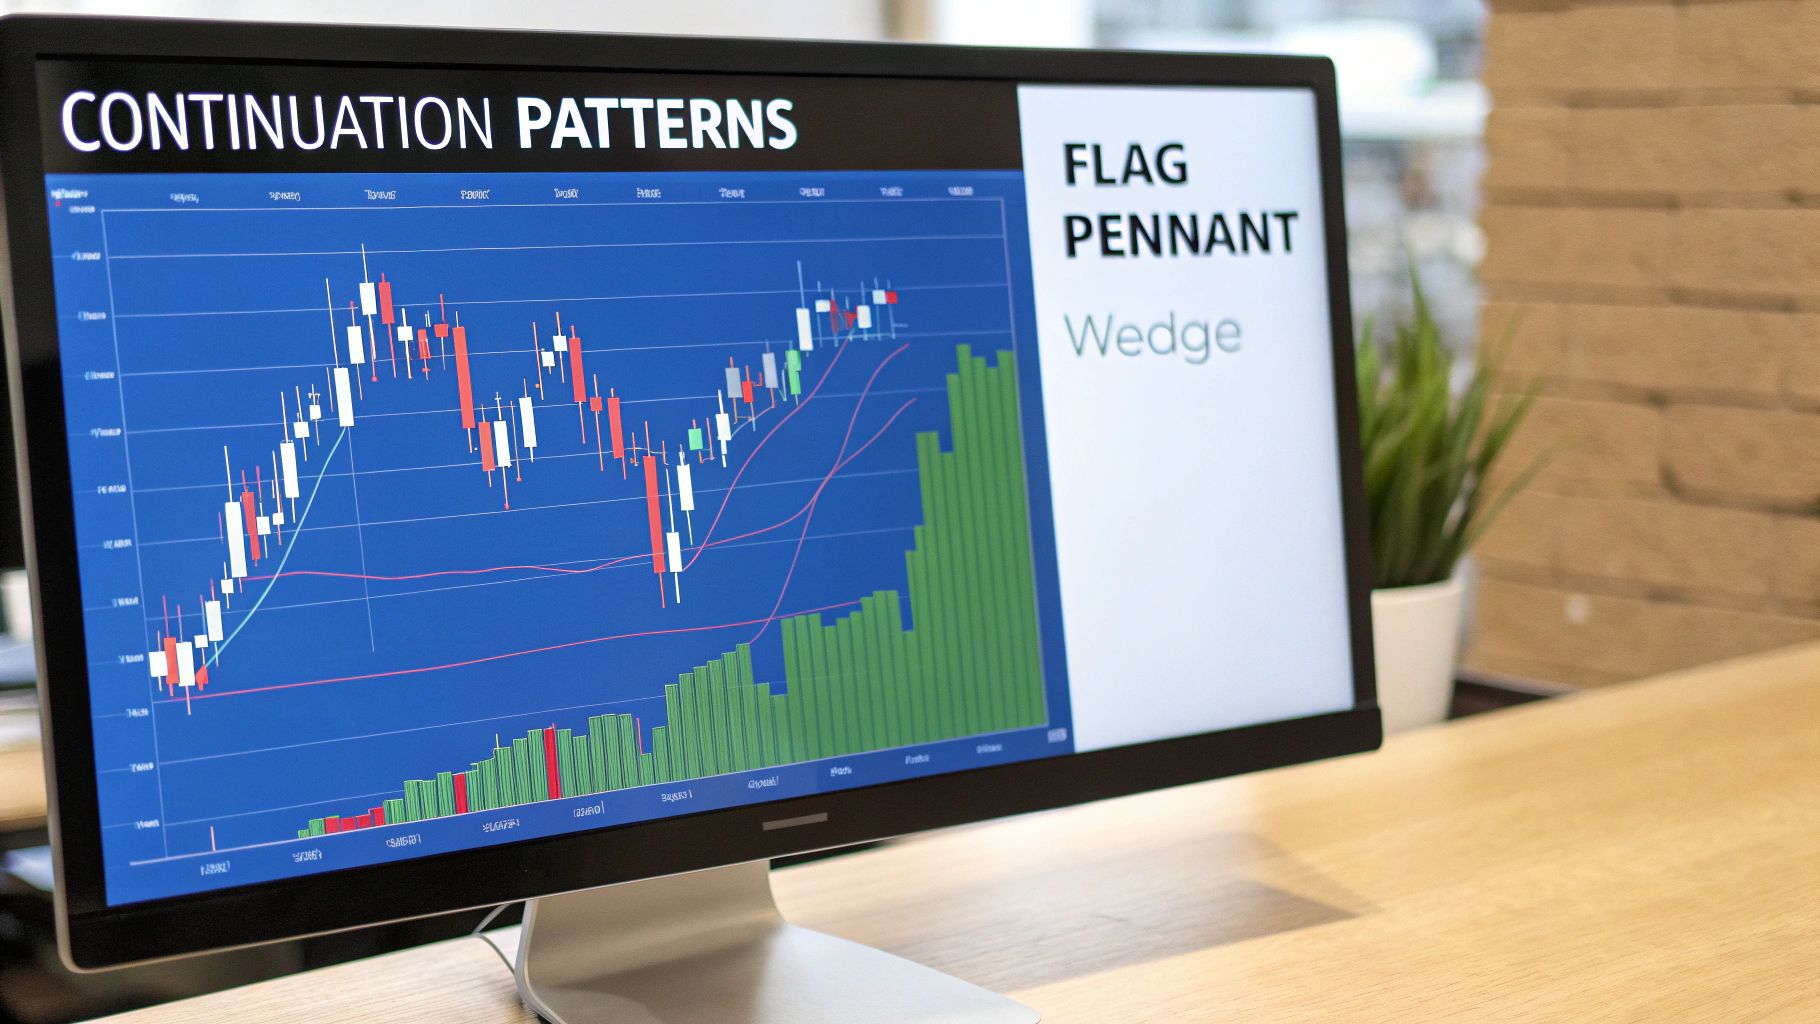
Decoding Powerful Continuation Patterns
Some of the biggest moves you’ll see in the market happen right after a period of rest. It's like watching a sprinter take a quick breather before exploding into the next leg of a race. Continuation patterns are exactly that—the market taking a structured pause before picking up where it left off.
For day traders, these formations are gold. They offer clear, logical entry and exit points because they signal that the big players are just reloading, not reversing course. Learn to spot them, and you can position yourself to catch the next powerful wave of momentum.
The three main continuation patterns you’ll run into on 5-minute and 15-minute charts are Flags, Pennants, and Wedges. They might look a little different, but they’re all born from the same market psychology: a temporary timeout within a strong, established trend.
The Anatomy of Bull and Bear Flags
The Flag pattern is probably the one you'll recognize most easily. It’s got two distinct parts: the flagpole and the flag itself.
- The Flagpole: This is a sharp, almost vertical price move that happens on high volume. It’s the initial burst of buying or selling that screams, "This is the trend right now!"
- The Flag: Right after the flagpole, the price settles into a consolidation phase. This creates a small, rectangular channel that slopes against the trend. For a bull flag, the channel drifts downward; for a bear flag, it creeps upward.
That counter-trend slope is the key. In an uptrend, a gentle downward drift shows the pullback is weak and orderly—it's not a real reversal. You should also see volume dry up as the flag forms, which tells you there’s no real conviction from the other side. The trade signal fires when the price breaks out of that channel, ideally with a fresh surge in volume.
For a much deeper look at this setup, check out our complete guide to trading the bull flag pattern.
Identifying Pennants for Quick Entries
A Pennant is a close cousin of the flag. It also forms after a strong flagpole, but the consolidation looks like a small, symmetrical triangle instead of a rectangle. Those converging trendlines show that volatility is shrinking as buyers and sellers find a temporary balance.
Think of it like a coiled spring. This price compression often leads to an explosive move. The checklist is the same as the flag: a sharp flagpole, consolidation on declining volume, and a breakout in the direction of the initial trend. When the price breaks out from the tip of that pennant, that’s your cue to get in.
A core principle here is that the market rarely moves in a straight line. These pauses are healthy. They shake out the weak hands and let new money build positions before the next leg up or down.
Understanding Rising and Falling Wedges
Wedges are bigger patterns that can signal either continuation or reversal, but when you spot one inside a strong trend, it usually means the trend is about to continue.
A Falling Wedge during an uptrend is a bullish signal. It's made of two converging trendlines, both pointing down. What this tells you is that while sellers are trying to push the price down, they're losing steam with each attempt. When the price finally breaks above the upper trendline, the bulls have wrestled back control.
On the flip side, a Rising Wedge in a downtrend is a bearish sign. Both trendlines point up, showing that each little rally is weaker than the last. A clean break below the lower support line signals that the sellers have absorbed the buying pressure and the downtrend is ready to resume.
Confirmation and Profit Targets
No pattern is a sure thing, so you always need confirmation. The best confirmation you can get is a big spike in trading volume on the breakout candle. That tells you the market is throwing its weight behind the move.
Setting profit targets for flags and pennants is pretty straightforward. A common method is to measure the height of the flagpole and then project that same distance from the breakout point. This gives you a logical, data-driven target for your trade.
And these patterns aren't just pretty pictures; they have a statistical edge. Studies show that well-formed continuation patterns like ascending triangles and rectangles can hit their breakout targets around 65–69% of the time, especially when confirmed with a solid trend and volume. This is exactly why traders learn to hunt for these setups.
Spotting Trend Reversals Before They Happen
Knowing when a powerful trend is running out of steam is just as profitable as catching it at the very start. While continuation patterns help you ride the wave, reversal patterns are your early warning system, signaling that the tide is about to turn. Spotting these formations lets you cash out of a winning position before it turns sour, or even flip the script and take a new trade in the opposite direction.
These patterns represent a major shift in market psychology. They don't just pop up out of nowhere; they're the battle scars left on the chart after a drawn-out fight where the dominant side—buyers in an uptrend or sellers in a downtrend—finally loses control. We'll zero in on three classic reversal patterns that show up time and again on intraday charts: Double Tops, Double Bottoms, and the Head and Shoulders.
The Double Top and Double Bottom
Think of a Double Top as the market trying—and failing—to push to a new high. It’s a classic story of exhaustion. The pattern shows up after a strong uptrend and looks like two distinct peaks at roughly the same price level, separated by a noticeable pullback.
The psychology here is simple but powerful. The first peak is just business as usual in a healthy uptrend. But when the price pulls back and then rallies to that same peak again—and gets rejected—it sends a huge signal. Buyers who were once piling in are now second-guessing, and sellers are starting to smell blood in the water.
The neckline is a horizontal line drawn across the low point of the valley between the two peaks. This line is everything.
The neckline is the market's line in the sand. A decisive, high-volume break below this level is your confirmation that the uptrend is likely over and sellers have won the battle. Trading before this confirmation is just gambling.
A Double Bottom is simply the mirror image. It appears at the end of a downtrend and looks like the letter "W." It shows sellers trying twice to push the price to a new low and failing both times, which tells you the selling pressure is finally drying up. A break above the neckline here confirms the bulls are back in charge.
Anatomy of a Reversal Pattern Trade
Let's walk through trading a Double Top:
- Identification: Spot an uptrend that forms a peak, pulls back, and then retests that same high without breaking through it.
- Draw the Neckline: Connect the lowest point of the trough between the two peaks with a horizontal line.
- Wait for Confirmation: Don't jump the gun and short just because a second peak has formed. You must wait for the price to close below the neckline, ideally with a visible spike in selling volume.
- Entry and Stop-Loss: Your entry point is on the break of the neckline. You can place your stop-loss just above the neckline or, for a more conservative approach, above the twin peaks.
- Profit Target: A common method for setting a target is to measure the height from the peaks to the neckline, then project that same distance down from the breakout point.
The Head and Shoulders Pattern
The Head and Shoulders is one of the most reliable reversal patterns you'll find in technical analysis. The standard pattern flags a potential market top, while the Inverse Head and Shoulders signals a potential market bottom.
It's made up of three peaks:
- Left Shoulder: A strong peak followed by a minor pullback.
- Head: A higher peak than the left shoulder, which is then followed by a deeper pullback.
- Right Shoulder: A third peak that is lower than the head and roughly symmetrical with the left shoulder.
This formation is a beautiful illustration of a trend losing its strength. The "head" represents the final, exhaustive push from buyers. When the price can't even rally back to that high on the right shoulder, it's a dead giveaway that bullish momentum is fading fast.
Just like the Double Top, the Head and Shoulders has a critical neckline. This line is drawn by connecting the low points of the two troughs that separate the shoulders from the head. A break below this line confirms the reversal and signals a potential short entry. For an Inverse Head and Shoulders, you're looking for a break above the neckline to confirm a bullish reversal. Patience is crucial; always wait for that confirming break before acting on these powerful intraday trading chart patterns.
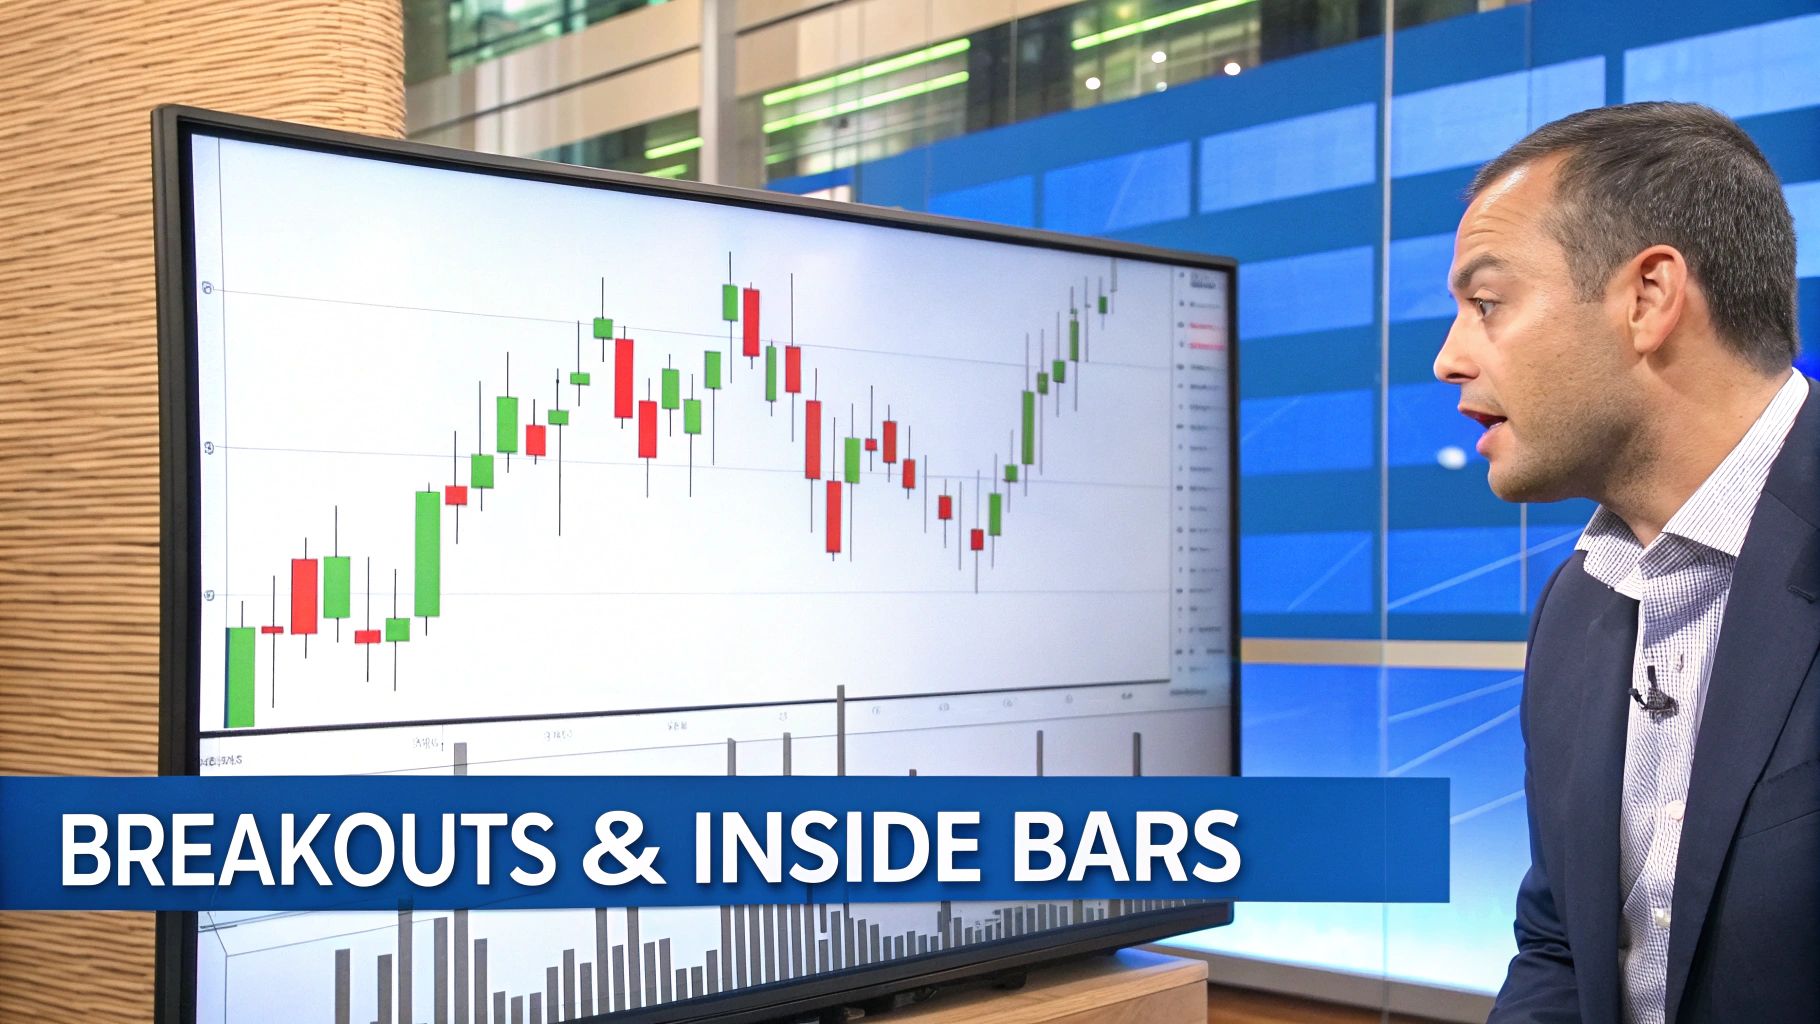
Mastering Breakouts and Inside Bars
Some chart patterns are about reversals, others are about continuation. But two specific setups signal something every intraday trader loves to see: a sudden shift from indecision to conviction.
These are the Breakout and Retest and the Inside Bar. Active traders love them because they offer clear, high-probability entry points with well-defined risk. One shows a confirmed change of control, while the other acts like a coiled spring, just waiting to release a burst of energy.
The Power of the Breakout and Retest
Think of a breakout like punching through a wall. That first move is powerful, but it's often messy and unpredictable. Chasing that initial explosive candle is a rookie mistake, as prices frequently snap back just as quickly.
This is where the "retest" comes in. It’s the market’s way of coming back to check if that wall has truly turned into a new floor.
A breakout happens when the price smashes through a key support or resistance level. But the smart money often waits. The retest is that moment when the price pulls back to the level it just broke, gives it a tap, and then continues in the new direction.
This simple action is powerful confirmation: old resistance has now become new support (in an uptrend), or old support has turned into new resistance (in a downtrend).
Waiting for the retest is an act of professional patience. It transforms a low-probability chase into a high-probability entry by confirming that other market participants now recognize the new price level as valid.
Trading this way dramatically improves your risk-to-reward ratio. Your entry is much closer to a clear invalidation point, which means you can use a much tighter stop-loss compared to buying the peak of the initial frenzy.
Identifying Inside Bars for Explosive Moves
The Inside Bar is a simple yet incredibly potent two-bar pattern. It signals a temporary truce in the market—a consolidation where volatility contracts. It represents a moment of equilibrium where both buyers and sellers are taking a breath right before a potential expansion.
It’s incredibly easy to spot:
- Mother Bar: This is the first, typically larger candle in the pattern.
- Inside Bar: The second candle, which is smaller and completely contained within the high and low of the Mother Bar.
This formation is like a pressure cooker building steam. The tighter the range of the inside bar, the more compressed the energy, and usually, the more powerful the subsequent breakout. It shows the market is coiling up before making its next decisive move.
For a deeper dive, check out our comprehensive guide to the Inside Bar pattern.
The strategy for trading it is just as straightforward. You can place an entry order just above the high of the Mother Bar and another just below its low. Your stop-loss goes on the opposite side of the pattern. When the price breaks out, one order gets triggered, and you simply cancel the other.
A pattern’s effectiveness can also be viewed through a statistical lens. Market behavior isn't totally random; it often follows quantifiable tendencies based on time and context. For instance, a multi-week analysis of the NASDAQ-100 found that Tuesday gaps filled about 70% of the time, while Monday up-gaps filled only 53% of the time. This shows how context truly matters. You can explore more on the statistical analysis of trading patterns with NinjaTrader. Combining a clear pattern like an Inside Bar with this kind of statistical awareness can seriously sharpen a trader's edge.
Applying Advanced Confirmation and Risk Management
Spotting one of the classic intraday chart patterns is a great feeling, but hold your horses—it’s not an automatic signal to jump into a trade. Seeing a potential setup is just the starting line. The pros know that confirmation is what separates a high-probability trade from a costly gamble. This is where you shift from being a pattern spotter to a methodical trader.
Think of it like a detective piecing together a case. The chart pattern is your main clue, but you need supporting evidence to build a strong case before you make your move. Two of the most powerful confirming factors are trading volume and the time of day the pattern forms.
Using Volume as Your Lie Detector
Volume is the market’s truth serum. It reveals the real conviction behind a price move. A breakout from a flag pattern on weak, anemic volume is suspicious and has a much higher chance of failing. On the flip side, a breakout that explodes on a massive surge in volume is like a powerful vote of confidence from the entire market.
Here’s a quick mental checklist for using volume:
- During Consolidation: In patterns like flags or pennants, you want to see volume dry up and become noticeably lower. This tells you it's a healthy pause, not a reversal brewing.
- On the Breakout: The breakout candle should be powered by a significant spike in volume, often several times the recent average. This confirms big players are involved and there's genuine buying or selling pressure.
The Importance of Timing
Not all patterns are created equal, and when they appear matters. The time of day a pattern forms can dramatically impact its reliability. The first and last hours of the trading day are typically the most liquid, with the highest participation from institutional traders.
A picture-perfect head and shoulders pattern forming during the sleepy, low-volume midday session is far less trustworthy than one appearing during the high-energy market open. High-liquidity periods provide the fuel needed for strong, decisive moves, making breakouts cleaner and more likely to follow through.
By layering volume analysis and time-of-day context onto a chart pattern, you are stacking the probabilities in your favor. This methodical approach is the foundation of a robust trading strategy.
To make this crystal clear, here’s a quick reference table for the key signals you should be looking for before pulling the trigger on a trade.
Pattern Confirmation Signal Checklist
| Confirmation Signal | What to Look For | Why It Matters |
|---|---|---|
| Breakout Volume | A significant spike in volume on the breakout candle, ideally 2-3x the recent average. | High volume confirms institutional participation and conviction behind the move, reducing the chance of a "fakeout." |
| Consolidation Volume | Volume should decrease and "dry up" during the formation of a consolidation pattern (e.g., flag, pennant, wedge). | Low volume indicates a temporary pause and indecision, not a reversal. It shows the market is coiling for its next big move. |
| Time of Day | Patterns forming during high-liquidity hours (e.g., the first and last 60-90 minutes of the U.S. session). | High liquidity provides the "fuel" for strong, sustained moves. Patterns during midday are often less reliable. |
| Candlestick Confirmation | The breakout candle should be a strong, decisive candle (e.g., a large bullish or bearish marubozu) that closes firmly above resistance or below support. | A weak, indecisive breakout candle (like a doji) signals a lack of conviction and a higher probability of failure. |
Treat this checklist as your pre-flight inspection. Running through these points helps ensure you’re not just seeing a pattern, but seeing a high-probability setup ready for takeoff.
Building a Bulletproof Risk Management Framework
Even with perfect confirmation, some trades will fail. That’s just part of the game. Your long-term survival depends not on being right every time, but on how you manage your risk when you’re wrong. Beyond just finding patterns, successful intraday trading requires bulletproof top financial risk management strategies for investments.
This framework really comes down to three core pillars:
- The 1% Rule: This is non-negotiable. Never risk more than 1% of your total trading capital on a single trade. This rule ensures that a string of losses won’t knock you out of the game, giving you enough runway for your winning strategy to work.
- Intelligent Stop-Loss Placement: Your stop-loss isn't just a random price. It should be placed at a logical level that proves your trade idea was wrong. For a breakout, a stop could go just below the key level that was breached. For a flag, it might go just below the low of the consolidation.
- Positive Risk-to-Reward Ratio: Before you even think about clicking "buy," you need to know your potential reward versus your potential risk. Always aim for trades where the potential profit is at least twice your potential loss (a 2:1 ratio). This gives you a powerful mathematical edge, ensuring that one winning trade can wipe out the losses from two losers.
Put Your Pattern Analysis on Autopilot with ChartsWatcher
Recognizing intraday chart patterns by eye is a fantastic skill, but let's be honest—it requires a ton of screen time and relentless focus. To get a real edge in today's markets, traders are turning to technology to automate the entire process. This turns abstract knowledge into a systematic, actionable approach, all without being chained to your desk.
This is exactly where a purpose-built tool like ChartsWatcher comes in. Instead of manually flipping through dozens of charts hoping to find a decent setup, you can build custom scanners that do all the heavy lifting for you. This frees up your mental energy to focus on what really matters: managing your trades and refining your strategy, not just spotting patterns.
Build Scanners That Watch the Market for You
Imagine getting an alert the exact moment a clean bull flag forms on a 5-minute chart for any stock in the S&P 500. That’s the power we're talking about. With ChartsWatcher, you can set up highly specific rules for any pattern, asset class, or timeframe you trade.
- Define Your Perfect Pattern: Lay out the exact criteria for a Head and Shoulders, Double Bottom, or Inside Bar.
- Set Your Hunting Ground: Choose which markets to scan—from a handful of stocks to entire indices or forex pairs.
- Get Instant Alerts: Receive real-time notifications the second a high-probability setup matching your rules appears.
Here’s a glimpse of what a configured dashboard looks like in ChartsWatcher, blending live alerts with the market data you need to make a decision.
A good dashboard gives you a central command center, letting you instantly check out an alert by cross-referencing charts and top-performing stocks right then and there.
When you start automating, it's helpful to understand the core trade-offs in how AI models work. Fine-tuning your scanner’s parameters is a balancing act, much like managing the AI speed-accuracy trade-off, to make sure your alerts are both fast and reliable.
Validate Your Strategies with Backtesting
Beyond just finding setups in real time, ChartsWatcher lets you backtest your pattern-based strategies against historical data. This feature is absolutely critical for building real, unshakeable confidence in your approach.
Backtesting is what turns your trading ideas from hopeful guesses into statistically-backed strategies. It shows you how a specific pattern performed over hundreds of past examples, giving you the data-driven conviction to pull the trigger without hesitation in a live market.
By automating your scanning and validating your rules, you shift from discretionary pattern trading to a more objective, rules-based system. For many traders, adding this layer of discipline is the final piece of the puzzle for achieving consistent results.
Frequently Asked Questions
Which Timeframe Is Best for Intraday Trading Chart Patterns?
That really depends on your style. There's no single "best" timeframe—only the one that’s best for you.
Scalpers looking to get in and out of the market in minutes often live on the 1-minute and 5-minute charts. This is where patterns form and play out with incredible speed. Most day traders, though, tend to settle into the 5-minute and 15-minute charts, finding they offer a great balance between seeing enough detail to act and not getting lost in the market noise.
The real trick isn't just picking one, but using them together. Before you ever act on a 5-minute pattern, zoom out to the 1-hour chart. This gives you the bigger picture, the dominant trend. It’s like checking the weather before you leave the house; you want to make sure your small intraday trades are moving with the market's main current, not against it.
How Do I Avoid Falling for False Breakouts?
Learning to sidestep the "fakeout" is one of the most important skills you can develop. It’s the market's favorite trap for eager traders. The single most effective way to protect yourself is to demand confirmation before you jump into a trade. Don't just enter the second a price pokes its head above a key level. Wait. Let the market prove it's serious.
So, what does real confirmation look like?
- A major spike in trading volume right on the breakout candle. This shows conviction.
- A strong, powerful candle that closes decisively above the level. No weak wicks.
- The holy grail: a "retest" where the price pulls back to the old breakout level, touches it, and then bounces off, treating it as new support.
If you can train yourself to wait for these signals, you'll filter out a huge percentage of the market's traps and drastically improve your odds.
Can I Trade Profitably Using Only Chart Patterns?
While chart patterns are incredibly powerful signals, thinking of them as a magic bullet is a fast way to empty your account. They are at their best when used as one piece of a complete trading plan, not as the whole plan itself.
Patterns give you a high-probability setup, a reason to look closer. But it’s everything else—volume analysis, key support and resistance levels, and the overall market context—that turns a good pattern into a great trade.
And above all, none of it matters without iron-clad risk management. Every single trade, no matter how perfect the pattern looks, needs a pre-defined stop-loss and a risk-to-reward ratio that makes sense. Patterns find the opportunities; risk management is what keeps you in the game long enough to profit from them.
Ready to stop hunting for patterns and start getting real-time alerts? ChartsWatcher builds professional-grade scanners that find the exact setups you're looking for, so you can focus on execution. Explore our powerful scanning and backtesting tools today.
