Master Wedge Pattern Trading: Profitable Strategies Inside
Wedge pattern trading is a classic technical analysis strategy that helps you spot when a trend might be about to reverse or take a breather before continuing. It all comes down to identifying contracting price action. The two big players here are the rising wedge, which often hints at a coming downtrend (bearish), and the falling wedge, which typically signals a future uptrend (bullish).
Understanding Wedge Pattern Trading Fundamentals
At its heart, trading wedge patterns is about reading the story the market is telling. These formations show up when the battle between buyers and sellers is getting tighter and tighter, like a spring being coiled. Think of it as a tug-of-war where one team is slowly losing ground but hasn't let go of the rope just yet. That’s the psychology behind a wedge.
This idea of "waning momentum" is crucial. In a rising wedge, the price is still grinding out higher highs and higher lows, but each new push upward is smaller and looks more strained than the last. On the flip side, a falling wedge carves out lower lows and lower highs, but the drops become shallower over time. This tightening action is a huge clue that the dominant trend is running out of gas.
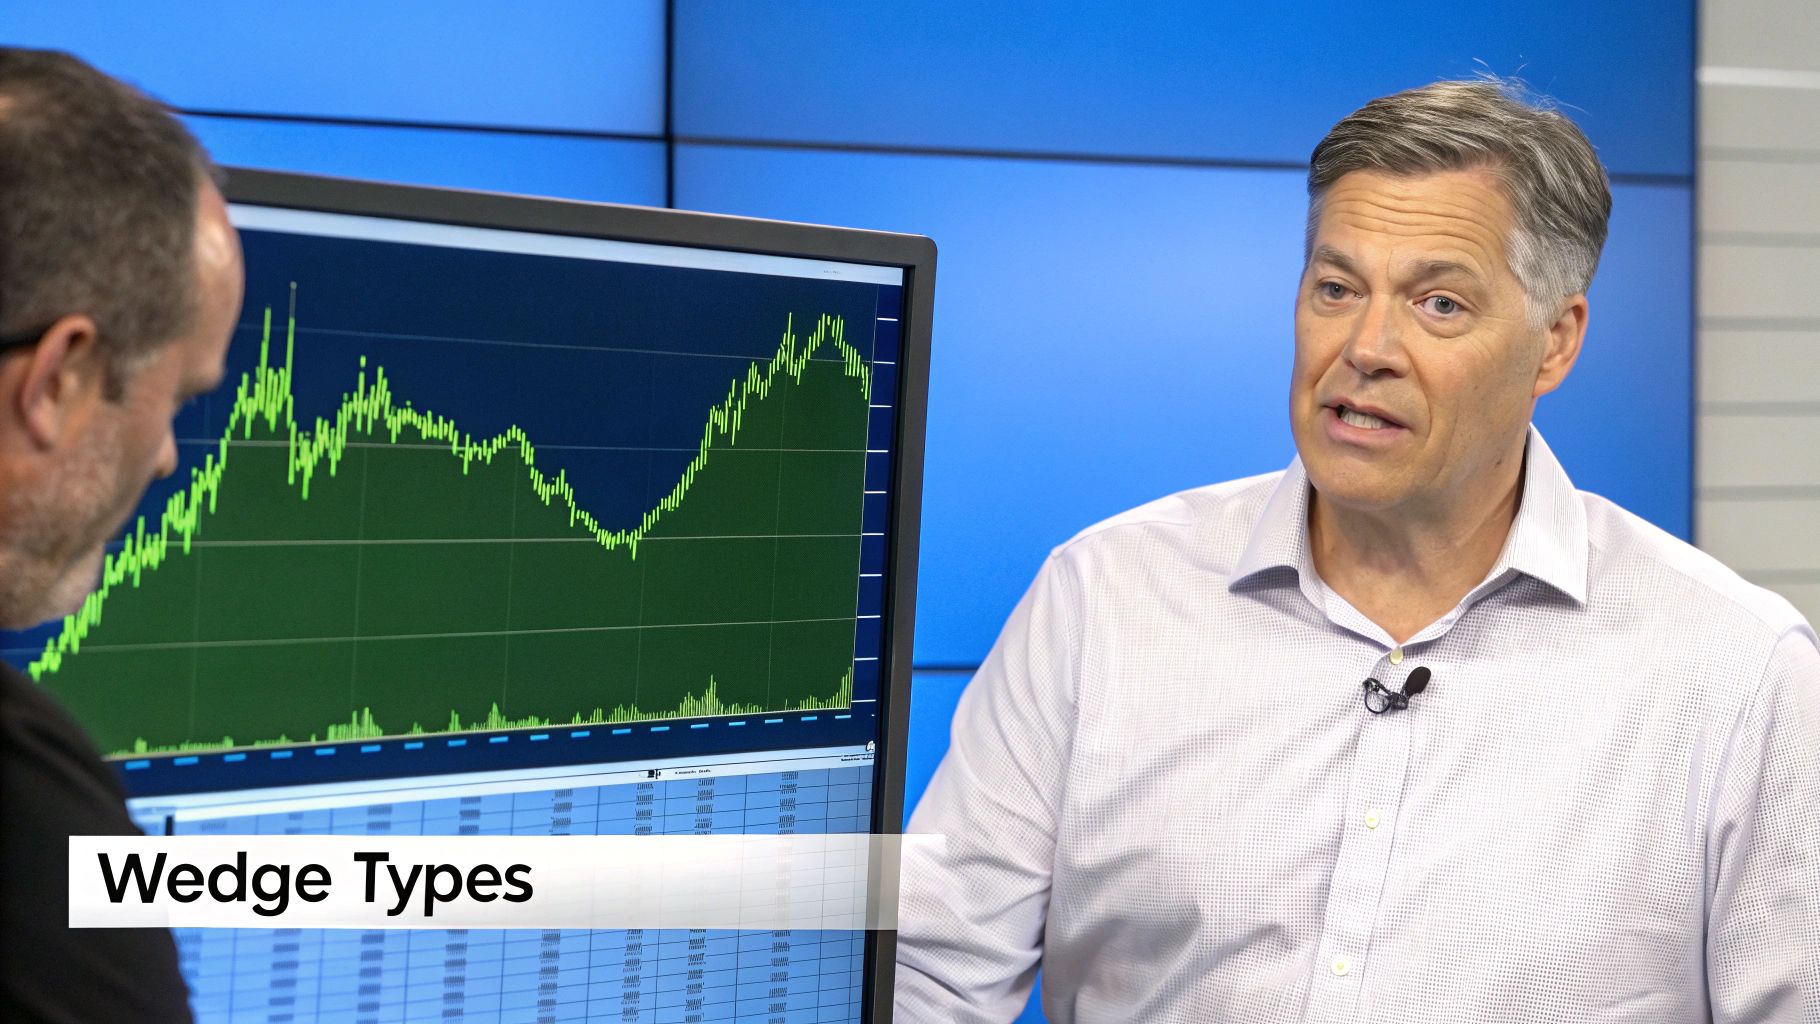
The Two Core Wedge Patterns
Every trader needs to get comfortable telling the two main wedges apart, as they point to completely different outcomes.
-
The Rising Wedge (Bearish): This pattern takes shape when two ascending trendlines squeeze together. You'll often see it pop up near the top of an uptrend, acting as a warning sign for a potential reversal to the downside. It can also appear during a downtrend as a temporary rally before the price drops again. The main takeaway is that buying pressure is fizzling out.
-
The Falling Wedge (Bullish): This one is formed by two descending trendlines that converge. It frequently marks the bottom of a downtrend, signaling a potential bullish reversal. If you spot it during a larger uptrend, it usually acts as a consolidation phase before the next leg up. It's a clear sign that selling pressure is drying up.
To keep things simple, here’s a quick cheat sheet comparing the two.
Rising Wedge vs Falling Wedge At a Glance
This table breaks down the essential differences between rising and falling wedges, helping you quickly identify which pattern you're looking at on a chart.
| Characteristic | Rising Wedge | Falling Wedge |
|---|---|---|
| Appearance | Two ascending trendlines that converge | Two descending trendlines that converge |
| Typical Signal | Bearish (potential downtrend) | Bullish (potential uptrend) |
| Market Psychology | Buying pressure is weakening | Selling pressure is weakening |
| Volume Trend | Tends to decrease as the pattern forms | Tends to decrease as the pattern forms |
| Breakout Direction | Typically breaks below the support trendline | Typically breaks above the resistance trendline |
Remembering these key traits will make spotting and validating these powerful patterns much more intuitive.
Trader's Insight: A common rookie mistake is getting wedges mixed up with triangles. The key difference is the slope. In a wedge, both trendlines are heading in the same general direction (either up or down). With most triangles, one line is flat or they slope in from opposite directions.
Why Volume Is a Decisive Factor
One of the most reliable ways to confirm a wedge pattern is by watching the volume. As the wedge forms and the price range gets tighter, trading volume should ideally be tailing off. This drop in volume is another piece of evidence that conviction in the current trend is fading.
The real money signal, though, comes at the breakout. A legitimate breakout from the wedge needs to happen on a significant spike in volume. This surge shows that a new wave of traders is jumping in with conviction, confirming the old trend is over and a new one is starting. Trading a wedge breakout without that volume confirmation is a much riskier bet.
Identifying High-Probability Wedge Setups
 Spotting a potential wedge on a chart is just the first step. The real art and science of trading these patterns lie in knowing which ones are high-probability setups and which are just market noise. Let's be honest, not every contracting price range is going to hand you a profitable breakout.
That's why focusing on a few quality signals is so critical. The first thing I always check is the integrity of the trendlines. A reliable wedge isn’t a rough sketch; it’s defined by clear, distinct touch points. I look for at least two, but ideally three, solid touches on both the support and resistance lines. Every touch is a story—it represents a failed attempt by buyers or sellers to push through, building up that classic tension.
Reading the Volume Story
Volume is your most crucial confirmation tool here. No question about it. As any wedge forms—rising or falling—you should see a clear, noticeable drop in trading volume. This is the market whispering to you that conviction is drying up.
Think of it like this: in a rising wedge, buyers are technically still in control, but fewer and fewer traders are willing to chase the price higher. For a falling wedge, the sellers are losing steam. This decline in participation is a huge tell that the current micro-trend is exhausted and the market is coiling up for its next big move.
Key Takeaway: A wedge forming on declining volume is a sign of a tired trend. But the breakout must occur on a sharp spike in volume to confirm that new money and conviction are driving the price, validating your trade entry.
This dance between price and volume is a cornerstone of technical analysis. Historically, powerful wedge patterns often build up over longer periods, sometimes spanning 3 to 6 months. These converging lines can signal a major shift in market psychology. That textbook combination—dwindling volume during the formation and a massive spike on the breakout—is what separates the real moves from the fakeouts in any market, from stocks to forex. If you want to dive deeper, there are some comprehensive guides on wedge trading that cover this relationship in more detail.
Confirmation Checklist for Strong Setups
Before you even think about hitting the "buy" or "sell" button, run through this quick mental checklist. It will dramatically improve your odds.
- Trendline Touches: Do you have at least two (and preferably three) confirmed touches on both trendlines? Don't force it. They should be obvious.
- Volume Decline: Has the volume been consistently tailing off as the price action gets tighter and moves toward the apex?
- Context of the Broader Trend: Where is this pattern forming in the grand scheme of things? A falling wedge (which is bullish) is much more reliable if it appears as a pause within a larger, established uptrend.
- Proximity to the Apex: The most powerful breakouts tend to happen between the two-thirds and three-quarters point of the pattern. If the price just drifts sideways all the way to the very tip of the apex, the pattern has likely lost its power.
By being disciplined and focusing on these specific criteria, you can filter out the weak, low-probability patterns. This allows you to concentrate your capital and attention only on the setups that have the highest statistical chance of working out. It's this discipline that separates the pros from the crowd.
How to Execute a Wedge Pattern Trade
Spotting a high-probability wedge is a great skill to have, but turning that chart pattern into a profitable trade? That requires a clear, repeatable process for execution. This is where the rubber meets the road. A disciplined approach to entering, managing, and exiting the trade is what separates traders who get consistently good results from those who just get lucky.
Let's be honest, manually scanning dozens of charts for these patterns is a massive time sink. It's inefficient and you're bound to miss things. This is exactly why a powerful scanner like ChartsWatcher is such a game-changer. You can set up real-time alerts that automatically flag assets forming rising or falling wedges, across any market or timeframe you trade. It completely automates the discovery part of the job so you can focus your valuable energy on analysis, not just searching.
Validating the Trade Setup
Once your scanner flags a potential setup, your job is to step in and validate it. First things first: draw the converging trendlines yourself. You want to see the price make at least two, and preferably three, distinct touches on both the support and resistance lines. The more touches, the more significant the battle between buyers and sellers, and the more powerful the eventual breakout is likely to be.
Next, you have to check the volume. As the wedge tightens and squeezes toward its apex, trading volume should be noticeably declining. This is a classic sign that the dominant trend is running out of gas. A rising wedge with falling volume suggests buyers are getting tired. A falling wedge on weak volume? That tells you the sellers are losing their conviction.
This infographic breaks down the core visual checks for a valid wedge pattern.
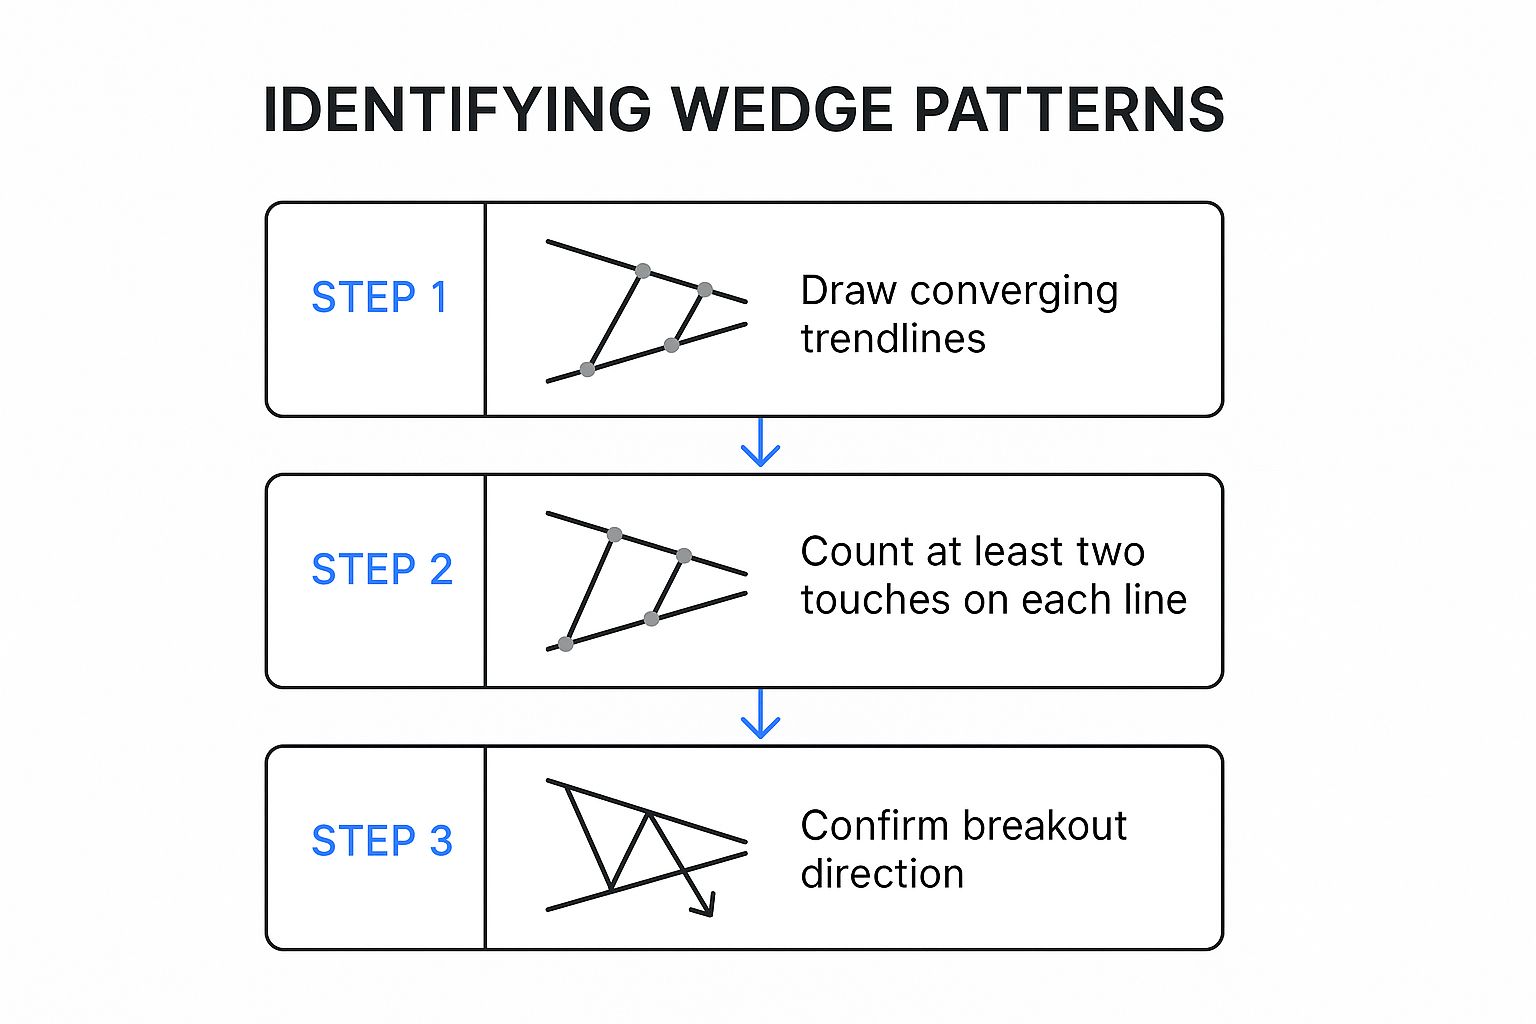
As you can see, it's a simple three-part process: draw your lines, confirm the conditions, and then wait for the breakout—which is the final, crucial piece of the puzzle.
Placing Your Entry and Managing Risk
The trigger for any wedge trade is a confirmed breakout. For a rising wedge (which is bearish), you’ll look to enter a short position once a candle closes decisively below the lower support trendline. For a falling wedge (bullish), you’ll enter a long position after a candle closes above the upper resistance trendline.
Trader’s Tip: The breakout absolutely must be accompanied by a significant spike in volume. This is non-negotiable. A breakout on low volume is a huge red flag and often leads to a "false breakout," or fakeout, that can trap you on the wrong side of the trade.
Once you’re in, risk management becomes your top priority. Your stop-loss order is what protects your capital if the trade turns against you.
- For a Short Trade (Rising Wedge): Place your stop-loss just above the upper resistance trendline of the wedge.
- For a Long Trade (Falling Wedge): Place your stop-loss just below the lower support trendline of the wedge.
This placement makes perfect sense. If the pattern fails and the price pushes back inside the wedge, your loss is contained to a small, predefined amount. You can dive deeper into the specifics by exploring our detailed guide on trading the rising wedge pattern for maximum profit.
Finally, you need a logical profit target. The most common and reliable method is to measure the height of the wedge at its widest point (the base) and then project that distance from the breakout point. This data-driven approach gives you a clear target to aim for, which helps take the emotion out of your exit strategy.
Advanced Tactics for Trading Wedges

Once you’ve nailed down the basics of spotting and trading wedges, it's time to add some layers to your analysis. This is what really separates the consistently profitable traders from everyone else. It’s all about learning how to sidestep the common traps and bringing more powerful confirmation tools into your process.
One of the most frustrating things you'll run into when trading wedges is the false breakout, or "fakeout." This is when the price punches through a trendline, sucks you into a trade, and then snaps right back inside the pattern. They’re maddening, and they can bleed your account if you’re not careful.
Navigating False Breakouts with the Retest
A fantastic tactic for dealing with fakeouts is simply to wait for a breakout retest. Instead of jumping in the second the price breaks the trendline, you practice a little patience. You let the price make its move and then watch for it to circle back and "retest" the very line it just broke.
- For a Falling Wedge (Bullish): After the price breaks above the resistance line, you wait for it to dip back down and tap that old resistance. If it holds, that line has now become new support.
- For a Rising Wedge (Bearish): After the price breaks down through the support line, you wait for a small rally back up to touch that old support. If the price gets rejected, that line has become new resistance.
Entering on a successful retest is a much lower-risk play. It’s your confirmation that other traders now see that old boundary as a new floor or ceiling, which adds a ton of credibility to the breakout’s strength.
Layering Indicators for Stronger Confirmation
Relying on price action and volume alone is a solid foundation, but you can get a much clearer picture by combining wedges with other technical indicators. Think of it as getting a second opinion before committing to a trade.
Trader's Insight: Momentum indicators are your best friend here. When you see a rising wedge taking shape, you should be hunting for bearish divergence on an indicator like the Relative Strength Index (RSI) or MACD. This is when the price is grinding out higher highs, but your indicator is making lower highs, signaling that the momentum behind the rally is fading fast.
This divergence is a huge early warning sign that the uptrend is running out of gas. When you see this along with a rising wedge, the case for a bearish breakdown becomes incredibly strong, giving you a much higher-probability setup.
A classic, real-world example of these principles played out perfectly on the Vanguard Financials ETF (VFH) chart from late 2022 into early 2023. A textbook rising wedge formed over five months as the price climbed from $88.83 to $90.87. Just as importantly, trading volume dwindled throughout this period—a clear sign that conviction from buyers was drying up. When the pattern finally broke down, the price tumbled to its target near $74.09 just one month later. It was a perfect illustration of how price, pattern, and volume work together. You can find more details about this VFH case study on Investopedia.com.
The Statistical Reliability of Wedge Patterns
Let’s be honest. When you're staring at a chart, trusting a pattern comes down to one simple question: does this thing actually work? For wedge patterns, the answer isn't just based on some dusty old trading book. It’s grounded in cold, hard data that can give you the conviction to act when a quality setup flashes on your screen.
Many traders are right to be skeptical of chart patterns. But when you dig into the historical data, you find that wedges are far from random squiggles. They're reliable formations with surprisingly predictable outcomes, especially when you know how to filter for quality and get confirmation from volume.
The Numbers Behind the Breakouts
So, just how effective are these patterns? Multi-year studies across major markets like forex and stocks have put real numbers to the theory. The data reveals a clear statistical edge for traders who can spot a proper wedge.
One comprehensive study found that falling wedges result in a successful bullish breakout about 74% of the time in bull markets. Rising wedges actually perform even better in their native environment, showing an 81% success rate for bearish breakouts during bear markets. These aren't just abstract figures; they represent a major predictive advantage. You can find more details on these findings over at Day-Time-Trading.com.
Key Insight: With success rates often hitting that 70-80% sweet spot, wedge patterns offer one of the most dependable statistical edges in technical analysis. This means more than three out of every four trades, based on a well-identified wedge, have a high probability of moving in the expected direction.
We saw this play out in the real world on the EUR/USD pair back in early 2023, where a rising wedge led to a clean 2.5% decline after the breakdown. A similar story unfolded on USD/JPY in mid-2022, which saw a 3% rally after a textbook falling wedge breakout.
Why Context Is Everything
A pattern's success isn't just about its shape; it's about where it shows up. The broader market trend acts as a powerful amplifier for the pattern’s signal. Think of it this way:
- Falling Wedge (Bullish): This pattern is most powerful when it forms as a consolidation within a larger, existing uptrend. The market is just catching its breath before the next leg up.
- Rising Wedge (Bearish): This pattern carries the most weight when it appears as a tired rally within a larger downtrend. It’s a sign that the brief bounce has run out of steam.
By lining up your wedge trades with the primary trend, you’re stacking the odds firmly in your favor. You’re combining the pattern's own statistical muscle with the momentum of the bigger market picture.
It's also critical to see how these patterns interact with key price levels. Often, a wedge breakout will run right into a nearby supply or demand zone, which can act as the first major hurdle or target. We cover this in detail in our guide on trading supply and demand zones effectively. This evidence-based approach helps you trade with a clear-eyed view of the probabilities.
Common Questions About Wedge Pattern Trading
As you start working wedge patterns into your trading, a few questions always seem to come up. Getting these details straight is what separates a confident trade from a costly mistake, so let's tackle some of the most common ones I hear from other traders.
What's the Real Difference Between a Wedge and a Triangle?
This is a big one. Both are consolidation patterns with trendlines squeezing together, but the key is the slope.
In a wedge, both trendlines are sloped in the same direction. A rising wedge has two upward-sloping lines, and a falling wedge has two downward-sloping lines. They're like a funnel pointing up or down.
Triangles, on the other hand, always have one flat, horizontal trendline. An ascending triangle has a flat top (resistance) and rising support. A descending triangle has a flat bottom (support) and falling resistance. A symmetrical triangle is the odd one out, with one line pointing up and the other down, meeting in the middle.
How Reliable Is a Wedge Breakout Without Volume Confirmation?
Honestly? Not very. Trading a wedge without checking the volume is like driving with your eyes closed—you might get lucky, but you’re taking a huge risk.
The classic, high-probability wedge setup shows volume drying up as the pattern tightens. This tells you the current trend is running out of steam. The breakout you want to trade should happen on a big, obvious spike in volume. That's your confirmation that a new wave of buyers or sellers has entered with conviction.
Without that volume surge, a breakout is far more likely to be a "fakeout." It’s a weak move that doesn’t have the fuel to follow through and hit a realistic price target. Sure, it might work out once in a while, but it's a low-probability play that I personally avoid.
Can I Use Wedge Patterns on Any Timeframe?
Absolutely. Wedges show up everywhere, from the quick-and-dirty 5-minute charts to the slow-moving weekly charts. But what they mean changes drastically.
- A wedge on a weekly chart could signal a massive trend reversal that unfolds over several months.
- A wedge on a 5-minute chart might just predict a small pop or drop that's over in a couple of hours.
The trick is to make sure your trading style matches the timeframe. A day trader shouldn't be making decisions based on a weekly wedge, and a long-term investor shouldn't sweat a tiny wedge on an intraday chart. As a rule of thumb, patterns on higher timeframes are more significant and generally lead to bigger, more reliable moves.
What's the Best Way to Set a Profit Target for a Wedge?
The most common and objective method is to measure the height of the wedge at its widest point—the "base" of the formation.
Once you have that measurement, you project it from the point where the price breaks out. For a rising wedge that breaks down, you project that distance down from the break of the support line. For a falling wedge that breaks out to the upside, you project that distance up. This gives you a logical, data-driven price target and helps keep emotion out of your exit strategy.
Stop searching and start analyzing. With ChartsWatcher, you can build custom dashboards to scan for wedge patterns, set real-time alerts, and validate every trade with powerful charting tools. Discover high-probability setups faster and execute your strategy with precision.
