Master the TTM Squeeze Indicator for Better Trading
Mastering The TTM Squeeze: The Volatility Advantage
The TTM Squeeze indicator isn't just another tool for traders. It offers a unique volatility advantage, acting as a window into the quiet before the storm. It allows traders to anticipate explosive price movements before they happen. This isn't about predicting the future. It's about understanding market dynamics and positioning yourself for high-probability setups. This advantage comes from its ingenious design, combining two well-established technical analysis tools: Bollinger Bands and Keltner Channels.
Understanding The Power of Compression
Think of the market like a coiled spring. When compressed, it stores potential energy. The tighter the compression, the more forceful the release. The TTM Squeeze visually represents this compression on your charts. As the Bollinger Bands, which measure volatility, contract and move inside the Keltner Channels, which measure average price range, they signal decreasing volatility. This is the market “squeezing.”
This compression period, often marked by red dots on the indicator, represents potential energy building up before a significant price move.
This visual representation helps traders understand market psychology. During the squeeze, indecision and uncertainty reign. Traders are hesitant, waiting for a catalyst. This period of quiet consolidation sets the stage for a potential breakout.
As the tension mounts, the market prepares for a release of energy, resulting in a volatile price move. The TTM Squeeze indicator, developed by John Carter of Trade the Markets (now Simpler Trading), is designed to identify these low-volatility periods before significant price breakouts.
It uses Bollinger Bands and Keltner Channels to pinpoint these moments of market compression. When the Bollinger Bands are fully enclosed within the Keltner Channels, it signifies a 'squeeze', a period of low volatility marked by red dots. This setup indicates potential energy building up before a volatile move.

Historical data shows that after such a squeeze, price movements can be quite substantial, allowing traders to capitalize on these breaks. For example, identifying the squeeze can help traders prepare for a possible direction change in prices, which is crucial for making informed trading decisions. The TTM Squeeze has been used effectively in various markets to anticipate these breakout opportunities, emphasizing its relevance and application across different financial instruments. Explore this topic further: Introduction to the TTM Squeeze
Recognizing The Shift: From Red To Green
The transition from red to green dots on the TTM Squeeze is a critical signal. As volatility increases and the Bollinger Bands expand outside the Keltner Channels, the red dots change to green. This signifies the release of the “coiled spring,” marking the beginning of a potential breakout.
This shift from red to green isn’t just a visual change. It reflects a shift in market psychology. The hesitation and uncertainty of the squeeze give way to decisive action. Traders who recognize and capitalize on this transition can position themselves for potentially significant gains.
The TTM Squeeze empowers traders to move from reacting to market movements to anticipating them. Using it effectively across multiple timeframes and market conditions gives professional traders an edge, transforming this indicator from a simple tool into a powerful resource for identifying high-probability setups.
Setting Up Your TTM Squeeze For Maximum Clarity
Turning cluttered charts into powerful tools relies on proper TTM Squeeze setup. It’s not just about adding the indicator; it’s about optimizing it for your specific needs.
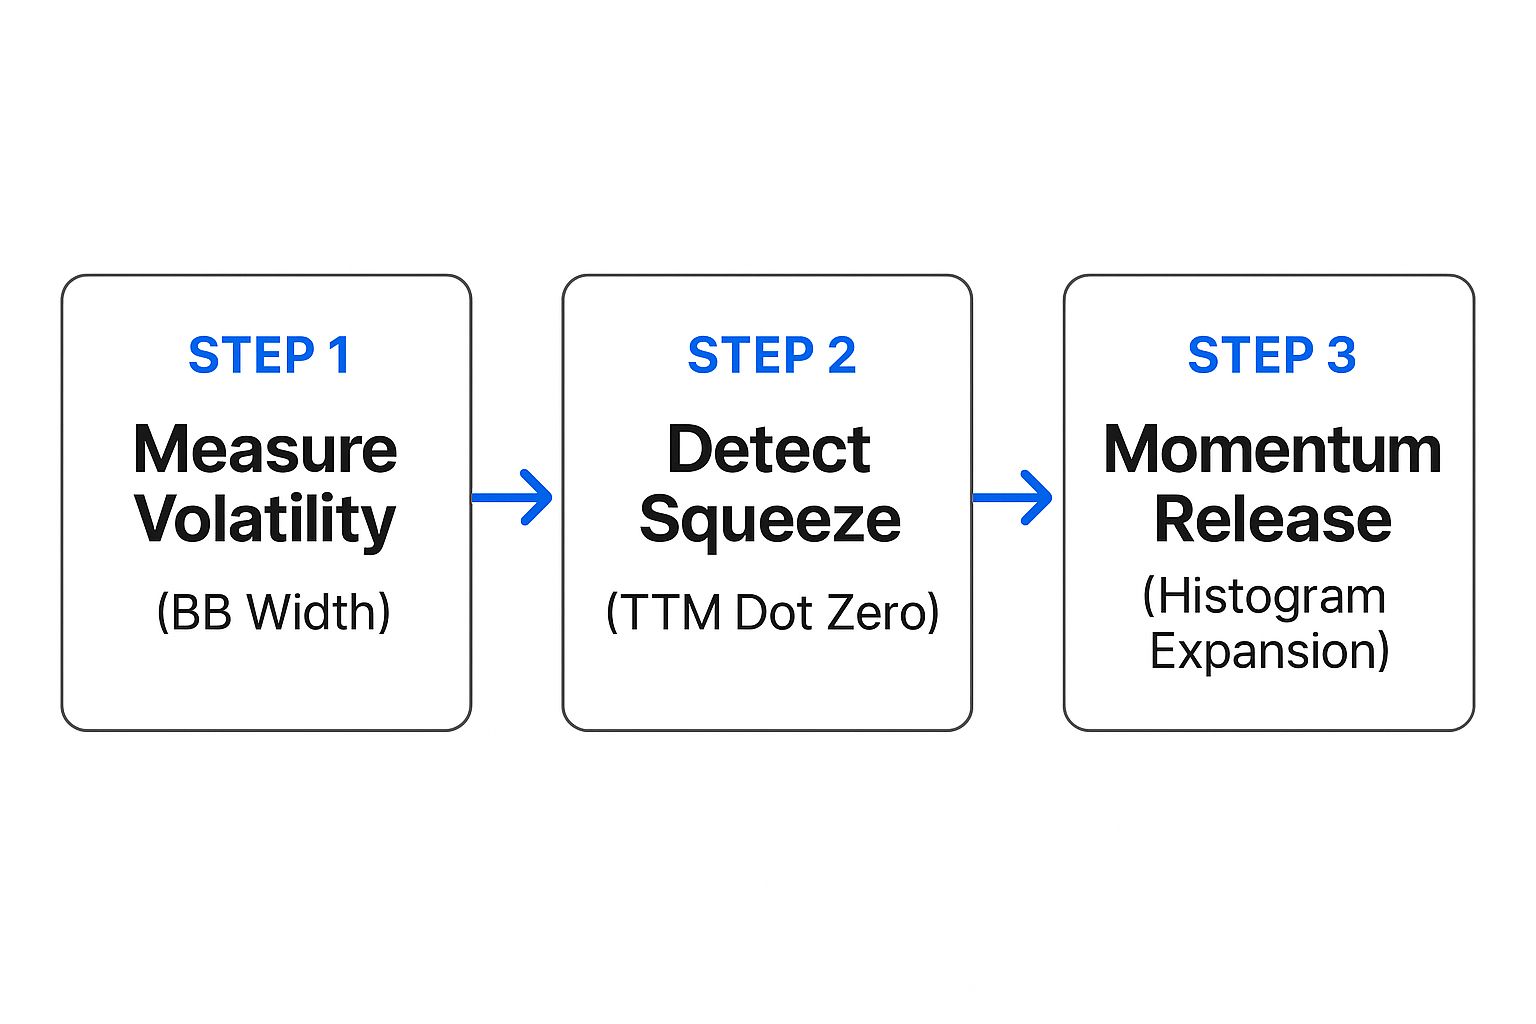
This infographic illustrates the TTM Squeeze's core components:
- Measuring volatility with Bollinger Band width
- Detecting the squeeze (TTM dot hits zero)
- Observing momentum release (histogram expansion)
Together, these steps provide a comprehensive view of potential market movements.
Platform-Specific Optimization
While the principles remain consistent, applying the TTM Squeeze varies across platforms like TradingView, ThinkOrSwim, and MetaTrader.
-
TradingView: Often offers pre-built TTM Squeeze indicators. Look for versions with customizable Bollinger Band and Keltner Channel settings to fine-tune sensitivity to market volatility.
-
ThinkOrSwim: May require a custom study. Reputable scripts are available online or within the ThinkOrSwim community. Prioritize clear visuals and customizable alerts.
-
MetaTrader: You might need to install a custom indicator. Ensure compatibility with your MetaTrader version (MT4 or MT5) for accurate readings.
Parameter Adjustments For Clarity
Default settings are a good starting point, but adjustments can significantly improve effectiveness.
In fast-moving markets, a shorter lookback period for Bollinger Bands (e.g., 10 or 15 periods) may be better. Slower markets might benefit from longer periods (e.g., 25 or 30).
Adjusting the Keltner Channel multiplier filters market noise. A higher multiplier identifies stronger squeezes, while a lower one captures more frequent (but potentially less significant) formations. Backtesting is crucial for finding optimal settings.
To help understand the nuances of parameter adjustments, let's look at recommended settings for different market types. The following table provides a starting point for your own experimentation and backtesting:
TTM Squeeze Parameter Settings by Market Type
| Market Type | Bollinger Band Setting | Keltner Channel Setting | Lookback Period | Best Timeframes |
|---|---|---|---|---|
| Stocks (High Volatility) | 20 periods, 2 standard deviations | 1.5x Average True Range (ATR) | 20 | 5m, 15m, 1h |
| Stocks (Low Volatility) | 30 periods, 2 standard deviations | 2x Average True Range (ATR) | 30 | 1h, 4h, Daily |
| Forex (Major Pairs) | 20 periods, 2 standard deviations | 1.75x Average True Range (ATR) | 20 | 15m, 30m, 1h |
| Forex (Minor Pairs) | 15 periods, 2 standard deviations | 1.5x Average True Range (ATR) | 15 | 5m, 15m, 30m |
| Indices | 25 periods, 2 standard deviations | 2x Average True Range (ATR) | 25 | 1h, 4h, Daily |
This table summarizes recommended TTM Squeeze settings across different market environments. Remember that these are just starting points, and the optimal settings for you will depend on your specific trading style and the markets you trade.
Visual Enhancements For Faster Analysis
Color-coding is essential for quick interpretation. Use contrasting colors for "squeeze on" (compression) and "squeeze off" (release) phases. Bold colors expedite analysis and enable swift reactions.
Decluttering your charts is paramount. Too many indicators create confusion. Use the TTM Squeeze strategically with a few confirming indicators for a clear view of price action. These visual enhancements empower faster, more informed decisions based on market volatility, aiding in spotting opportunities and avoiding misleading signals.
Identifying High-Probability TTM Squeeze Setups
Not all TTM squeezes signal explosive breakouts. This section focuses on identifying the high-probability setups that separate typical compressions from those ready for significant price movements. This requires a nuanced understanding of different squeeze types and the market psychology driving them.
Momentum Squeezes, Velocity Squeezes, and Divergence Squeezes
Beyond basic compression, analyzing the momentum within the squeeze reveals its potential. A momentum squeeze, marked by a rapidly rising or falling histogram on the TTM Squeeze indicator, suggests strong underlying pressure building. This often precedes explosive moves.
Similarly, a velocity squeeze, where the rate of compression accelerates, can indicate an imminent breakout. These setups highlight increasing market urgency, making them appealing to traders.
Furthermore, spotting divergence squeezes can provide valuable insights. Divergence happens when price action and the TTM Squeeze histogram tell different stories. For example, a stock might make lower lows while the histogram makes higher lows. This hidden bullish divergence often precedes a strong reversal. Conversely, bearish divergence can warn of a potential downturn despite apparent strength. You might be interested in: 8 High-Probability Trading Setups To Boost Your Trading.
Distinguishing Weak Squeezes From Powerful Setups
Identifying weak squeezes is as crucial as spotting powerful ones. A weak squeeze usually lacks characteristic momentum or velocity buildup. The histogram might be flat or oscillating aimlessly. These squeezes often lead to minor price fluctuations or false breakouts, frustrating traders. Learning to distinguish these can prevent you from entering low-probability trades.
The TTM Squeeze indicator's effectiveness is often highlighted by statistical performance. The 'Slingshot Squeeze' setup, for example, reportedly boasts a 92% win rate over the past 30 years, with 24 wins and only 2 losses as of 2023. Such statistics illustrate the indicator's potential for accurately identifying breakouts.
While specific results vary based on market conditions and trading choices, these high win rates suggest that the TTM Squeeze is a strong tool when used correctly. Find more detailed statistics here: Slingshot Squeeze Strategy. Combining the TTM Squeeze with other analysis forms is crucial for optimal results.
Precise Entry Timing Techniques
Proper trade entry timing is essential to maximize profits and minimize risk. Experienced traders often use specific entry techniques. Volume confirmation is key. A surge in volume during a breakout from a squeeze strengthens the signal, suggesting conviction.
Validating breakouts with support/resistance levels adds another layer of confidence. A breakout above a key resistance level, or below key support, significantly increases the likelihood of a sustained move.
These entry strategies are essential for accurate timing. Combining them with other technical indicators and a solid understanding of market context can significantly improve your trading effectiveness with the TTM Squeeze indicator.
Proven TTM Squeeze Trading Strategies That Deliver
Let's move beyond the theoretical and explore practical TTM Squeeze trading strategies. These proven approaches cater to various trading styles, from fast-paced day trading to long-term position trading. They provide clear entry and exit rules, allowing you to adapt your strategy based on your personal preferences and risk tolerance.
Day Trading With The TTM Squeeze
The TTM Squeeze presents day traders with rapid entry and exit opportunities. The key is utilizing shorter timeframes, such as the 5-minute or 15-minute charts.
Look for swift compressions (red dots) followed by a quick expansion (green dots), accompanied by a noticeable increase in volume. Your profit targets should be determined by recent volatility, aiming for smaller, quicker gains. Crucially, tight stop-loss orders are vital for protecting your capital in the dynamic day trading arena.
- Entry: Red dots transitioning to green, coupled with increasing volume.
- Exit: Profit target achieved or predetermined time limit.
- Stop-Loss: Positioned just below the squeeze's low.
Swing Trading Using Squeeze Momentum
Swing traders can capitalize on the TTM Squeeze to capture more extensive price movements. Longer timeframes, like the 1-hour or 4-hour charts, are generally more appropriate. Look for robust momentum building within the squeeze, often signaled by a rising histogram on the TradingView indicator. This suggests a higher likelihood of a significant breakout. Remember, your position sizing should reflect the extended holding period, balancing potential profits against inherent risks. When setting up your TTM Squeeze strategy, remember the keywords you are targeting. You may want to focus on short tail vs long tail keywords for optimal search engine visibility.
- Entry: Green dots appearing after an extended squeeze, with increasing histogram values and volume.
- Exit: Momentum stalls or a reversal signal emerges.
- Stop-Loss: Below recent support levels or the swing low.
Position Trading For Long-Term Gains
Position traders can use the TTM Squeeze to pinpoint long-term trends. Daily or weekly charts are the preferred tools for this strategy. The emphasis shifts to identifying major squeezes that align with the prevailing market direction. These opportunities may be less frequent, but they carry the potential for substantial returns. Wider stop-loss orders accommodate the expected market fluctuations over the longer timeframe.
- Entry: Green dots on the daily or weekly chart, confirming the long-term trend.
- Exit: Fundamental shifts or a significant trend reversal.
- Stop-Loss: Below key support levels.
TTM Squeeze Strategy Performance
To help you understand the potential outcomes of each approach, let’s examine a comparison of these TTM Squeeze strategies. The following table offers a general overview of their performance characteristics.
TTM Squeeze Strategy Performance Comparison: Statistical comparison of different TTM Squeeze trading strategies across multiple market conditions.
| Strategy Name | Win Rate | Profit Factor | Average R:R Ratio | Best Market Conditions | Typical Holding Period |
|---|---|---|---|---|---|
| Day Trading Squeeze | Potentially High | Variable | 1:1 to 2:1 | Volatile, Trending | Minutes to Hours |
| Swing Trading Squeeze | Moderate | Potentially High | 2:1 to 5:1 | Trending | Days to Weeks |
| Position Trading Squeeze | Lower | Potentially Very High | 5:1+ | Strong Long-Term Trends | Weeks to Months |
It's important to remember that actual results can vary based on market conditions, individual trading skills, and risk management practices. This table offers hypothetical examples and should not be interpreted as a guarantee of future performance. Thorough backtesting and prudent risk management are critical for success with any trading strategy. Furthermore, combining the TTM Squeeze with other indicators and confirmation tools can enhance its efficacy and potentially improve trading outcomes.
Supercharging Your TTM Squeeze With Confirmation Tools
The TTM Squeeze indicator is a powerful tool on its own, but combining it with other technical analysis tools can significantly boost its effectiveness. This is exactly how experienced traders build robust, high-conviction trading strategies. By adding confirming signals, you can weed out false breakouts and spot the most promising opportunities.
Momentum Indicators: Validating Squeeze Signals
Momentum indicators like the Relative Strength Index (RSI), Moving Average Convergence Divergence (MACD), and various momentum oscillators offer valuable confirmation for TTM Squeeze signals. For example, if the TTM Squeeze indicates a compression (red dots) and the RSI shows oversold conditions, it increases the likelihood of an upward breakout. Learn more in our article about How to Master the MACD Indicator.
Conversely, if the squeeze is releasing (green dots) but the MACD is showing bearish divergence, it's a sign to proceed with caution. The breakout might be weak or unsustainable. Knowing how to interpret both confirming and conflicting readings from these momentum tools is key to maximizing accuracy.
The Critical Role of Volume
Volume indicators are essential for confirming the strength of breakouts. A surge in volume as the TTM Squeeze releases validates strong interest and makes a sustained price move more likely. Low volume during a breakout, however, points to weak conviction and a higher risk of a false start.
Specific volume patterns, like increasing volume during the compression phase, can often precede major price moves. By watching these patterns, you can better predict the potential strength of the impending breakout. This allows for better position sizing and more effective risk management.
Integrating Price Action Techniques
Combining the TTM Squeeze with price action techniques like support/resistance levels, trend analysis, and chart patterns adds another layer of analysis to your trading approach. A squeeze releasing near a key support level, for instance, makes a bounce more likely. Likewise, a squeeze breakout happening at the same time as a bullish chart pattern, such as a head and shoulders bottom, strengthens the signal.
By integrating these elements, you’re not just relying on one indicator but on a comprehensive view of the market. This approach can substantially improve your trading decisions and help you avoid low-probability setups.

This chart shows a real-world trading opportunity using the combined power of the TTM Squeeze, RSI, and volume. The squeeze triggered just as the RSI dipped into oversold territory, followed by a rise in volume on the breakout, confirming the move. These combined signals provided a high-conviction entry point, demonstrating the effectiveness of a multi-indicator approach. Using multiple indicators allows for a more detailed and accurate understanding of market conditions, leading to improved trading decisions.
TTM Squeeze Performance Across Market Conditions
The TTM Squeeze indicator doesn't perform equally in all market environments. Understanding its behavior during different market conditions—bull markets, bear markets, and sideways consolidations—is crucial for maximizing its effectiveness. This involves analyzing historical performance during key market events and across various asset classes.
TTM Squeeze in Bull Markets
During bull markets, the TTM Squeeze can effectively identify periods of consolidation before continuation moves higher. As prices trend upwards, periods of reduced volatility (indicated by the squeeze) often precede further rallies. These squeezes act as launchpads for the next leg up in a bull run.
However, it's important to note that not every squeeze during a bull market will result in a substantial move upwards. False breakouts can occur. Therefore, combining the TTM Squeeze with other confirming indicators and trend analysis remains vital.
TTM Squeeze in Bear Markets
In bear markets, the TTM Squeeze can be equally insightful, but with a different focus. Look for squeezes that precede breakdowns to lower levels. These periods of reduced volatility can be misleading, masking the underlying selling pressure.
When the squeeze “releases” in a bear market, it often confirms further downside momentum. This insight allows traders to anticipate potential shorting opportunities or avoid entering long positions prematurely.
TTM Squeeze During Sideways Consolidations
Sideways markets represent the most challenging environment for the TTM Squeeze. During these periods, the indicator can generate numerous false signals, leading to whipsaws and frustrating losses. This is because the underlying market lacks a clear directional bias, and breakouts from the squeeze are often short-lived and unreliable.
In these conditions, it becomes even more crucial to incorporate additional confirmation tools like investment research tools and rely less on the TTM Squeeze alone.
Asset Class Performance
The effectiveness of the TTM Squeeze varies across different asset classes. While it's commonly applied to individual stocks, it can also be used with sector ETFs, forex pairs, commodities, and even cryptocurrencies. However, each asset class has unique volatility characteristics and trading dynamics.
- Stocks and ETFs: Generally respond well to the TTM Squeeze, particularly in trending markets.
- Forex: Can be effective for identifying breakouts, especially in major currency pairs.
- Commodities and Cryptocurrencies: Due to their higher volatility, these markets require careful parameter adjustments and additional confirmation for accurate signals.
Understanding these nuances helps determine which markets offer the most predictable responses to the TTM Squeeze formations and when supplementary confirmation is essential. Historically, the TTM Squeeze indicator has grown in popularity among traders due to its ability to provide early signals for potential breakouts. The indicator uses Bollinger Bands and Keltner Channels to measure volatility and identify ‘squeeze’ periods, allowing traders to anticipate price movements with some certainty.
Historical data has shown that during periods of low volatility, the likelihood of a significant price breakout is higher. For example, during market downturns, traders using the TTM Squeeze could potentially identify opportunities for rebound trades or strong trend reversals. The indicator's versatility and use within a broader trading strategy make it a valuable tool, especially during times of high market uncertainty. Learn more about the squeeze indicator here: TTM Squeeze Indicator.
Backtesting Methodologies
For systematic traders, robust backtesting is crucial for evaluating the TTM Squeeze. It’s important to select appropriate backtesting methodologies that avoid common statistical errors. Look for strategies that properly account for slippage, commissions, and realistic market conditions.
By carefully analyzing historical performance, traders can fine-tune their approach and increase their confidence in the indicator's reliability. This analysis can help identify specific market environments where the indicator excels and where additional confirmation tools are necessary.
Transforming Your Trading With TTM Squeeze Mastery
The TTM Squeeze indicator offers valuable insights into market volatility and potential breakouts. However, simply recognizing squeezes isn’t enough. Transforming your trading requires integrating the TTM Squeeze into a structured decision-making framework. This involves shifting from mechanically following rules to developing an intuitive understanding of the indicator and its nuances.
Building a Structured Decision Framework
Successful traders don’t just react to signals; they build strategies around them. This means understanding the context of the squeeze. What’s the overall market trend? Are there any relevant news or economic events? How does the squeeze align with other technical indicators like RSI, MACD, and volume analysis? These questions help you create a comprehensive view of the market, turning the TTM Squeeze into a powerful decision-making tool.
-
Market Context: Consider the broader market trends and the specific asset you’re trading. A squeeze during a strong uptrend is likely to have different implications than one during a downtrend.
-
Confirmation Tools: Combining the TTM Squeeze with other indicators significantly strengthens your conviction.
-
Risk Management: Define your risk tolerance and stick to it. This includes setting stop-loss orders and position sizing appropriately for each trade.
Practice Techniques for Pattern Recognition
Just like any skill, mastering the TTM Squeeze requires practice. Regularly review historical charts, identifying past squeezes and their outcomes. This helps you develop an intuitive understanding of how the indicator behaves in different market conditions.
-
Chart Review: Analyze past squeezes and observe the price action that followed. Did the breakout materialize as expected? What other indicators confirmed or invalidated the signal?
-
Simulated Trading: Test your TTM Squeeze strategies in a simulated trading environment. This allows you to refine your approach without risking real capital.
-
Journaling: Keep a trading journal to track your TTM Squeeze trades. This helps identify patterns in your successes and failures, leading to continuous improvement.
Overcoming Psychological Traps
Trading psychology plays a significant role in your success. Fear, greed, and impatience can undermine even the best-laid plans. Specifically, in squeeze trading, the temptation to enter too early or exit too late can be costly.
-
Patience: Avoid jumping into trades before the squeeze fully develops. Wait for confirmation from other indicators and volume analysis.
-
Discipline: Stick to your trading plan and avoid emotional decisions. This means honoring your stop-loss orders and taking profits when your targets are met.
-
Objectivity: Analyze your trades objectively, learning from both wins and losses. Don’t let emotions cloud your judgment or prevent you from identifying areas for improvement.
Progressive Steps for All Experience Levels
Whether you're a beginner or an experienced trader, the TTM Squeeze can be integrated into your trading strategy.
-
Beginners: Focus on mastering the basics of the indicator. Learn how to identify squeezes, confirm breakouts, and manage risk. Start with smaller positions and gradually increase your exposure as you gain confidence.
-
Intermediate Traders: Explore different TTM Squeeze strategies, incorporating confirmation tools and advanced risk management techniques. Experiment with various timeframes and asset classes to find the best fit for your trading style.
-
Advanced Traders: Fine-tune your existing strategies with the TTM Squeeze, optimizing your entry and exit points. Develop customized setups based on market conditions and specific asset characteristics.
By understanding these principles and incorporating them into your trading, you can transform your approach and potentially achieve greater success in the market.
Ready to elevate your trading with powerful charting and scanning tools? ChartsWatcher offers professional-grade features to help you identify high-probability trading setups, including customized alerts, multiple screen configurations, and seamless integration with key technical indicators. Visit ChartsWatcher today to explore our platform and discover how it can enhance your trading performance.
