How to Read MACD Indicator: Master Trading Signals
Decoding MACD Fundamentals: What Successful Traders Know
The Moving Average Convergence Divergence (MACD) indicator is a cornerstone of technical analysis. It provides traders with valuable insights into market momentum by comparing two exponential moving averages (EMAs). This seemingly simple tool can reveal a surprising amount of information about the underlying forces driving price action.
Understanding the Building Blocks: MACD Line, Signal Line, and Histogram
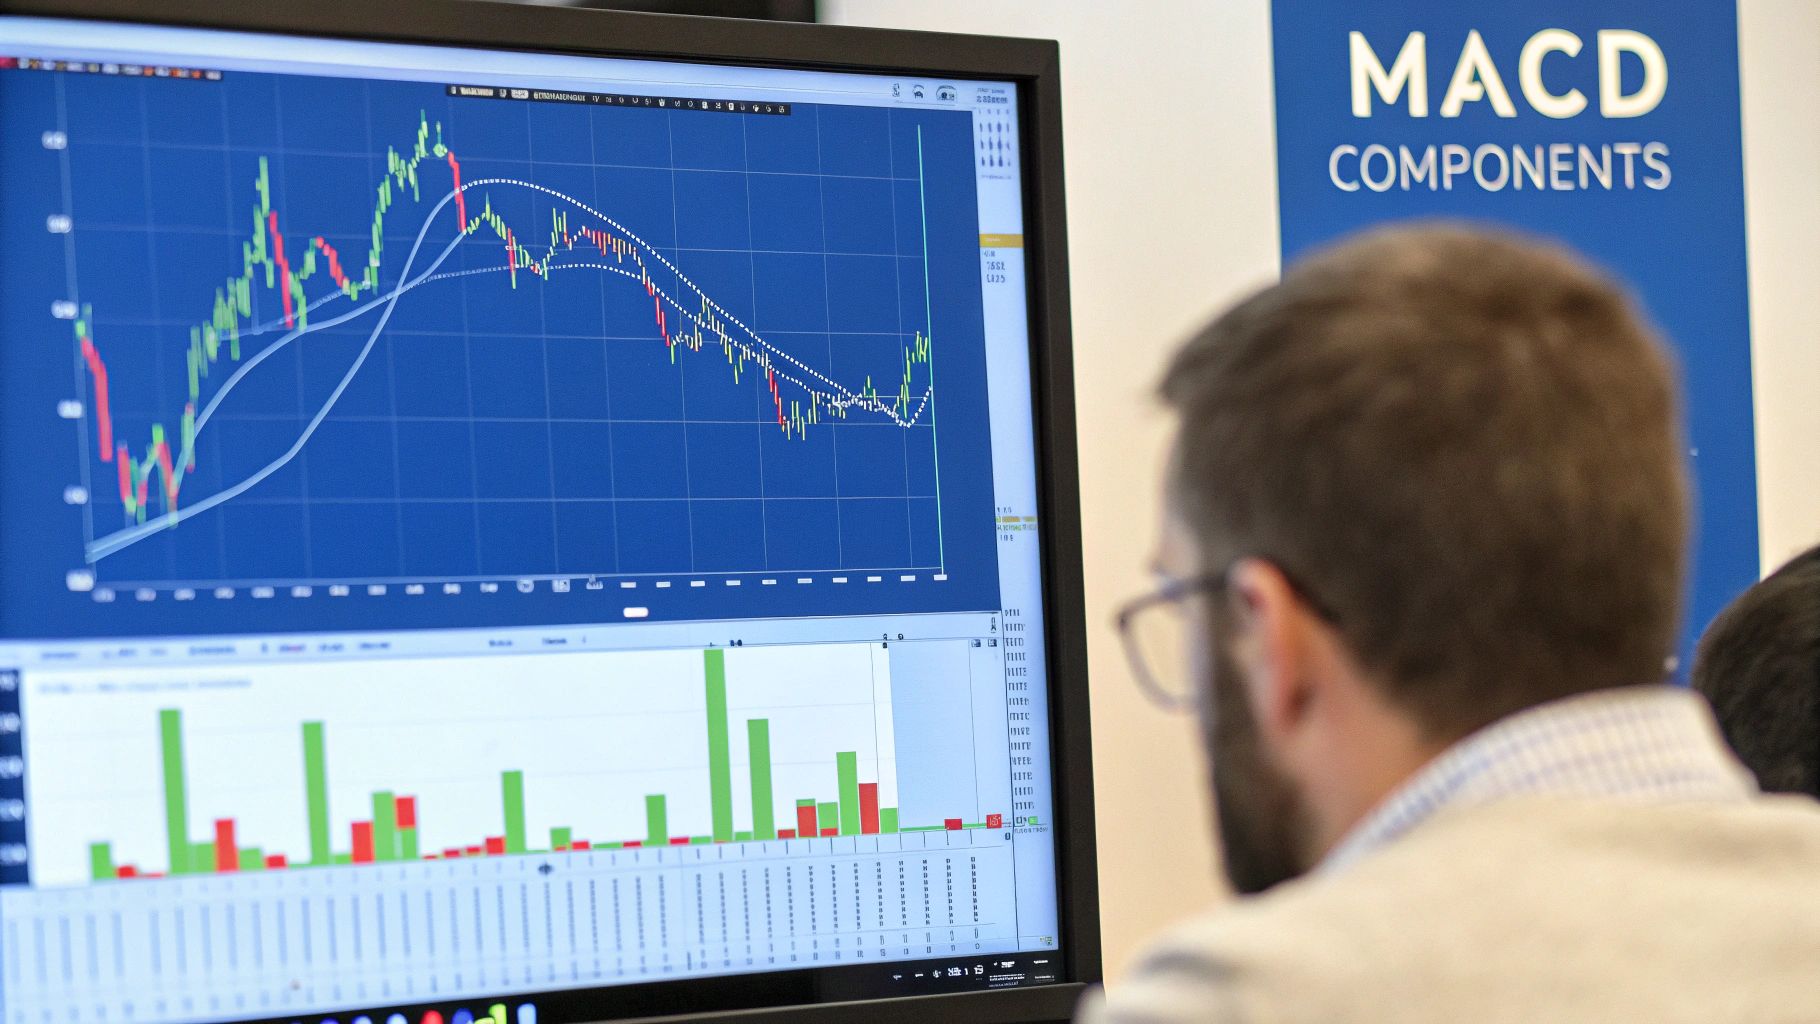
The MACD indicator comprises three key elements. These elements work in concert to provide a comprehensive picture of market momentum.
First, the MACD line is calculated by subtracting the 26-period EMA from the 12-period EMA. This line forms the basis of the indicator, reflecting the difference in momentum between these two timeframes.
Second, the signal line is a 9-period EMA of the MACD line. It acts as a smoother, slower-moving counterpart. Crossovers between the MACD line and the signal line often generate trading signals.
Finally, the histogram visually displays the difference between the MACD line and the signal line, offering a clear view of increasing or decreasing momentum.
To fully understand the MACD indicator, exploring the underlying data can be very helpful. More information on data analysis can be found in this article on Twitter Analytics. Remember, these MACD components are interconnected. They should be interpreted together, not individually. For instance, a bullish crossover (where the MACD line crosses above the signal line) gains strength when accompanied by a growing positive histogram. This combination suggests a surge in upward momentum.
Unveiling the Power of MACD: Momentum and Market Psychology
The MACD's power stems from its ability to capture shifts in market psychology. When the shorter-term 12-period EMA moves above the longer-term 26-period EMA, it suggests recent price action has been stronger. This often indicates growing bullish sentiment. Conversely, a bearish crossover, where the 12-period EMA falls below the 26-period EMA, can reflect weakening momentum and potential selling pressure.
The MACD is a lagging indicator. It reflects past price action, not future movements. The MACD indicator has historically been effective in various markets, including stocks and commodities. Its historical success rate in stock indices is reportedly around 81.41%, with a profit factor of 1.51. This suggests moderate success, attributed to the MACD's ability to identify momentum shifts, making it useful for trend-following strategies. For example, a backtest on the S&P 500 using a MACD strategy yielded a CAGR of 4.19%, an average gain per trade of 0.44%, and a maximum drawdown of 30%. More detailed statistics can be found here. You might also be interested in this article: How to master the MACD trading indicator. It's always wise to confirm MACD signals with other technical indicators and price action analysis.
Mastering MACD Crossovers: Entry and Exit Strategies
Understanding the basic components of the MACD (Moving Average Convergence Divergence) is just the first step. The true strength of this indicator lies in interpreting and acting on MACD crossovers. These crucial trading signals are generated by the interaction between the MACD line and the signal line. This section explores how seasoned traders use these crossovers to create effective entry and exit strategies.
Identifying Bullish and Bearish Crossovers
A bullish crossover happens when the MACD line rises above the signal line. This suggests growing upward momentum and often indicates a potential buying opportunity. For instance, if the MACD line has been below the signal line and then crosses above it, this can signal a shift from bearish to bullish sentiment.
A bearish crossover, on the other hand, occurs when the MACD line falls below the signal line. This indicates weakening upward momentum or a potential shift to downward momentum, which could signal a selling opportunity. This crossover can warn that an existing uptrend may be losing strength.
Confirming Crossovers for Higher Probability Trades
MACD crossovers can be strong signals, but confirming them with other indicators and considering the overall market context is essential to avoid false signals. The crossover technique is a core MACD strategy. Traders buy when the MACD line crosses above the signal line and sell when it crosses below. This approach can be particularly effective in capturing shifts in market momentum.
For example, when applied to cryptocurrencies like Bitcoin, the MACD can help identify major price swings. However, it's worth noting that its success in the crypto market has been moderate, potentially due to the lack of mean reversion in cryptocurrencies.
The histogram, which reflects the difference between the MACD line and its signal line, adds another layer of analysis. Backtests indicate the histogram is profitable roughly 70% of the time in mean-reverting markets. Learn more about MACD trading strategies. For more advanced techniques, check out this resource on mastering MACD trading strategies.
Timing Entries and Exits with MACD Crossovers
Precisely timing entries and exits is crucial to maximize gains and minimize losses. A popular strategy is to enter a long position soon after a confirmed bullish crossover, placing a stop-loss order below the recent low to protect capital if the trade goes south.
For a bearish crossover, traders might enter a short position shortly after confirmation, with a stop-loss order above the recent high. This helps limit potential losses if the price unexpectedly increases. Disciplined entry and exit strategies are vital for successful MACD trading. Consistent application takes practice and experience, but the potential profits can be substantial.
Reading the MACD Histogram: The Overlooked Edge
While many traders focus on MACD crossovers, the histogram offers a unique advantage: anticipating market moves. This often-misunderstood component visualizes momentum shifts before major price movements happen. Understanding how to read the MACD histogram can provide a crucial timing advantage.
Deciphering the Histogram's Secrets
The MACD histogram isn't simply a visual representation of the distance between the MACD and signal lines. It's a dynamic tool revealing the strength and direction of momentum. This allows for a more nuanced understanding of potential market movements than crossovers alone. Subtle changes in histogram height, direction, and pattern formations can act as early warning signals. For example, a lengthening histogram suggests strengthening momentum, while a shortening histogram indicates weakening momentum.
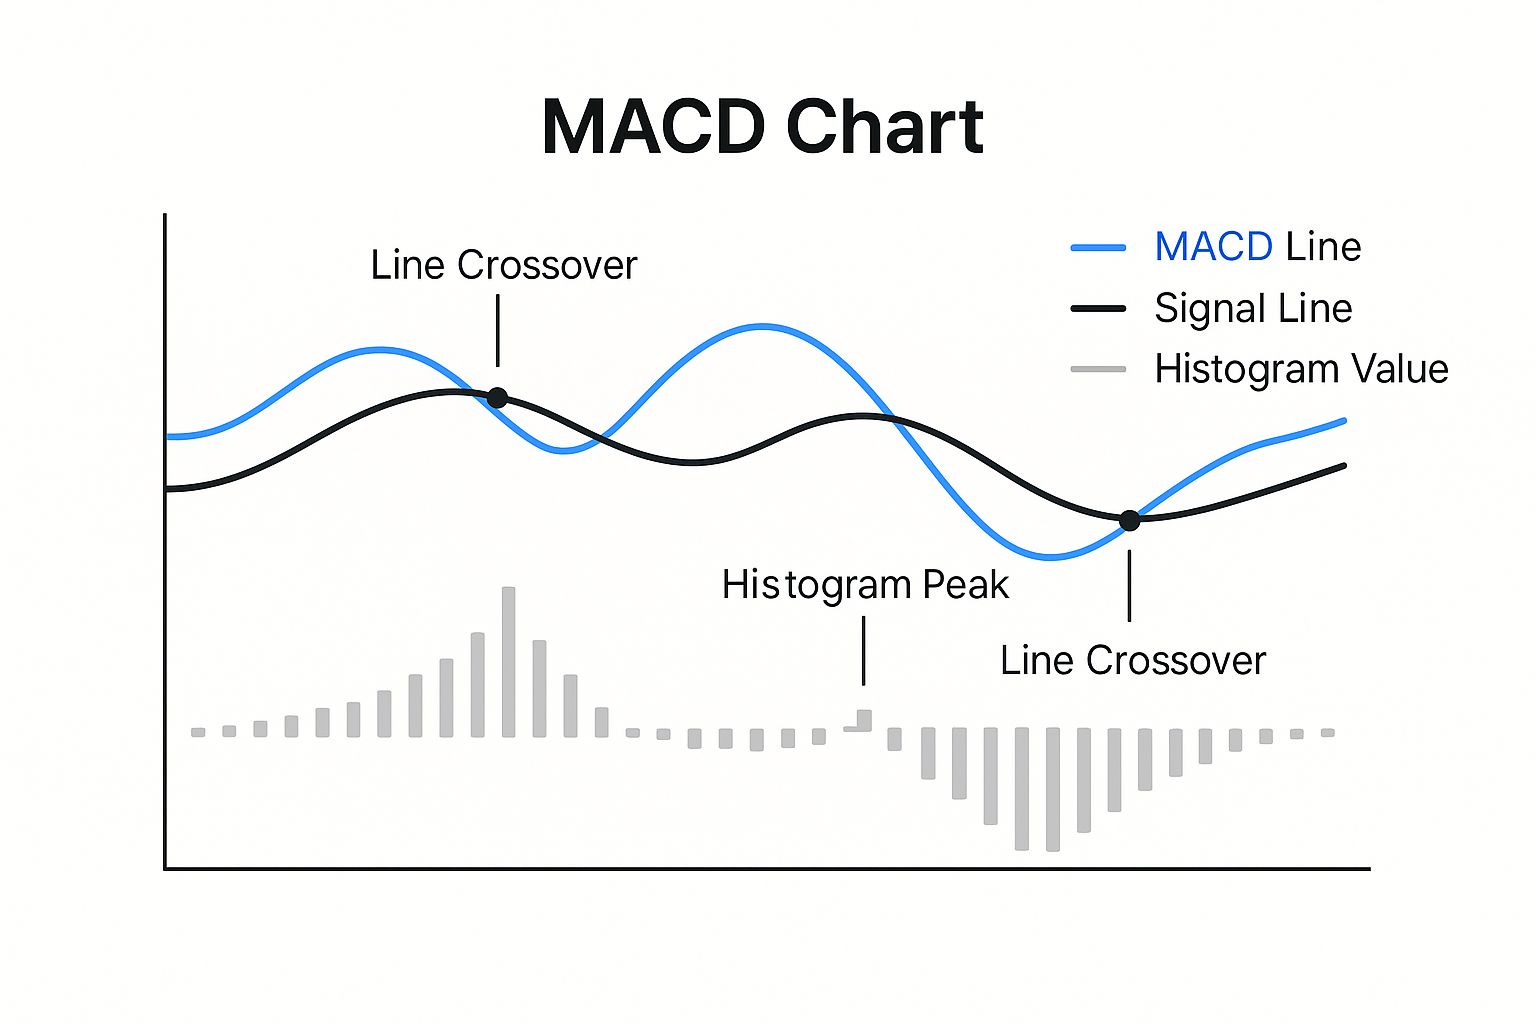
As shown in the infographic, histogram peaks often precede MACD line crossovers. This means that by analyzing the histogram, traders can potentially anticipate these crossovers and enter or exit trades earlier.
Identifying Significant Histogram Patterns
Learning to differentiate between minor histogram fluctuations and significant patterns is essential. These patterns often signal genuine trading opportunities. This provides an edge over those relying solely on standard MACD signals. Understanding the context of the histogram’s movements relative to price action and overall market trends is key.
- Increasing Histogram Height: This signals strengthening momentum, regardless of the histogram's position relative to zero.
- Decreasing Histogram Height: This indicates weakening momentum, regardless of the histogram's position relative to zero.
- Histogram Zero Line Crossover: Similar to MACD line crossovers, the histogram crossing the zero line can signal a potential shift in momentum.
To further illustrate these patterns, let's look at the following table:
MACD Histogram Patterns and Their Interpretations: This table outlines common MACD histogram patterns and what they suggest about potential market movements
| Histogram Pattern | What It Shows | Suggested Market Action | Reliability Rating |
|---|---|---|---|
| Increasing Height (Above Zero) | Strong upward momentum | Consider buying or holding long positions | High |
| Increasing Height (Below Zero) | Strong downward momentum | Consider selling or holding short positions | High |
| Decreasing Height (Above Zero) | Weakening upward momentum | Consider taking profits on long positions or tightening stops | Medium |
| Decreasing Height (Below Zero) | Weakening downward momentum | Consider taking profits on short positions or tightening stops | Medium |
| Zero Line Crossover (Positive) | Potential shift from bearish to bullish momentum | Consider entering long positions | Medium |
| Zero Line Crossover (Negative) | Potential shift from bullish to bearish momentum | Consider entering short positions | Medium |
As this table shows, the MACD histogram can offer valuable insights into market momentum. While not foolproof, understanding these patterns can enhance trading decisions.
Using the Histogram for Early Entry and Exit
By analyzing the histogram, traders can potentially anticipate crossovers and identify divergences between price and momentum. This enables earlier entries and exits. For instance, if the price makes new highs but the histogram makes lower highs, this bearish divergence can signal an impending downturn. Conversely, higher lows on the histogram while the price makes new lows (a bullish divergence) may signal a potential price bottom. This proactive approach helps traders capitalize on opportunities and manage risk more effectively.
Spotting Powerful MACD Divergence Patterns
Divergence patterns are some of the most reliable signals provided by the MACD indicator. They offer early warnings of potential market reversals, even before price action confirms them. This knowledge gives traders a significant edge.
Understanding MACD Divergence
MACD divergence happens when an asset's price moves in one direction, while the MACD indicator moves in the opposite. This difference suggests the current trend is weakening and might reverse. This signal can alert traders to potential shifts in market sentiment before the price changes.
There are two main types of divergence: bullish divergence and bearish divergence.
-
Bullish Divergence: This occurs when the price creates lower lows, but the MACD forms higher lows. This difference suggests weakening downward momentum, despite the falling price, and hints at a potential upward reversal. Think of it like a car slowing down before turning.
-
Bearish Divergence: This occurs when the price makes higher highs, but the MACD makes lower highs. This suggests weakening upward momentum, despite the rising price, and hints at a potential downward reversal. Imagine a ball tossed upward; it reaches lower heights before falling.
Identifying True Divergence vs. False Signals
Not every opposing movement between price and MACD indicates true divergence. Identifying real divergence requires careful study. For example, short-term divergence during a strong trend could simply be a minor pullback, not a major reversal.
-
Look for sustained divergence: One instance of opposite movement might not be significant. Look for multiple highs or lows diverging between price and MACD. This strengthens the signal's reliability.
-
Consider the timeframe: Divergences on longer timeframes, like daily or weekly charts, tend to be more reliable than those on shorter timeframes, like a 5-minute chart.
-
Confirm with other indicators: Using the MACD with other technical indicators like the RSI can help confirm divergence signals. If the RSI shows oversold conditions during bullish divergence, it reinforces the potential for a reversal.
Utilizing Divergence for Effective Trading
MACD divergence can be helpful for both entries and exits. But, it’s not a stand-alone predictor and should be part of a larger trading plan.
-
Entry signals: Bullish divergence can signal a buying opportunity, while bearish divergence can signal a short-selling opportunity. Always wait for confirmation from price action before entering.
-
Exit signals: Divergence can warn traders to exit positions. Bearish divergence during a long trade could be a good time to take profit or cut losses. Bullish divergence during a short trade might signal time to cover the position.
By understanding and correctly identifying MACD divergence, traders gain valuable insights into market dynamics and improve their decisions. This can lead to more profitable trades and better risk management.
Customizing MACD Settings for Your Trading Style
The standard 12, 26, 9 MACD settings are a popular starting point, but they might not be the best fit for everyone. Experienced traders often tweak these parameters—the periods for the fast and slow Exponential Moving Averages (EMAs) and the signal line—to refine the indicator for their specific market and strategy. This customization allows for adjusting the indicator's sensitivity to price changes.
How Adjusting EMA Periods Affects Signal Generation
Changing the EMA periods directly impacts how quickly the MACD reacts to price fluctuations. Shorter periods, such as a 5, 13, 6 setting, create a more responsive MACD, generating signals faster.
This responsiveness is valuable for day traders who need to react to rapid price swings. However, faster settings can also lead to more false signals, where the MACD reacts to market noise rather than significant trends.
Longer EMA periods, like 21, 50, 9, result in a slower, smoother MACD. This is generally preferred by swing traders or long-term investors who are less concerned with short-term volatility.
While longer periods offer more reliable signals in trending markets, they might also mean missing opportunities in choppy or sideways markets.
Optimizing MACD for Different Trading Styles
The best MACD settings depend on individual trading styles and current market conditions. Active day traders, for example, often prefer faster settings to capitalize on intraday price movements. This allows them to react quickly, entering and exiting trades frequently.
Swing traders, however, usually benefit from slower settings to reduce false signals. They might use settings like 8, 21, 5 to capture longer-term price swings, holding positions for days or weeks.
Market-Specific MACD Optimizations
Different markets have different volatility profiles. This means the ideal MACD settings can vary depending on whether you're trading stocks, forex, cryptocurrencies, or commodities. For instance, the cryptocurrency market often requires slower MACD settings to filter out noise compared to the relatively stable stock market.
To help illustrate how various markets and timeframes influence the selection of MACD parameters, consider the following table:
Recommended MACD Settings by Market and Timeframe This table provides optimized MACD parameter settings for different markets and trading timeframes based on historical performance.
| Market | Timeframe | Fast EMA | Slow EMA | Signal Line | Notes |
|---|---|---|---|---|---|
| Stocks | Daily | 12 | 26 | 9 | Standard setting for general trend analysis |
| Forex | Hourly | 5 | 13 | 6 | Faster setting for active trading |
| Crypto | Daily | 8 | 21 | 5 | Moderate setting to balance responsiveness and signal reliability |
| Commodities | Weekly | 21 | 50 | 9 | Slower setting for longer-term trend following |
As you can see, each market and timeframe benefits from a slightly different configuration. Experimenting with different MACD settings and backtesting them on historical data can help you determine the most effective approach for your specific strategy and target market.
Fine-tuning your MACD settings can significantly improve your trading performance. Remember to combine customized MACD settings with other indicators and price action analysis for a comprehensive market view.
Avoiding Critical MACD Interpretation Mistakes
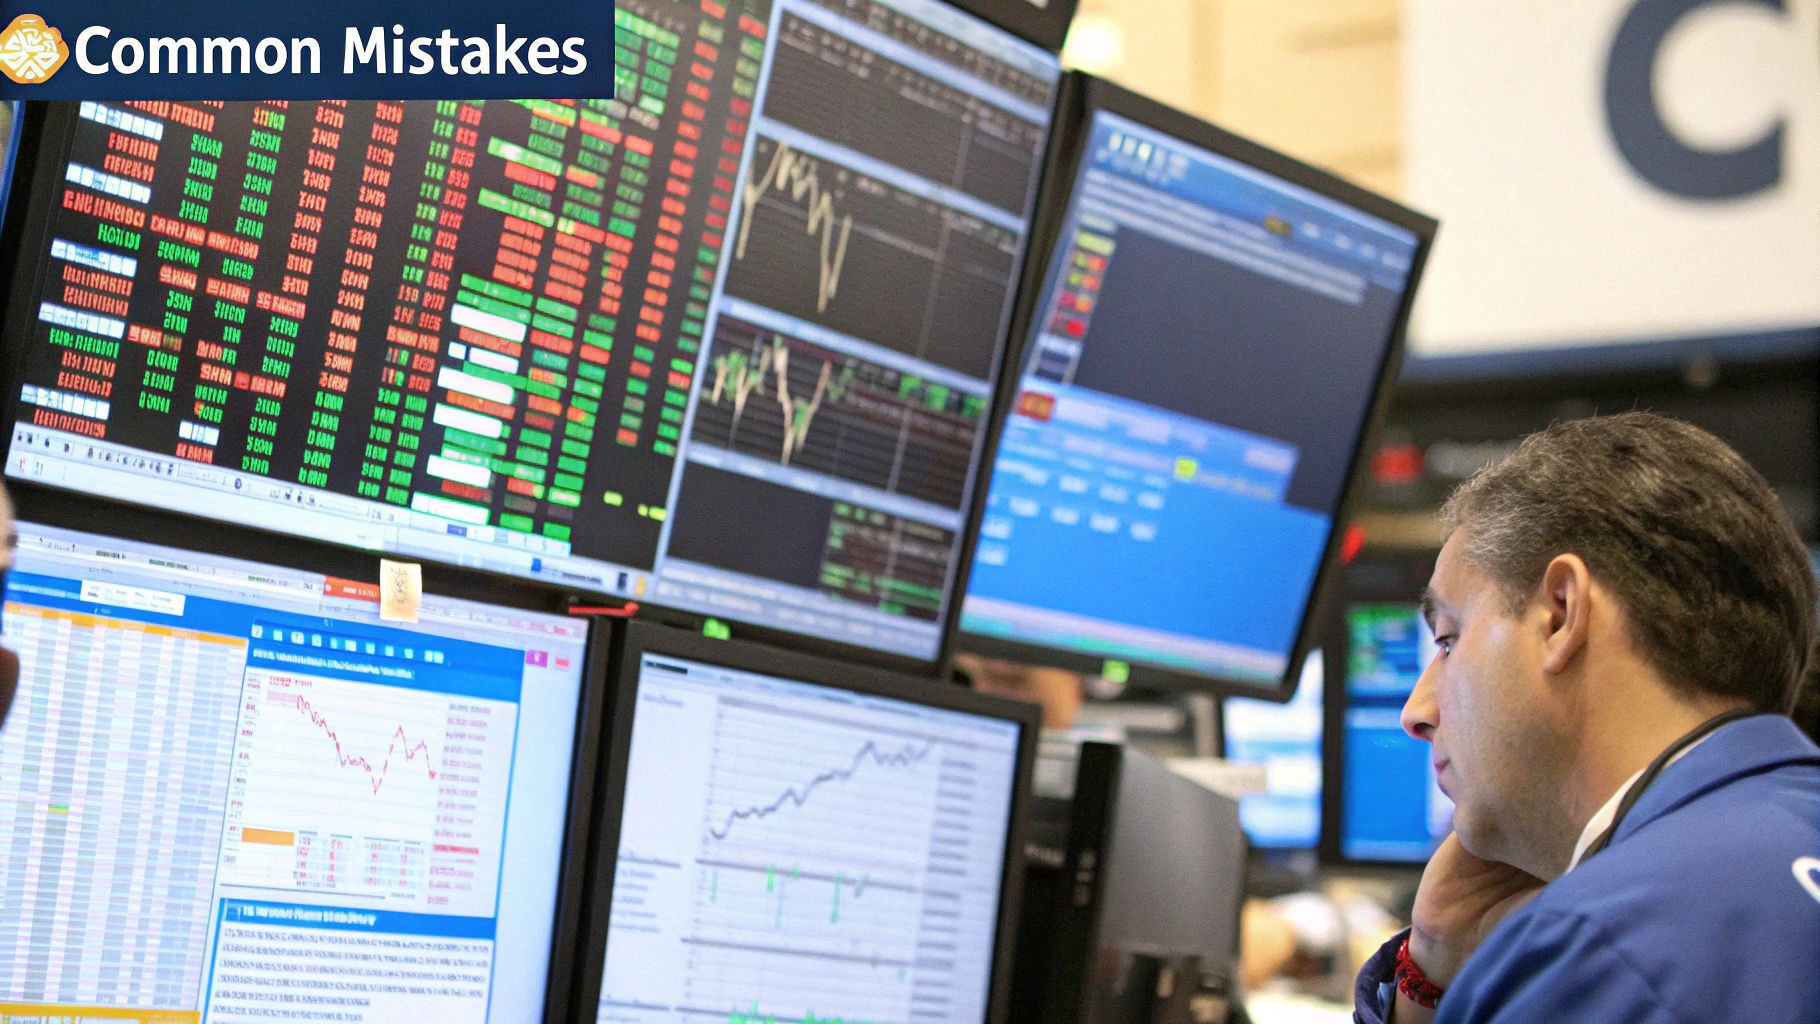
Even seasoned traders sometimes stumble when interpreting the Moving Average Convergence Divergence (MACD) indicator. These missteps can significantly impact trading performance. This section exposes common pitfalls and offers strategies to avoid them, drawing on wisdom from experienced traders.
The Danger of Overtrading Minor Crossovers
One of the most frequent MACD mistakes is overtrading minor crossovers. New traders are often tempted to jump into trades every time the MACD line crosses the signal line. However, not all crossovers are created equal.
Many are simply “noise” caused by short-term price fluctuations. Constantly reacting to these minor crossovers can lead to a string of small losses that quickly deplete an account.
To avoid this trap, focus on crossovers that occur after a period of consolidation or a pullback within a larger trend. These crossovers are more likely to signify a genuine shift in momentum. Additionally, consider using other indicators to confirm the MACD signal before entering a trade.
The Importance of Market Context
Another common mistake is ignoring market context. The MACD, like any indicator, should not be interpreted in isolation. A bullish crossover might be a strong buy signal in an uptrending market, but it could be a false signal in a downtrend or a sideways market. Always consider the broader market environment before acting on a MACD signal.
For example, a bullish divergence between the price and MACD during a downtrend is a more powerful signal than a bullish crossover occurring during a period of market indecision. Some traders use AI trading bots for automated trading strategies.
Why Single-Indicator Trading Is a Recipe for Disaster
Relying solely on the MACD indicator for trading decisions is a risky strategy. No single indicator can perfectly predict market movements. The MACD, while effective, has its limitations.
Using it in conjunction with other technical tools, such as price action analysis, trend lines, and volume indicators, can provide a more comprehensive view of the market and help filter out false signals.
Techniques for Reducing False Signals
Filtering out false signals is crucial for profitable MACD trading. Here are a few effective techniques:
- Higher Timeframes: MACD signals on higher timeframes (e.g., daily or weekly charts) are generally more reliable.
- Confirmation from Other Indicators: Look for confluence with other indicators like the Relative Strength Index (RSI) or stochastic oscillator before entering a trade.
- Price Action Confirmation: Wait for the price to confirm the MACD signal. For example, after a bullish crossover, wait for the price to break above a key resistance level before buying.
Multi-Indicator Frameworks for a More Robust Approach
Combining the MACD with other indicators creates a more robust trading approach. Here's a sample framework:
- Trend Identification: Use a long-term moving average (e.g., 200-day MA) to identify the overall trend.
- Momentum Confirmation: Use the MACD to confirm momentum shifts within the identified trend.
- Entry/Exit Signals: Use a faster indicator like the stochastic oscillator to generate specific entry and exit signals.
By avoiding these common MACD interpretation mistakes and incorporating the strategies outlined above, traders can significantly improve their ability to read the MACD indicator accurately and make more informed trading decisions. You can explore advanced charting and scanning tools at ChartsWatcher.
