Master the Directional Movement Index Indicator
The Directional Movement Index (or DMI) is a classic technical analysis tool that pulls back the curtain on a market's trend, measuring both its direction and its strength. It’s made up of three separate lines that work together: the Positive Directional Indicator (+DI), the Negative Directional Indicator (-DI), and the Average Directional Index (ADX). By reading these three lines in combination, traders get a much clearer picture of whether a stock is actually trending and just how powerful that move really is.
What Is the Directional Movement Index Indicator

Picture yourself trying to navigate a ship on the open ocean. To get anywhere, you need to know two crucial things: which direction you’re heading and how strong the current is. The DMI provides this exact kind of insight for the financial markets. It doesn’t just tell you if the market is heading "up" or "down"; it tells you if you're just drifting sideways or being pushed by a powerful, undeniable force.
This brilliant tool was developed by the legendary J. Welles Wilder Jr. to help traders answer two of the most fundamental questions in trading:
- Is the market actually in a trend right now?
- If it is, how much real conviction is behind that move?
Getting these answers right is critical. Trend-following strategies are incredibly profitable in strong currents but get absolutely shredded in calm, choppy waters. The DMI gives you a way to tell the difference, helping you stay out of messy markets and capitalize on clear momentum.
The Three Lines of the DMI Indicator
The DMI indicator is built from three distinct components, each telling a different part of the market’s story. You need to listen to all three to get the full picture.
Here’s a quick breakdown of what each line represents:
The Three Lines of the DMI Indicator
| Component | Represents | Primary Role |
|---|---|---|
| +DI (Positive Directional Indicator) | Upward Price Movement | Shows the strength of the buyers. A rising +DI means bulls are gaining control. |
| -DI (Negative Directional Indicator) | Downward Price Movement | Shows the strength of the sellers. A rising -DI means bears are taking over. |
| ADX (Average Directional Index) | Overall Trend Strength | Measures the intensity of the trend, regardless of direction. A rising ADX signals a strong, decisive trend (either up or down). |
Think of the +DI and -DI as the voices of the buyers and sellers, respectively. The ADX, on the other hand, is like the volume knob for their conversation. It doesn’t care who is winning—it just tells you how loud and energetic the argument is.
The core idea is simple: When one voice (+DI or -DI) is clearly stronger than the other and the overall volume (ADX) is turned up, you've got a tradable trend. If the voices are jumbled together and the volume is low, the market is probably just chopping around.
Wilder first introduced the directional movement index indicator in his 1978 book, New Concepts in Technical Trading Systems, and it quickly became a go-to tool for traders in stocks, forex, and commodities. His original recommendation of using a 14-period lookback remains the industry standard today, a testament to how robust his methodology is. If you're interested in its roots, you can learn about the DMI indicator's history and widespread adoption.
How the DMI Turns Raw Price Action into Usable Insight
To really get a feel for the Directional Movement Index, you need to pop the hood and see how it works. While the math might look a little intense at first glance, the logic behind it is actually quite simple. It’s a step-by-step process that takes messy price action and turns it into a clear story about market direction and strength.
At its heart, the DMI starts by asking one basic question: "Is today's price range pushing higher or lower than yesterday's?" It gets the answer by calculating Directional Movement (+DM and -DM). You can think of this as the indicator’s raw data collection phase.
- Positive Directional Movement (+DM) gets logged when the current high pokes above the previous high. This value captures the upward thrust.
- Negative Directional Movement (-DM) is recorded when the current low drops below the previous low, representing the downward pressure.
What if the price moves both higher and lower than the previous day? In that case, the indicator is smart enough to only count the bigger of the two moves. This keeps it from sending mixed signals and forces it to focus on the dominant force for that specific day. This first step gives us the raw fuel for the rest of the calculation.
Smoothing Out the Noise with ATR
But here’s the thing: raw directional movement is often choppy and full of meaningless "noise." A tiny tick up or down doesn't automatically signal a real change in market sentiment. To filter this out and zero in on what truly matters, the DMI employs a brilliant sidekick: the Average True Range (ATR).
The ATR measures a market's volatility over a specific period, usually 14 days. By comparing the +DM and -DM values against the ATR, the DMI essentially adjusts everything for volatility. This means a one-dollar move in a quiet, stable stock is treated as more significant than the same one-dollar move in a wild, unpredictable one.
By baking volatility right into its formula, the DMI becomes a much more intelligent tool. It doesn't just see price changes; it understands the context of those changes. That's a huge deal for accurate trend analysis. You can take a deeper dive into this key component in our detailed guide on how to use the Average True Range (ATR) here: https://chartswatcher.com/pages/blog/how-to-use-atr-indicator-a-trader-s-essential-guide.
This infographic breaks down the DMI's journey from raw price data to the final indicator lines you see on your chart.
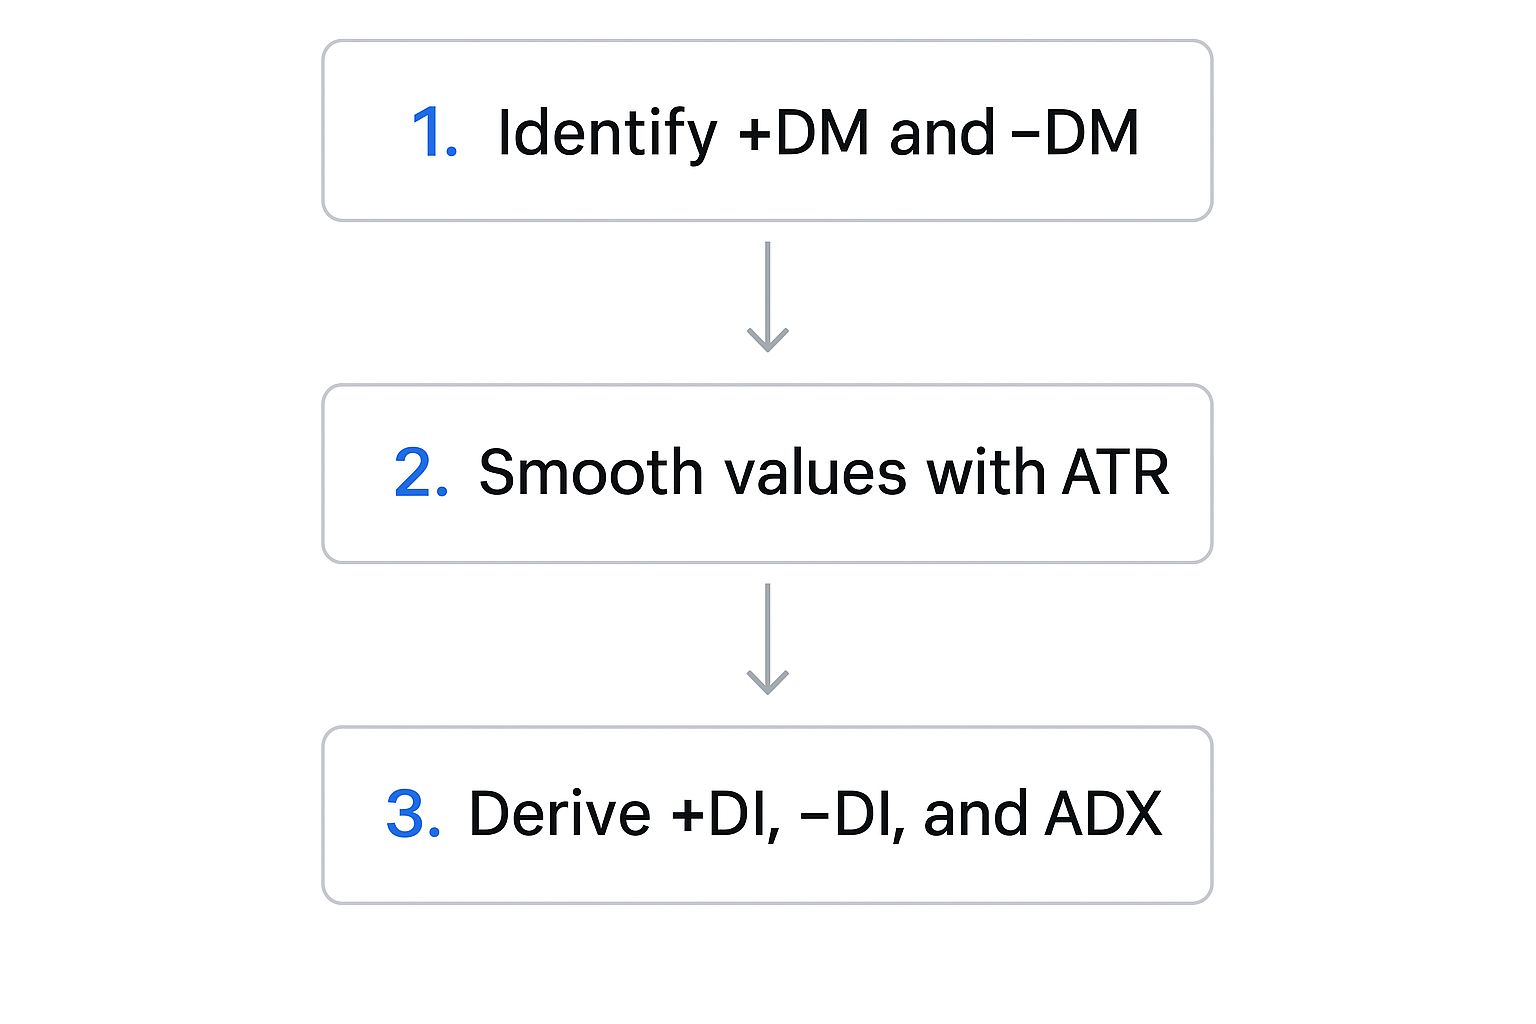
As you can see, the indicator systematically refines market noise into actionable intelligence, moving from simple price comparisons to a sophisticated measure of trend.
Crafting the Final Indicator Lines
Once the directional movement is calculated and then smoothed out with the help of the ATR, we finally get the two main lines you see on your chart: the Positive Directional Indicator (+DI) and the Negative Directional Indicator (-DI). These lines show the percentage of the true range that was directional—either up or down—over the lookback period.
The last piece of the puzzle is the Average Directional Index (ADX) line. Now, the ADX doesn't care about direction at all. That's not its job. Instead, it measures the strength of the trend by looking at the difference between the +DI and -DI lines and then smoothing that value out.
If there's a big gap between +DI and -DI, it means either buyers or sellers are clearly in the driver's seat, which causes the ADX line to rise. If the gap is small, it suggests a stalemate, causing the ADX to fall or stay low. This final step is what gives the DMI its unique power to tell you not just which way the market is heading, but how strongly it's moving. As traders constantly look for an edge, new approaches like leveraging AI for financial analysis are being explored to complement these time-tested indicator strategies.
Reading the Signals from DMI and ADX
Learning to read the DMI is like learning the language of market trends. The way its three lines interact tells a story about the constant tug-of-war between buyers and sellers—and, most importantly, who’s currently winning.
The whole game starts with the crossovers between the Positive Directional Indicator (+DI) and the Negative Directional Indicator (-DI). These crossovers are your first hint that the balance of power might be shifting.
Interpreting DI Crossovers
A crossover is simply the moment one DI line crosses over the other. Each has a very clear meaning, giving you an early heads-up for a potential move.
-
Bullish Crossover: This happens when the +DI line (the bulls) crosses above the -DI line (the bears). This signal suggests buying pressure is starting to overwhelm selling pressure. An uptrend could be starting.
-
Bearish Crossover: On the flip side, a bearish signal flashes when the -DI line crosses above the +DI line. This tells you that sellers are gaining the upper hand, and a downtrend may be on the horizon.
Here’s the catch, though: acting on these crossovers alone is a rookie mistake. In a choppy, sideways market, these lines will whip back and forth, generating a ton of false signals that will chew up your account. This is precisely why the ADX line is your most trusted ally.
The ADX as Your Trend Strength Filter
The Average Directional Index (ADX) is what makes the DMI a complete system. Its only job is to measure the strength of a trend, not its direction. It's the DMI's built-in reality check.
Think of the ADX as a bouncer at a club. A DI crossover might show up at the door, but a strong ADX value is what decides if it gets in. Without the ADX's approval, most crossovers are just noise.
The ADX moves on a scale from 0 to 100, and specific levels act as critical thresholds. Getting a feel for these levels is key to filtering out weak, low-probability trades and focusing only on markets that have real momentum behind them.
ADX Level Interpretation
| ADX Value | Trend Condition | What It Means for Traders |
|---|---|---|
| Below 20 | Weak or No Trend | This is the "danger zone." The market is likely consolidating or moving sideways. Crossovers here are unreliable—stay out. |
| Rising from 20 to 25 | Emerging Trend | Things are getting interesting. A trend is starting to build strength, and a DI crossover in this zone is worth paying attention to. |
| Above 25 | Strong Trend | This is your green light. A valid, tradable trend is in motion. Crossovers that happen while the ADX is above 25 are high-probability signals. |
| Above 50 | Very Strong Trend | The trend is powerful and well-established. This is often a mature trend, so be aware that extremely high levels can sometimes signal trend exhaustion is near. |
Simply by using the ADX as a filter, you can dramatically improve your signal quality. If a +DI/-DI crossover occurs but the ADX is stuck below 20, the smart play is to ignore it. But if that same crossover happens as the ADX pushes above 25, you've got a much more reliable signal that a real trend is taking hold.
Putting It All Together Visually
Let's walk through how this looks on a real chart.
-
A Strong Uptrend: You’ll see the +DI line trading clearly above the -DI line. Crucially, the ADX line will also be rising and above 25. The widening gap between +DI and -DI, backed by a strong ADX, confirms the bulls are in complete control.
-
A Powerful Downtrend: Here, the -DI line is the dominant one, sitting well above the +DI line. At the same time, the ADX is also strong and rising (above 25), confirming the intensity of the selling. Remember, a high ADX just measures force—it doesn't care if the price is going up or down.
-
A Sideways Market: This is where the directional movement index indicator really earns its keep by saving you money. In a choppy market, the +DI and -DI lines will be tangled together, crossing back and forth with no clear winner. The dead giveaway is the ADX line, which will be flat and trading below 20, telling you there’s no real trend to trade.
Actionable DMI Trading Strategies
Okay, let's move from theory to action. This is where the directional movement index indicator really proves its worth. Knowing what the lines mean is one thing, but using them to make disciplined, repeatable trading decisions is a whole different ballgame. The following strategies give you a clear framework for turning DMI signals into a solid trade plan.
At its core, the DMI was built for trend-following. It’s a game of patience, waiting for that perfect storm where both direction and strength align before you put any capital on the line. The main idea is simple: confirm a directional signal from a DI crossover with a strength signal from the ADX.

The Crossover and Confirmation Strategy
This is the classic, bread-and-butter DMI strategy, and it’s the foundation for almost everything else you’ll do with the indicator. It’s a simple two-step process designed to filter out the noise and zero in on moves that have real momentum behind them.
The Two Core Conditions for Entry:
-
The Signal (Crossover): First, you need a crossover between the +DI and -DI lines. If +DI crosses above -DI, it's a potential buy signal. If -DI crosses above +DI, it's a potential sell signal. Think of this as your initial heads-up that a power shift might be underway.
-
The Filter (ADX Strength): Next, the ADX line must be above 20—and ideally, rising. An ADX value above 25 is even better and gives you a much higher degree of confidence. This confirms there’s enough conviction in the market to actually fuel a new trend.
For example, a buy signal doesn't trigger just because the +DI line barely inches above the -DI. A true, high-probability buy signal happens when that bullish crossover occurs while the ADX is climbing past the 25 threshold. This one-two punch tells you that not only are buyers taking control, but the overall trend is gaining serious momentum.
Identifying Trend Exhaustion and Taking Profits
The DMI is great for getting you into strong trends, but it also drops major clues about when a trend is getting tired and running out of gas. A monster trend will often have a high ADX, sometimes pushing above 40 or even 50. But no trend goes on forever.
When you see a high ADX start to flatten out and then turn downwards, that's your warning sign. This tells you the momentum driving the trend is fading. Even if the price is still rising and the +DI line is way above the -DI, a falling ADX suggests the move is losing its conviction.
This is a crucial signal for taking profits. A falling ADX doesn’t mean the trend will reverse immediately, but it often comes before a period of sideways chop or a pullback. It’s the market whispering that the dominant force is getting tired, making it a perfect time to lock in your gains before the tide turns.
This proactive approach helps you keep your profits instead of giving a chunk of them back while waiting for a clear-cut reversal signal, which almost always comes much later.
Using DMI as a Defensive Tool
Perhaps the most underrated use of the directional movement index indicator is knowing when to sit on your hands and do nothing. Trend-following systems get chewed up in choppy, sideways markets where prices whip back and forth with no real direction. The DMI is your best defense against these capital-draining environments.
The rule couldn't be simpler: if the ADX is trading below 20, stay on the sidelines. An ADX this low is a clear signal of a weak or non-existent trend.
- In these conditions, +DI and -DI crossovers happen all the time and are completely meaningless.
- Breakouts are far more likely to fail and reverse.
- The market is essentially stuck in a state of indecision.
By respecting a low ADX, you preserve your capital and, just as importantly, your mental energy for when real opportunities show up. This defensive mindset is a hallmark of a professional trader. Instead of trying to force trades in a bad market, you patiently wait for the ADX to rise, signaling that a clear, tradable trend has finally emerged.
Common Mistakes to Avoid When Using the DMI
The Directional Movement Index is an incredibly sharp tool, but like anything in a trader's toolkit, it's not foolproof. In fact, knowing what not to do with the DMI is just as crucial as knowing how to use it. The traders who truly get it are the ones who respect its limits and sidestep the common traps that lead to frustration and losses.
One of its biggest quirks is that it's a lagging indicator. Think of it like looking in your car's rearview mirror—it tells you exactly where you've been, but not necessarily where you're going next. Because it's built on past price data, it's always a step behind the live market. In quiet times, this isn't a huge deal. But in fast, news-driven markets, its signals can show up late to the party.
A sudden market shock, for example, can send prices cratering long before the DMI has a chance to sound the alarm. A stark real-world example was the COVID-19 market crash in March 2020. The S&P 500 fell over 30% in a month, but the DMI's ADX line took several painful days to climb above the 20 threshold. By then, a massive chunk of the move was already history. You can discover more insights about DMI's practical application on trendspider.com.
The Trap of Trading Every Crossover
This is, without a doubt, the single biggest mistake new DMI users make. They see the +DI and -DI lines cross and immediately jump on it as a buy or sell signal. This is a recipe for getting chopped to pieces, especially when the market is just drifting sideways.
In a choppy, range-bound market, those DI lines will crisscross constantly. Each one looks like a valid signal, but they're just market noise. Acting on every single one is a surefire way to bleed your account with a string of small, frustrating losses.
A DI crossover without ADX confirmation isn't a signal. It's just a whisper. Treating every crossover as a green light is like trying to drive a car by only looking at the speedometer while completely ignoring the road ahead.
Ignoring the ADX Level and Slope
Another classic blunder is getting laser-focused on the DI lines while completely ignoring what the ADX is doing. A bullish crossover means absolutely nothing if the ADX is snoozing below 20. That low ADX reading is the indicator's way of shouting, "There is no trend here—stay out!"
Just as important is the slope of the ADX line. A rising ADX, even if it's still below 25, tells you that trend strength is building. On the flip side, an ADX line that starts to roll over from a high level is a warning that the trend is losing steam, even if prices are still pushing higher. If you ignore these clues, you're missing half the story the DMI is trying to tell you.
How to Overcome These Pitfalls
The good news is that these mistakes are easy to avoid with a bit of discipline. The golden rule is to never use the directional movement index indicator all by itself. Always pair it with other tools to build a stronger case for any trade.
-
Bring in a Leading Indicator: Combine the DMI with a momentum oscillator like the Relative Strength Index (RSI). The RSI can help you spot overbought or oversold conditions, giving you much better timing for your entries and exits. It acts as a great confirmation tool for the strength behind a DI crossover.
-
Add a Simple Trend Filter: Overlay a basic moving average, like a 50-period SMA, on your price chart. This creates a simple but powerful rule: only take long signals from the DMI when the price is above the moving average, and only take short signals when it's below. This filter helps ensure you're always trading with the prevailing wind at your back.
-
Make ADX Your Gatekeeper: Treat the ADX as your primary filter. No exceptions. No matter how perfect a DI crossover looks, if the ADX is below the 20-25 zone, the best trade is no trade. Patience is a trader's most valuable asset, and the ADX is the perfect tool for enforcing it.
The Reality of DMI Performance Statistics
It’s easy to get swept up by the clean-looking signals an indicator like the DMI can spit out. But we need to ground our expectations in reality. When you look at the raw performance data, a strategy that only uses the directional movement index indicator paints a surprising picture—one that looks discouraging at first but holds a powerful lesson.
Believe it or not, pure, unfiltered DMI strategies often have a win rate below 50%. This means more than half the trades triggered by a simple DI crossover might end up as small losses. For traders who think success means winning most of the time, that can be a tough pill to swallow.
Why a Low Win Rate Can Still Be Profitable
So, if it loses more often than it wins, why bother? The secret is in the asymmetry of the results. The DMI wasn't designed to win a bunch of small skirmishes. It was built to catch the massive, sustained trends that can define a market cycle. When it snags one of those big moves, the profits can be enormous.
This creates a trading profile where a few huge winning trades easily wipe out a string of small, manageable losses from failed signals. The goal here isn't a high win rate; it’s a high profit factor—the total profit divided by the total loss.
The core idea is simple: the DMI helps you lose small and win big. Think of it as a specialized tool for riding major market currents, not for scalping minor ripples.
For example, backtesting on major U.S. stocks has shown that a basic DMI crossover strategy can have a 64% loss rate. Sounds terrible, right? But the average winning trade returned 4.4%, while the average losing trade was just -2%. This resulted in a positive reward-to-risk ratio of 2.20. You can dig into these DMI performance findings online for more detail.
The DMI Is Not a Standalone System
This data drives home a critical point: the DMI is not a magic bullet or a complete trading system in a box. It's a powerful component that belongs inside a larger, more robust system.
To really make it work, you have to pair it with disciplined risk management, like setting strict stop-loss orders. Many traders also combine it with other indicators for confirmation before pulling the trigger. The only way to know what works for you is to test it yourself. Our guide on how to backtest a trading strategy gives you the framework to do just that.
Ultimately, the DMI shines as a trend-identification filter. It helps you stay out of choppy, sideways markets and get positioned for the major moves that truly matter.
Frequently Asked Questions About the DMI
When traders first get their hands on the directional movement index indicator, a few common questions always pop up. It's a powerful tool, but it's important to know where it fits in your arsenal.
One of the first things people ask is how it's different from momentum oscillators like the RSI or MACD.
The distinction is actually pretty simple: oscillators are all about measuring the speed and change of price movements—what we call momentum. The DMI, on the other hand, is built to measure the underlying strength and direction of a trend itself. Think of it this way: the RSI might signal that a stock is overbought, but the ADX line in the DMI is what tells you whether the trend powering that move is actually strong enough to keep pushing higher.
What Is the Best Timeframe for the DMI?
The DMI really shines on longer timeframes, which is why it's a favorite for swing and position traders. When you look at daily and weekly charts, the signals are much cleaner and less prone to getting thrown off by the random noise you see in day-to-day price action.
You can use it for day trading on something like an hourly chart, but it starts to lose its reliability on anything shorter than that.
On charts like the 5-minute or 15-minute, the +DI and -DI lines have a nasty habit of crossing back and forth constantly, creating a series of false signals known as "whipsaw." That’s why many traders consider the daily chart the sweet spot—it offers a fantastic balance of signal clarity and responsiveness. If you have questions that go beyond these common queries or need guidance on more complex indicators, it can be beneficial to consult experts for personalized insights.
While the standard 14-period setting is a great place to start for most markets, it's definitely not a one-size-fits-all solution. A common tweak is to adjust the lookback period to better match a market's unique volatility or your own trading style.
Using a shorter period (like 7 or 10) will make the DMI more sensitive to recent price moves. This can give you earlier signals, but it comes at the cost of more noise. On the flip side, a longer period (like 20 or 25) smooths everything out, giving you fewer signals that tend to be more reliable for long-term trend analysis.
Ready to take your trend analysis to the next level? With ChartsWatcher, you can integrate the DMI with custom alerts, advanced charting, and powerful backtesting tools to build and validate your trading strategies. Start analyzing trends with precision at ChartsWatcher today.
