How to Backtest a Trading Strategy: Essential Guide
The Strategic Foundation of Effective Backtesting
Backtesting a trading strategy isn't just about analyzing past performance; it's the cornerstone of developing a robust and profitable trading approach. It’s the key differentiator between traders who consistently succeed and those who face ongoing challenges. This critical process transforms theoretical trading concepts into testable strategies, enabling you to validate your assumptions against real market behavior without risking actual capital. This forms the strategic foundation for effective backtesting. For a deeper dive into backtesting mastery, check out this helpful resource: How to master backtesting a trading strategy.
Why Backtesting Matters
One of the primary advantages of backtesting is its ability to instill genuine confidence. By observing how a strategy would have performed historically, traders gain a more realistic understanding compared to relying on optimism or intuition. This data-driven methodology encourages disciplined trading and minimizes emotional decision-making in live markets.
Backtesting also provides valuable insights into potential vulnerabilities within a strategy. Early identification of these flaws allows for adjustments and refinements, ultimately contributing to a more resilient and profitable approach.
Backtesting involves simulating trades using historical market data. This helps evaluate performance and risk before committing real funds. A comprehensive backtest should include a diverse dataset representing various market conditions – bullish, bearish, and sideways – to prevent skewed results.
For example, using data only from currently active stocks introduces survivor bias. This can falsely inflate profitability estimates. To provide a realistic assessment, historical data should include delisted or bankrupt companies. It’s equally important to factor in costs such as commissions, slippage, and taxes. Even seemingly small fees can significantly impact overall returns.
A robust backtest ideally incorporates at least 100 to 200 trades for statistical significance. This helps traders differentiate a genuine edge from random luck. Following backtesting, forward performance testing, often through paper trading, is essential. This validates the strategy in current market conditions without financial risk. This sequential approach—backtesting followed by forward testing—helps confirm the strategy's viability before live implementation. Therefore, backtesting isn't solely about past results; it’s about anticipating future performance and understanding potential risks under diverse market dynamics. Learn more about backtesting.
Manual Vs. Automated Backtesting
The choice between manual and automated backtesting depends on various factors, including individual trading style, technical skills, and target markets. Manual backtesting involves manually inputting historical data and calculating trades, typically using spreadsheets or charting software. This method offers a deeper understanding of the strategy's mechanics, but it can be time-consuming and susceptible to human error.
Automated backtesting, conversely, utilizes software to execute and analyze trades over historical data quickly and efficiently. This allows testing a wider range of parameters and market scenarios. However, it requires programming skills or familiarity with specialized backtesting software. Understanding the advantages and disadvantages of each approach is vital for selecting the method best suited to individual needs, which ultimately helps establish a strong foundation for achieving trading goals.
Finding and Preparing Data That Won't Mislead You
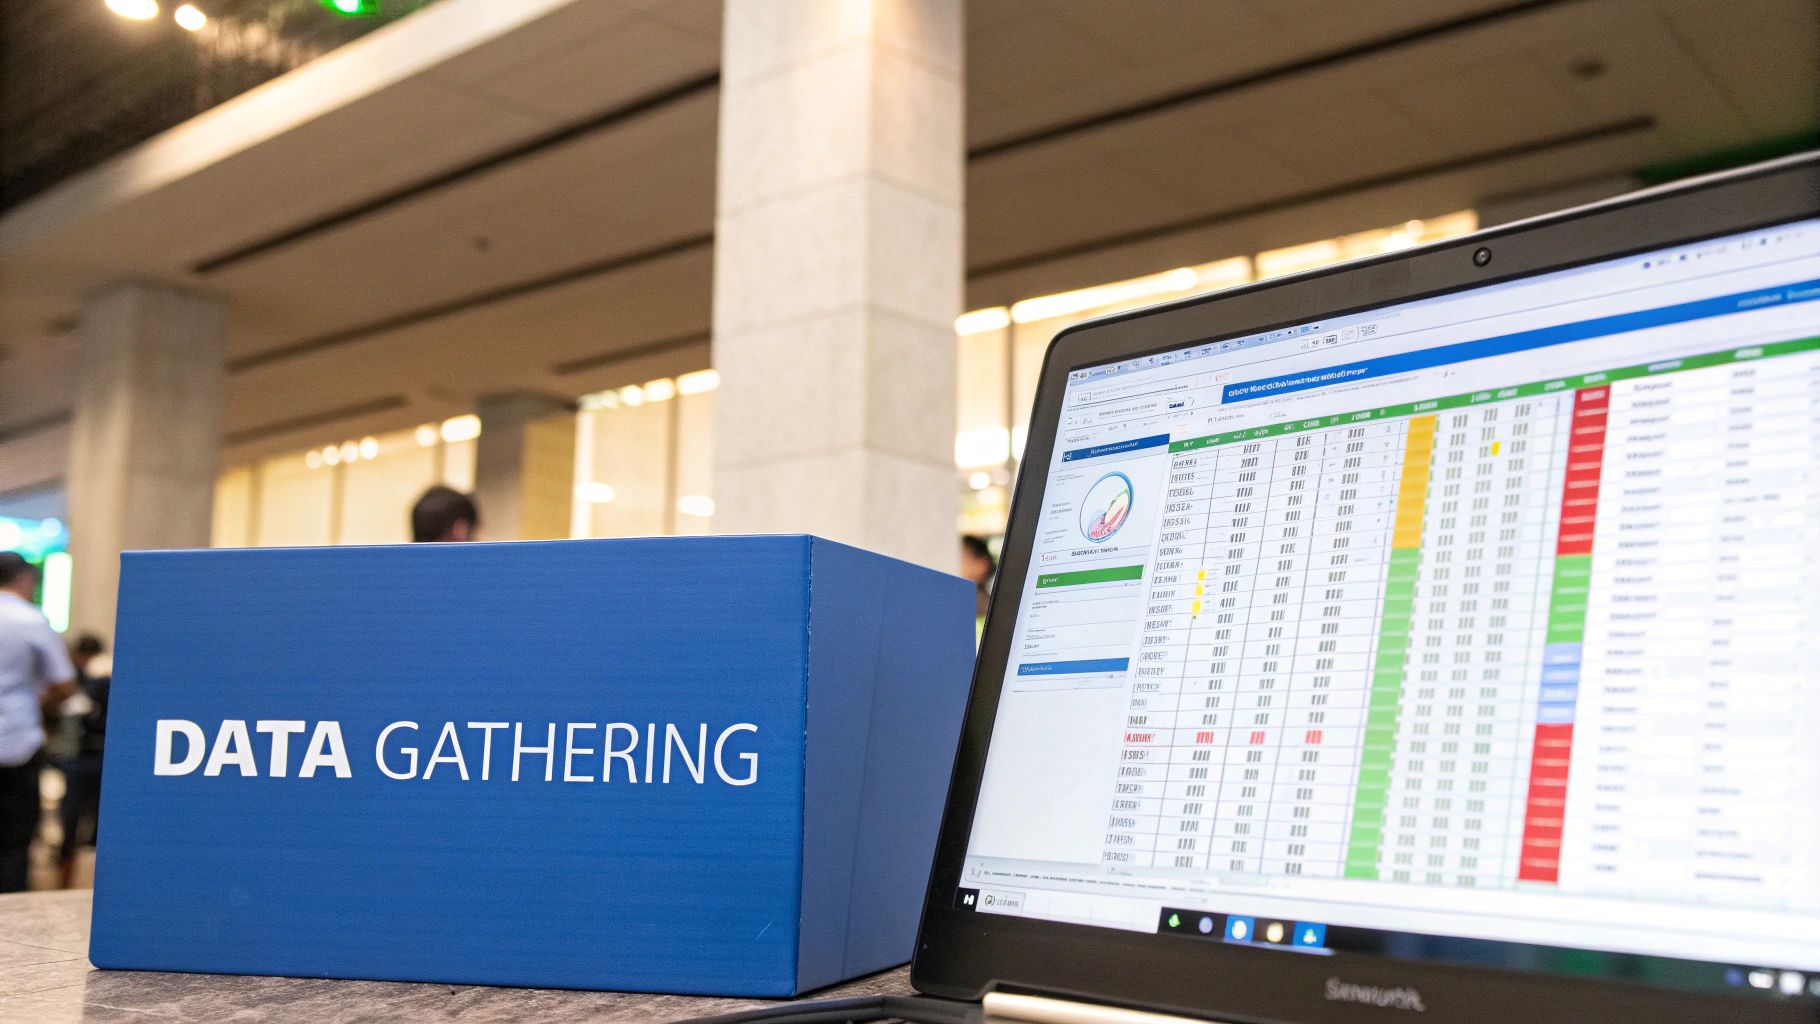
The success of any backtest hinges on the quality of the data used. As the old adage states: garbage in, garbage out. This section explores the essential steps to source, prepare, and validate market data for robust backtesting. By ensuring your trading strategy is tested against realistic market conditions, you are setting the stage for dependable results that can effectively translate to live trading.
Sourcing Reliable Market Data
Finding the right data provider is crucial for accurate backtesting. Numerous providers cater to a variety of needs and budgets. Free data sources, while attractive, often have limitations such as delayed data, a limited historical range, and potential inaccuracies. Paid data providers, such as Quandl, offer more comprehensive and reliable data, but come with a cost. Balancing cost and data quality becomes a key decision for every trader.
Let's explore some common data sources:
- Brokerage Platforms: Many brokers offer historical data, often a convenient starting point for those new to backtesting.
- Specialized Data Vendors: These vendors, like Intrinio, offer granular, high-quality data, often including tick data. This level of detail is especially valuable for high-frequency or algorithmic strategies.
- Financial APIs: APIs, such as those provided by IEX Cloud, offer direct integration of market data into backtesting software. This automation simplifies the data retrieval process.
To help you choose the best data source, we've compiled a comparison of several popular options:
To help you choose the best data source, we've compiled a comparison of several popular options:
Historical Data Sources Comparison Comparison of popular sources for obtaining historical market data for backtesting
| Data Provider | Cost Range | Data Types | Historical Range | Advantages | Limitations |
|---|---|---|---|---|---|
| Quandl | Free - $$ | Various (End-of-day, Fundamental, Alternative) | Varies | Wide range of datasets, including free options | Data quality and availability vary by source |
| Intrinio | $-$$$ | Various (Real-time, Historical, Fundamentals) | Varies | Real-time and historical data options, API access | Pricing can be complex based on data needs |
| IEX Cloud | Free - $$$ | Primarily US Equities (Real-time and Historical) | Varies | Affordable pay-as-you-go pricing, good for US market data | Limited international data coverage |
| Brokerage Platforms (e.g., Interactive Brokers) | Included with Brokerage Account | Typically Historical (Daily or Intraday) | Varies | Convenient if already using the brokerage | Limited to supported markets and asset classes |
| Tiingo | Free - $$ | Various (End-of-day, Crypto, News) | Varies | Comprehensive, including some free data, API access | Premium features require paid subscriptions |
This table helps illustrate the variety of data sources available. Selecting the right one will depend on your specific backtesting needs.
Understanding Different Data Types
The type of data you use significantly affects your backtest results. Different strategies demand different levels of data granularity. For example, while daily data might be adequate for a long-term, trend-following strategy, a short-term scalping strategy requires the detail of tick data to accurately capture rapid price fluctuations. Therefore, aligning the data frequency to your trading style is paramount.
Here's a breakdown of common data types:
- Tick Data: This captures every single price change, providing the most precise representation of market dynamics.
- OHLC (Open, High, Low, Close) Bars: These bars summarize price action over specified periods (e.g., 1 minute, 5 minutes, daily). They provide a practical balance of detail and manageability.
- Daily Data: This reflects the daily open, high, low, and close prices, generally sufficient for longer-term strategies.
Cleaning and Preparing Your Data
Raw market data often requires cleaning and preparation. This vital step involves identifying and correcting errors, addressing missing values, and adjusting for corporate actions like stock splits or dividends. Without this process, seemingly minor issues, like an unadjusted stock split, could artificially skew historical returns. Proper data cleaning ensures your backtest mirrors real-world trading conditions.
Beyond cleaning, addressing potential biases is essential. Survivorship bias, where delisted or bankrupt companies are excluded, can create an overly optimistic backtest. Look-ahead bias, which incorporates information unavailable at the trade’s execution time, also creates unrealistic scenarios. Recognizing and mitigating these biases is critical for reliable backtesting.
By prioritizing data quality and preparation, you establish a solid foundation for backtesting your trading strategy. This thoroughness promotes accurate results and reduces the risk of developing strategies that succeed only in simulated environments. This brings us to the next crucial element: clearly defining your trading rules.
Crafting Trading Rules That Actually Hold Up

Profitable trading isn't about luck; it's about strategy. Moving beyond basic market observations, consistent success requires precise and well-defined trading rules. This section explores how to translate your market insights into actionable strategies you can actually test.
From Insight to Testable Hypothesis
Successful traders don't rely on gut feelings. Instead, they transform their understanding of market behavior into quantifiable rules. This means converting general ideas into specific, testable hypotheses.
For example, instead of assuming "tech stocks do well in growing economies," a trader might create a rule: "Buy tech stocks with a price-to-earnings ratio below 20 when GDP growth exceeds 2.5%." This level of detail is essential for effective backtesting.
Defining Clear Entry and Exit Conditions
Emotions can lead to impulsive decisions, which often hurt trading performance. Clear entry and exit conditions help remove this subjectivity.
These conditions should be based on measurable metrics, leaving no room for interpretation. An example entry rule: "Enter a long position when the 50-day moving average crosses above the 200-day moving average." A corresponding exit rule could be: "Exit the long position when the price falls 2% below the 50-day moving average."
Essential Components of a Robust Strategy
Regardless of complexity, every trading strategy needs a few key elements. Position sizing, determining how much capital to allocate per trade, is vital for managing risk. Equally important are risk parameters, like stop-loss orders, which limit potential losses during market downturns.
When working with large datasets for backtesting, a good understanding of data warehouses is beneficial. They offer a structured way to store and analyze historical market data.
The Power of Simplicity
Surprisingly, many successful traders start with simple strategies. They prioritize clarity and testability over complicated algorithms. Adding complexity is only warranted if it demonstrably improves performance during backtesting. This iterative process helps avoid "overfitting" the strategy to past data.
Documenting Your Strategy Logic
Thorough documentation is key for consistent execution and future improvements. Professional traders keep detailed records of their strategies, including:
- Entry Rules: The specific triggers for entering a trade.
- Exit Rules: Conditions for exiting, including profit targets and stop-loss levels.
- Position Sizing Rules: Capital allocation per trade, considering risk tolerance and volatility.
- Risk Management Rules: Stop-loss orders, maximum drawdown limits, and other safeguards.
This documentation ensures consistency and provides a framework for analyzing performance and making adjustments. Many traders create a formal "trading plan" that they review regularly.
This meticulous approach to crafting trading rules sets the stage for successful backtesting. By translating market insights into measurable parameters and diligently documenting their logic, traders build a solid foundation for evaluating and refining their approach. This preparation is essential for developing a strategy that can withstand the challenges of real-world markets.
Beyond Returns: Metrics That Actually Matter
After defining your trading rules and preparing your data, the next step in backtesting a trading strategy is thorough performance analysis. It's not enough to simply look at profit. Successful traders know a true edge comes from understanding the nuances of risk and consistency. This section explores the key metrics that differentiate robust strategies from those likely to fail.
Risk-Adjusted Returns: Seeing the Full Picture
Impressive profit figures can be enticing, but raw returns don't tell the whole story. A strategy might generate high profits while experiencing significant equity swings, exposing you to considerable risk. This is where risk-adjusted returns become vital. Metrics like the Sharpe Ratio help quantify the return earned for each unit of risk. A higher Sharpe Ratio generally indicates a better risk-return profile.
Unveiling Strategy Durability With Key Metrics
Beyond the Sharpe Ratio, other critical metrics illuminate a strategy's robustness:
-
Maximum Drawdown: This measures the largest peak-to-trough decline in equity during the backtest. A lower maximum drawdown suggests better capital preservation. A 10% drawdown is generally acceptable, while a 50% drawdown signals substantial risk.
-
Profit Factor: This calculates the ratio of gross profits to gross losses. A profit factor above 1.5 is often desirable, indicating winning trades outweigh losing trades in terms of profit.
Beyond Win Rate: Understanding the Nuances of Consistency
While win rate (the percentage of winning trades) offers some insights, it's not the whole picture. A strategy with a low win rate (e.g., 40%) can be profitable if the average winning trade significantly exceeds the average losing trade. This emphasizes the importance of considering average win/loss size alongside the win rate. Metrics like the standard deviation of returns quantify profit consistency over time. A lower standard deviation indicates more predictable performance.
Backtesting effectiveness relies on key performance metrics. Win rate, the percentage of profitable trades, often falls between 40% and 60% for successful strategies. Net profit/loss shows overall profitability but should be considered alongside drawdown, the largest peak-to-trough loss, to understand potential risk. Testing during diverse market regimes, such as the 2007-2009 crisis and the 2020 pandemic crash, provides more reliable insights. Explore this topic further. You might also be interested in how to master trading performance metrics.
Building a Comprehensive Framework for Evaluation
Analyzing these interconnected metrics across different market conditions gives you a holistic view of your strategy's potential. This framework is essential for identifying truly robust strategies that can perform well in live trading. This comprehensive assessment helps you navigate diverse markets, from bull markets to volatile periods and unexpected events.
Putting It All Together
The following table summarizes key performance metrics:
Key Performance Metrics for Strategy Evaluation Essential metrics to assess the performance and risk profile of backtested trading strategies
| Metric | Formula | What It Measures | Target Values | Limitations |
|---|---|---|---|---|
| Sharpe Ratio | (Average Return - Risk-Free Rate) / Standard Deviation of Returns | Risk-adjusted return | > 1 (good), > 2 (excellent) | Doesn't account for all types of risk |
| Maximum Drawdown | (Peak Equity - Trough Equity) / Peak Equity | Largest percentage loss | As low as possible, < 20% often desirable | Past drawdowns don't guarantee future performance |
| Profit Factor | Gross Profit / Gross Loss | Ratio of profits to losses | > 1.5 generally desirable | Can be skewed by outlier trades |
| Win Rate | (Number of Winning Trades) / (Total Number of Trades) | Percentage of winning trades | Varies, 40-60% common for profitable strategies | Misleading in isolation, consider average win/loss size |
| Standard Deviation of Returns | Statistical measure of return dispersion | Consistency/Volatility of returns | Lower is generally better | Doesn't predict future volatility |
This framework for analyzing backtesting results provides a deeper understanding of how to backtest a trading strategy than merely focusing on profitability. By emphasizing risk management, consistency, and performance across various market conditions, you build a foundation for a resilient trading career.
Avoiding the Traps That Derail Even Experienced Traders
Even seasoned traders sometimes stumble. Backtesting pitfalls can create a false sense of security, leading to costly mistakes. This section explores common errors and provides guidance on how to sidestep these traps. By understanding the issues and taking precautions, you can improve the reliability of your backtesting and boost your chances of trading success.
Look-Ahead Bias: The Silent Corrupter
Look-ahead bias subtly poisons backtesting by using information not available during a live trade. This creates an unrealistic advantage, like trading with a crystal ball. The result? Artificially inflated performance.
For example, imagine using a stock's closing price to trigger a trade earlier in the day. That's look-ahead bias – you wouldn't have that closing price in real time. To detect this bias, carefully examine every data point in your backtest. Ensure each piece of information would have been accessible at the exact moment of the simulated trade. This keeps your testing honest.
Survivorship Bias: The Illusion of Inflated Returns
Survivorship bias paints a rosy picture of the past. How? By excluding failed instruments. Imagine backtesting a stock index that only includes currently listed companies. This ignores the companies that went bankrupt or were delisted, making past performance look better than it truly was.
The solution? Include those delisted or bankrupt companies. A complete dataset, reflecting real market conditions, is essential. This paints a more realistic picture of potential returns. It also helps you avoid strategies doomed to fail in live trading.
Over-Optimization: The Danger of Perfect Fit
Over-optimization happens when a trading strategy is too closely fitted to historical data. It's like tailoring a suit perfectly to one specific pose. Backtesting results look amazing, but real-world performance often disappoints. This "curve-fitting" creates a strategy that's great at mimicking the past, but unable to handle new market situations.
Think of crafting a strategy specifically for the 2008 financial crisis. Impressive in hindsight, right? But such a specific approach probably wouldn't work in other market situations. To avoid this, keep your trading rules simple and robust. Start basic and add complexity only when it demonstrably improves out-of-sample performance. Tools like walk-forward analysis and Monte Carlo simulation can help test your strategy’s resilience.
Robust Validation Methods: The Cornerstones of Professional Testing
Professional traders utilize specific techniques to navigate these hazards:
- Walk-forward analysis: Tests a strategy on progressively newer data, simulating real-time performance and preventing over-optimization.
- Monte Carlo simulation: Creates thousands of randomized market scenarios to see how a strategy performs under diverse conditions.
- Out-of-sample testing: Evaluates a strategy on data it hasn't "seen" during development, providing a realistic performance assessment.
These methods offer a much more rigorous assessment than simple backtesting. They ensure your strategy isn't just good at explaining the past, but also has the potential to predict the future. By understanding how to backtest effectively and avoid these pitfalls, you can significantly improve your odds of creating a winning strategy for live markets.
Choosing Tools That Match Your Trading Reality
The right backtesting platform empowers you to refine your trading strategy without unnecessary complexity. This section compares tools favored by profitable traders, catering to various experience levels and strategy types. We'll objectively analyze options, from accessible platforms like TradingView to professional solutions and custom coding, focusing on matching the tool to your specific needs.
From Simple to Sophisticated: A Spectrum of Backtesting Tools
Whether you’re testing basic price-action strategies or intricate multi-asset systems, choosing the correct tools is crucial. For simple strategies, platforms like TradingView or MetaTrader 4/5 offer built-in backtesting capabilities, often sufficient for beginners. These platforms allow you to test basic technical indicators and visualize historical performance directly on the charts.
For more advanced strategies, dedicated backtesting software like MultiCharts or NinjaTrader provides more granular control and customization. These platforms often include features like automated order execution, advanced charting tools, and the ability to backtest complex options strategies.
Finally, for ultimate flexibility and control, consider professional-grade platforms like the Bloomberg Terminal or custom coding using languages like Python. This approach offers the ability to tailor your backtesting environment to match your precise requirements. However, this advanced level typically involves a steeper learning curve and higher costs.
Matching Capabilities to Your Needs
Choosing the right tool depends on the complexity of your strategy and technical proficiency. If you are primarily focused on price action and simple indicators, TradingView’s built-in backtesting may be sufficient. However, if your strategy involves multiple instruments, complex order types, or custom indicators, more robust platforms offer better solutions.
Here’s a breakdown:
- TradingView: Ideal for testing basic strategies, visualizing historical performance, and getting started with backtesting. Limited in complex scenarios.
- MetaTrader 4/5: Suitable for forex and CFD traders, with built-in backtesting functionality and a large community of users. Limited customization compared to other platforms.
- MultiCharts/NinjaTrader: Geared towards more experienced traders. These offer advanced charting, order execution simulation, and greater control over backtesting parameters. Can involve a learning curve.
- Bloomberg Terminal/Custom Coding: Designed for professional traders and institutions. These offer maximum flexibility and control but require substantial technical expertise and significant investment.
Evaluating the Learning Curve and Costs
While advanced platforms offer a wealth of features, they can be complex to learn. TradingView offers a relatively quick learning curve, allowing beginners to start backtesting quickly. MultiCharts or NinjaTrader, while more powerful, require dedicated learning and practice to fully utilize their capabilities. Custom coding solutions, of course, demand significant programming expertise.
Consider the cost factor. TradingView and MetaTrader are relatively affordable, with free or basic versions available. Specialized platforms like MultiCharts or NinjaTrader generally involve subscription fees or one-time purchase costs. The Bloomberg Terminal and custom development solutions represent the highest investment, often beyond the reach of individual traders.
Making Cost-Effective Choices for How to Backtest a Trading Strategy
Choosing the right backtesting platform hinges on balancing functionality with cost and ease of use. Don’t invest in features you don’t need. Start with simpler tools and progress as your strategy and technical skills develop. Avoid the temptation of "feature bloat" by focusing on the functionalities essential for your trading reality.
For example, if you primarily trade stocks based on simple moving average crossovers, a basic platform like TradingView might suffice. However, if you trade options using complex algorithms, investing in a more specialized platform or exploring custom coding might be justified. This approach allows you to make informed decisions about platform selection, ensuring your tools support your development without unnecessary expense or complexity that could compromise your backtesting accuracy. By carefully choosing tools that align with your trading strategy, you pave the way for efficient backtesting and, ultimately, more successful trading.
Bridging the Gap Between Testing and Trading Profitably
The journey from a successful backtest to profitable live trading is often a stumbling block for many promising strategies. This crucial transition requires more than just a profitable backtest; it demands careful planning, disciplined execution, and a realistic understanding of the ever-changing market.
Setting Up a Realistic Paper Trading Environment
Before you risk your hard-earned capital, a paper trading environment offers an invaluable testing ground. This simulated trading experience allows you to implement your strategy under near real-market conditions without any financial risk. However, a truly effective paper trading environment goes beyond simply executing simulated trades. It needs to accurately reflect real-world trading.
It should incorporate:
- Real-time data feeds: Using delayed data negates the purpose of simulating real-world execution. Real-time data provides an accurate representation of market fluctuations.
- Realistic slippage and commissions: Factor in these costs to gain a precise understanding of your potential profitability. These seemingly small expenses can significantly impact your overall returns.
- Psychological simulation: This is perhaps the hardest element to replicate. Try to execute your strategy as you would with actual money, paying close attention to any emotional reactions that might sway your decisions. Managing emotions is key to successful trading.
This comprehensive approach to paper trading helps bridge the gap between backtesting and live trading, equipping you for the challenges of real-world execution.
Determining Live Trading Readiness
Moving to live trading shouldn't be a spontaneous jump, but rather a systematic process. Several key factors indicate your readiness:
- Consistent paper trading profits: Demonstrating profitability in a simulated environment builds confidence and validates the effectiveness of your strategy.
- Emotional control during paper trading: If you find yourself consistently straying from your strategy due to fear or greed, you might not be quite ready for live trading. Emotional discipline is essential.
- Thorough understanding of your strategy: Knowing the why behind your strategy’s logic is just as crucial as the how. A deep understanding will help you stick to your plan and make informed adjustments when needed.
Scaling Position Sizing Methodically
Starting small is paramount. Begin with a small portion of your intended capital and progressively increase your position size as your confidence and live trading experience develop. This measured approach helps you effectively manage risk and adapt to the fluid nature of live markets.
Realistic Expectations and Strategy Degradation
Even with meticulous backtesting, anticipate some strategy degradation when transitioning to live trading. This refers to the natural decline in performance often observed when moving from simulated to real markets.
Several factors contribute to this performance gap:
- Backtesting imperfections: It’s simply not possible to perfectly simulate every single aspect of the live market. Some unforeseen variables will inevitably arise.
- Market dynamics: Markets are in constant flux, and strategies that performed well in the past might not be as effective in the future. Adaptability is essential.
- Psychological factors: Emotions have a much greater impact in live trading compared to backtesting. Managing your emotions is crucial.
Minimizing the Performance Gap
While some degree of degradation is unavoidable, several steps can be taken to minimize the difference:
- Robust backtesting: Ensure your backtesting process accounts for slippage, commissions, and a wide array of market conditions. This helps create a more realistic simulation.
- Continuous monitoring and adjustment: Carefully track your strategy's live performance and make the necessary adjustments to adapt to evolving market conditions.
- Disciplined execution: Stick to your trading plan and avoid impulsive decisions driven by emotions. Discipline is a cornerstone of successful trading.
Monitoring Live Performance and Strategy Adjustment
Consistent monitoring is essential. Track key metrics such as your Sharpe Ratio, maximum drawdown, and profit factor. These metrics provide valuable insights into your strategy's performance. Establish clear rules for adjusting your strategy based on its performance and observed market shifts.
Knowing When to Pull the Plug
Not every strategy will successfully transition to live trading. It's important to have predetermined criteria for abandoning a strategy. These criteria could include:
- Sustained losses exceeding a defined threshold.
- Significant deviations from expected performance metrics.
- Loss of confidence in the strategy's logic.
Knowing when to persevere and when to let go of a strategy is a vital skill for long-term trading success. By understanding these essential steps, you can significantly improve your chances of bridging the gap between testing and profitable trading.
Ready to elevate your trading? ChartsWatcher, stock market scanning software designed for professional traders, offers a dynamic platform to monitor, analyze, and backtest your strategies. Featuring customizable dashboards, real-time data, and advanced features, ChartsWatcher empowers you to make well-informed trading decisions. Visit ChartsWatcher today and discover how it can sharpen your trading edge.
