Master the Chaikin Money Flow Index
The Chaikin Money Flow Index is a technical indicator that measures the flow of money into or out of a stock over a specific period, usually 20 or 21 days. It does this by looking at both price and volume to figure out whether buying or selling pressure is really in control.
Think of it as a way to gauge the conviction behind a price move. A rising stock price is good, but a rising stock price on heavy volume? That's a much stronger signal.
What Is the Chaikin Money Flow Index
Imagine a classic tug-of-war between buyers (bulls) and sellers (bears). The Chaikin Money Flow Index, or CMF, is like the referee watching the rope, telling you which side is pulling harder at any given moment.
Developed by the legendary analyst Marc Chaikin, this indicator was built to peer underneath simple price charts. It uncovers the underlying strength or weakness of a trend by factoring in the power of trading volume. If a stock is climbing higher and the trading volume is strong, the CMF confirms that powerful buying pressure is driving the move.
On the flip side, if the price is dropping on high volume, the CMF will signal that sellers are firmly in command. This blend of price action and volume gives you a much richer, more reliable picture of what's happening than price alone ever could.
This infographic breaks down how CMF acts as a 'Smart Money Gauge,' showing the flow of capital in and out of an asset.
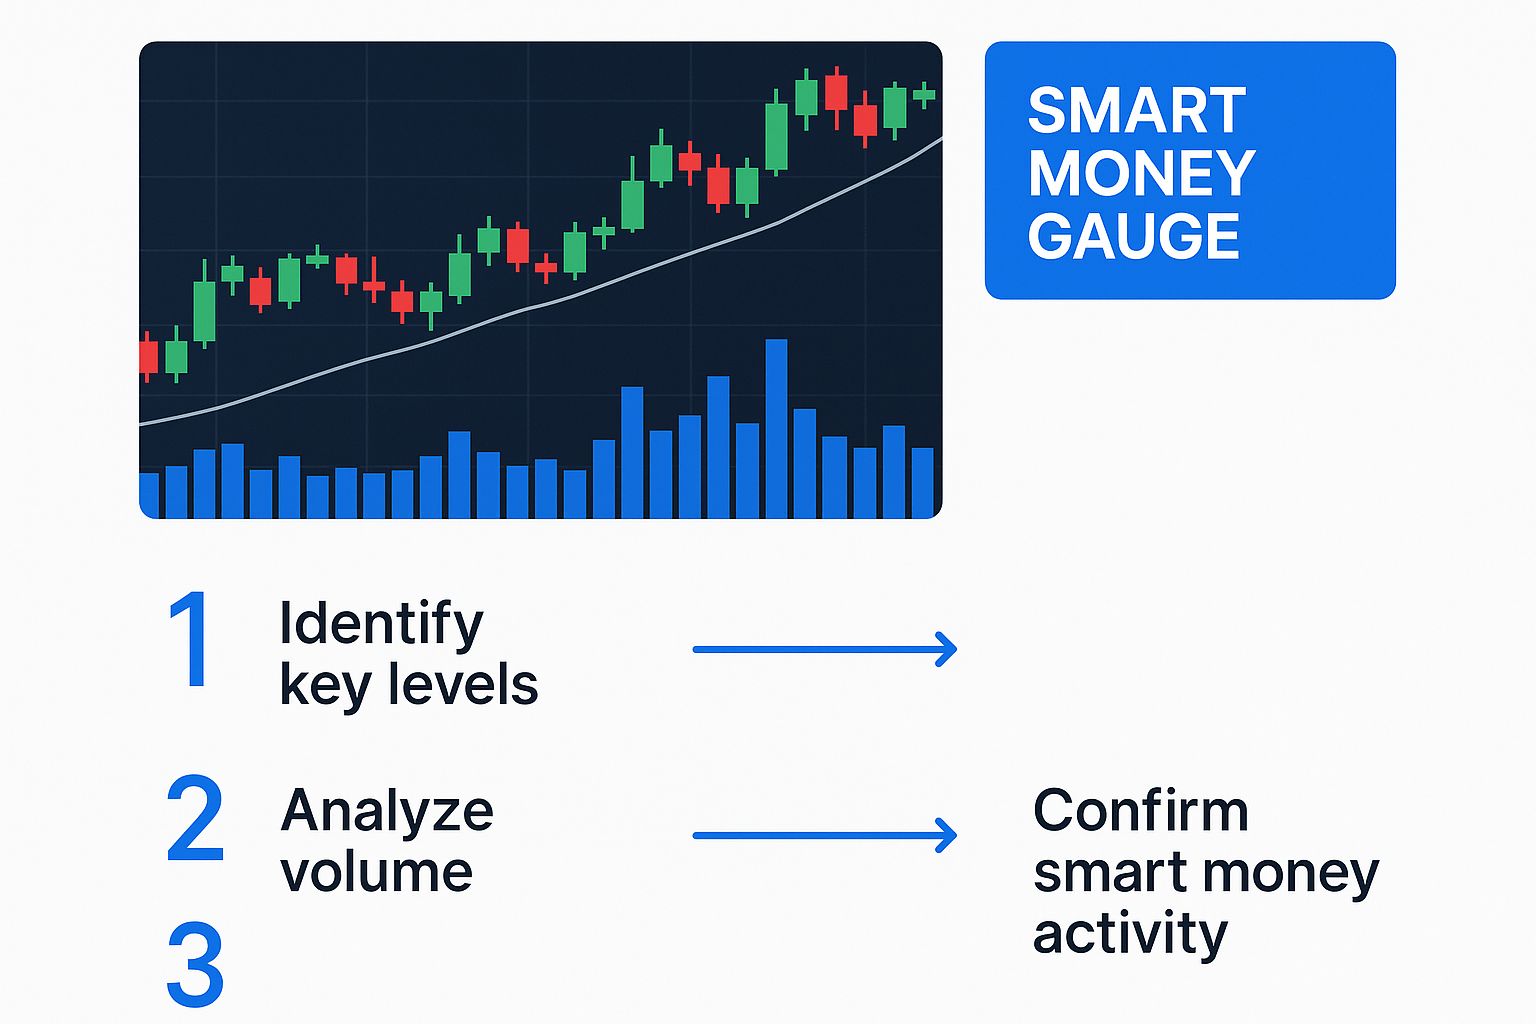
As you can see, the indicator processes raw price and volume data to produce a clear, actionable signal about market pressure, often helping traders spot what the big institutions are doing.
For a quick reference, here’s a simple breakdown of what the Chaikin Money Flow Index is all about.
Chaikin Money Flow Index at a Glance
| Component | Description | What It Indicates |
|---|---|---|
| Indicator Type | Volume-Weighted Oscillator | Measures the balance of buying and selling pressure. |
| Creator | Marc Chaikin | A well-respected analyst in the technical trading world. |
| Typical Period | 20 or 21 days | A standard lookback period for medium-term trend analysis. |
| Value Range | Oscillates between +1 and -1 | Crosses above/below zero signal shifts in momentum. |
| Core Inputs | Price (High, Low, Close) & Volume | Combines price action with trading activity for a fuller picture. |
This table neatly summarizes the key aspects, making it easy to understand the tool's fundamental purpose and design at a glance.
The Core Purpose of CMF
At its heart, the Chaikin Money Flow Index tries to answer one of the most important questions a trader can ask: Is the "smart money"—the big institutional players—buying this stock (accumulation) or selling it (distribution)?
Marc Chaikin built the indicator on a simple but profound observation about daily price action.
A stock that consistently closes in the upper half of its daily trading range shows signs of accumulation. A stock that closes in the lower half suggests distribution. CMF takes this idea and amplifies it with volume.
This is the entire foundation of the indicator. The CMF line itself oscillates between +1 (maximum buying pressure) and -1 (maximum selling pressure).
- Positive CMF Values: When the indicator is above the zero line, it tells you that buying pressure is winning. A sustained reading above zero is a strong confirmation of an ongoing uptrend.
- Negative CMF Values: When the CMF dips below zero, it suggests sellers have taken control. Consistently negative readings often confirm that a downtrend is in place.
As a general rule of thumb, a 20-day CMF that stays above zero often points to bullish market conditions. For example, during the massive S&P 500 bull run from March 2009 to February 2020, the 20-day CMF was frequently positive, reflecting the persistent institutional buying that fueled the market. For more on these kinds of correlations, check out the data over at MarketInOut.com.
Diving Into the CMF Calculation
To really get a feel for the Chaikin Money Flow index, you have to pop the hood and see how the engine works. That smooth line you see on your chart might look simple, but it's the result of a clever, multi-step process that merges price action with trading volume to get a read on market pressure.
Breaking down the CMF formula shows you how it builds from a single day's trading activity into a smoothed-out indicator. This isn't just about crunching numbers; it's about turning trader behavior into a single, usable value. It all boils down to three core steps.
Step 1: The Money Flow Multiplier
The heart of the entire calculation is the Money Flow Multiplier. This first piece of the puzzle figures out if a given day was dominated by buyers or sellers. How? By simply looking at where the stock closed within its high-to-low range for that day.
The formula looks like this:
Money Flow Multiplier = [(Close - Low) - (High - Close)] / (High - Low)
- A positive result (moving toward +1) tells you the stock closed near its high. That’s a sign of strong buying pressure.
- A negative result (dropping toward -1) means the stock closed near its low, showing that sellers were in control.
- A result right around zero points to indecision, with the closing price sitting near the middle of the day's range.
Think of it as a daily scorecard for the battle between the bulls and bears. The closing price tells you who won the day's fight.
Step 2: Calculating Money Flow Volume
Okay, so the Money Flow Multiplier gives us direction, but it's missing a key piece of context. A strong close near the highs is one thing, but it’s a whole lot more meaningful if it happened on a day with huge trading volume. That's where Money Flow Volume comes in.
To get this number, you just multiply the day's multiplier by its trading volume.
Money Flow Volume = Money Flow Multiplier x Volume for the Period
This step gives weight to the multiplier. A day with high conviction (a multiplier near +1 or -1) that's backed by heavy volume will spit out a big Money Flow Volume number, signaling a powerful move. On the flip side, a quiet day with low volume will barely move the needle, effectively filtering out the market noise.
Step 3: Putting It All Together for the CMF Index
The last step is to smooth out all these daily readings over a specific period—typically 20 days—to create the CMF line you actually see on your chart.
Here’s the final formula for the chaikin money flow index:
CMF = (20-Day Sum of Money Flow Volume) / (20-Day Sum of Volume)
By adding up the Money Flow Volume over the last 20 days and dividing it by the total volume over that same period, you get a single oscillator value that floats above or below zero. This rolling calculation keeps the CMF line updated with each new trading day, giving you a continuous gauge of institutional buying and selling pressure.
Key Takeaway: The CMF isn't just another volume indicator. It’s a volume-weighted price indicator. It looks at where the price closes within the daily range and then uses volume to tell you just how significant that close really was.
Let's run through a quick, one-day example to see it in action.
Example Calculation:
- High: $110
- Low: $100
- Close: $108
- Volume: 1,000,000 shares
- Money Flow Multiplier: [($108 - $100) - ($110 - $108)] / ($110 - $100) = [8 - 2] / 10 = +0.6
- Money Flow Volume: 0.6 x 1,000,000 = 600,000
This positive value of 600,000 would then get added to the running total of the previous 19 days' Money Flow Volumes. That entire sum is then divided by the total 20-day volume to plot the CMF value for that day.
Interpreting CMF Signals Like a Pro
Knowing how to calculate the Chaikin Money Flow is one thing, but translating that squiggly line into real market intelligence is a completely different ballgame. The CMF isn’t just spitting out a number; it’s telling a story about the constant tug-of-war between buyers and sellers. Once you learn to read its signals, you can start to see what the "smart money" is up to and get a jump on potential market shifts.
The CMF gives you three core signals, each adding another layer to your analysis. The most basic is the zero-line crossover, followed by the actual value of the CMF reading, and finally, the most powerful of them all—divergence. Getting these down will give you a serious edge.
The Zero-Line Crossover
The simplest, most fundamental signal you'll get from the CMF is its relationship to the zero line. Think of this centerline as a clear divider between bullish and bearish territory.
-
Bullish Crossover: When the CMF line punches up through the zero line, moving from negative to positive, it’s a sign that buying pressure is starting to win out. This can be an early confirmation that an uptrend is either forming or getting stronger.
-
Bearish Crossover: On the flip side, when the CMF drops below zero into negative territory, it’s a clue that sellers are taking charge. This can confirm a new downtrend or suggest an existing uptrend is running out of gas.
It helps to think of the zero line as the 50-yard line in a football game. A crossover tells you which team just took control of the ball and is starting to push downfield.
Reading the Magnitude of CMF
Beyond just crossing the line, the distance of the CMF from zero tells you about the conviction behind a move. A CMF value that’s just barely positive suggests some weak buying pressure, but a strong, high reading shows powerful accumulation is underway.
Most traders have a couple of key thresholds they watch for to gauge this strength. While you can tweak these, a common way to read it is:
- Strong Buying Pressure: A CMF reading that stays consistently above +0.05 points to a healthy and robust uptrend.
- Strong Selling Pressure: A CMF reading hanging out below -0.05 suggests significant distribution and a strong downtrend.
When you see the CMF hovering in that neutral zone between +0.05 and -0.05, it often means you're in a choppy, sideways market where neither side has a clear advantage. Watching for the CMF to break out of this range can be your heads-up that a new, decisive trend is starting.
The Power of CMF Divergence
Now for the most advanced—and often most predictive—signal from the CMF: divergence. This happens when the direction of the CMF indicator disagrees with the direction of the price. Spotting a divergence can be a powerful early warning that a trend is losing steam and might be about to reverse.
Divergence is essentially the market's way of whispering that the underlying momentum doesn't support the headline price action. Ignoring this subtle hint is one of the most common mistakes traders make.
There are two kinds of divergence you need to keep an eye out for:
-
Bearish Divergence: This is a major red flag. It happens when the price pushes to a new high, but the CMF fails to do the same, instead carving out a lower high. This tells you that even though the price is climbing, the buying pressure is actually fading—a downward reversal could be right around the corner.
-
Bullish Divergence: This is a classic bottom-fishing signal. It occurs when the price drops to a new low, but the CMF makes a higher low. It suggests that selling pressure is drying up and accumulation might be starting under the surface, even as the price looks weak.
Seasoned traders use CMF divergence alongside price action because it can foreshadow major turning points. For instance, in late 2019, the NASDAQ Composite was hitting all-time highs, but the 20-day CMF was showing lower and lower peaks. That divergence correctly hinted at the 10% correction that followed in early 2020. You can dig into more historical examples and data on platforms like MarketInOut.com. Learning to spot these subtle disagreements is what separates the pros from the rest.
Actionable Trading Strategies Using CMF
Knowing what the Chaikin Money Flow index is telling you is one thing, but turning those signals into actual trades is where the rubber meets the road. This is where we move from theory to practice. Let’s walk through three practical strategies you can use, leveraging the CMF to sharpen your timing and boost your confidence. We’ll start simple and build up from there.
Strategy 1: Trend Confirmation
The most straightforward way to use the CMF is as a simple trend-confirmation tool. Price action alone can sometimes fool you; a strong-looking rally can easily fizzle out if there isn't enough buying pressure to keep it going. The chaikin money flow index acts as your BS detector, confirming that real money is backing the move.
Here’s the game plan:
-
For Long (Buy) Trades: Find a stock in a clear uptrend, making higher highs and higher lows. Then, check the CMF. You want to see it consistently above the zero line, ideally holding strong above +0.05. This combination tells you the uptrend is healthy and fueled by real accumulation.
-
For Short (Sell) Trades: Spot a downtrend with lower lows and lower highs on the chart. Your confirmation comes from a CMF that’s firmly in negative territory, preferably below -0.05. This signals that sellers are in control and validates the downward momentum.
This strategy is your first line of defense against "fakeouts"—those frustrating price moves that look promising but reverse course because there’s no volume behind them.
Strategy 2: Trading Divergences
Divergence trading is a more advanced technique, but it can produce some of the most powerful signals the CMF has to offer. As we touched on earlier, a divergence happens when the indicator zigs while the price zags, often flagging a potential reversal just around the corner.
A bearish divergence, where the price hits a new high but the CMF makes a lower high, is a classic warning shot. It suggests the buying frenzy is losing steam and the "smart money" might be quietly heading for the exits.
Here's a simple framework for trading these setups:
- Identify the Divergence: Scan for that clear disagreement. For a bullish setup, the price needs to make a new low while the CMF carves out a higher low. For a bearish setup, it's the opposite.
- Wait for Price Confirmation: This is critical. Never jump into a trade on the divergence alone. For a bullish divergence, wait for the price to actually break above a recent swing high or a key resistance level. This proves the reversal has legs.
- Set Your Entry and Stops: Once the price gives you the green light, you can enter. Place your stop-loss just below the recent price low for a long trade (or above the high for a short) to keep your risk in check.
Patience is key here. Divergences can take time to play out, so always wait for the price to validate what the indicator is whispering to you.
Strategy 3: Combining CMF with Other Indicators
The CMF really shines when it’s part of a team, not a solo act. Pairing it with other technical indicators helps filter out false signals and dramatically increases the probability of a winning trade. Two of its best partners are Moving Averages and the Relative Strength Index (RSI).
For traders looking to expand their toolkit, understanding how stock options work can open new avenues for actionable trading strategies, where CMF signals on underlying assets can provide valuable insights for informed decisions.
Let's look at a high-probability setup using a Moving Average:
- The Setup: A stock has been in a clear downtrend, trading below its 50-day moving average.
- The Signal: The CMF suddenly crosses above the zero line, hinting that buying pressure is quietly starting to build under the surface.
- The Trigger: A few days later, the price makes a decisive break above the 50-day moving average.
This combination creates a powerful entry signal. The CMF gave you the early warning that momentum was shifting, and the moving average crossover confirmed the trend had officially turned. Remember, volume is the fuel that moves the market. Combining price tools with a volume-based indicator like the CMF gives you a much more complete picture of what's really happening.
For a deeper dive, check out our guide on https://chartswatcher.com/pages/blog/trading-with-volume-a-modern-guide-to-market-analysis.
Common Pitfalls When Using the CMF
While the Chaikin Money Flow index is a fantastic tool for getting a read on market pressure, it’s far from foolproof. Like any technical indicator, it has its weak spots. Knowing these limitations isn’t just a good idea—it’s absolutely essential if you want to avoid costly trading mistakes.
Thinking of the CMF as some kind of crystal ball is a recipe for disaster. Its signals are most powerful when they confirm what you’re seeing elsewhere in your analysis, not when they’re used in a vacuum. Let's break down the common traps so you can use the CMF as the sharp, supportive tool it was meant to be.
The Problem of Whipsaws in Choppy Markets
The CMF’s greatest strength—its sensitivity to price and volume—can turn into a major liability under the wrong market conditions. When a stock is just bouncing around in a choppy, range-bound market with no clear trend, the indicator is notorious for spitting out frequent, misleading signals.
This frustrating phenomenon is called whipsawing. You’ll see the CMF line dart above and below the zero line, signaling shifts in buying or selling pressure that never actually develop into a real trend. If you try to trade every one of these crossovers, you’ll likely get stopped out over and over, draining both your capital and your confidence.
The most reliable CMF signals pop up during clear, trending phases. In sideways or directionless markets, its readings should be treated with extreme caution, as the noise-to-signal ratio goes through the roof.
Understanding It Is a Lagging Indicator
It’s crucial to remember that the CMF is a lagging indicator. By its very design, it's calculated using past data, typically from the last 20 periods. This means it will always be a step behind what’s happening with the price right now.
This built-in lag can cause you to jump into a trade after a big chunk of the move has already played out. For example, by the time the CMF finally confirms a strong uptrend by moving decisively above zero, the price might already be overextended and ripe for a pullback. This is exactly why it should never be your primary trigger for entering a trade.
How Price Gaps Distort CMF Readings
One of the biggest—and most overlooked—pitfalls is how large price gaps can throw off the CMF calculation. A significant gap up or down, often happening overnight between trading sessions, can create a seriously distorted reading for that day.
Because the formula is so dependent on the session's high, low, and close, a big gap can artificially inflate or deflate the Money Flow Multiplier.
- Gap Up: A stock might gap up big at the open but then sell off for the rest of the day, closing near its session low. The CMF calculation would register this as strong selling pressure, totally ignoring the fact that the overall price move was positive.
- Gap Down: On the flip side, a stock could gap down and then rally hard to close near the session high. This would produce a bullish CMF reading, completely masking the significant overnight drop.
This kind of distortion can mess up the 20-day average and feed you a misleading signal that doesn't reflect the true underlying money flow. Always glance at the chart for recent gaps when you're looking at the CMF.
While its blend of price and volume is a staple in technical analysis, its reliability can vary. For instance, a 2023 analysis showed that pairing the CMF with trend-following indicators boosted the win rate for long trades on the FTSE 100 to 63%, a nice jump from 55% when used alone. You can discover more insights on how different indicators work together on GoCharting.com. This just hammers home its true role: it’s a confirmation tool, not a standalone signal generator.
How to Customize the CMF Indicator
The Chaikin Money Flow index is a fantastic tool right out of the box, but it’s definitely not a one-size-fits-all solution. To really make it work for you, you need to pop the hood and tune it to match your specific trading style, the assets you trade, and your typical holding period.
The single most important tweak you can make is adjusting the look-back period. The default is almost always 20 periods, but you should think of that as just a starting point. It’s like focusing a camera lens—a small adjustment can bring a totally different picture into view, helping you either sharpen your focus on short-term action or smooth out the noise for a bigger-picture perspective.
Finding the Right Look-Back Period
When you’re tinkering with the CMF period, you're essentially balancing two competing forces: sensitivity versus smoothness. There’s no magic number here. The "best" setting is whatever works for your strategy.
-
Shorter Period (e.g., 10-14): This setting makes the CMF line more responsive, reacting quickly to the latest price and volume data. A day trader, for instance, might use a shorter period to jump on quick momentum shifts. The trade-off? You'll see more false signals and get "whipsawed" in choppy, sideways markets.
-
Longer Period (e.g., 30-50): This smooths out the CMF line, making it less erratic. A long-term investor analyzing a blue-chip stock would prefer this, as it filters out the daily market chatter and highlights the major, underlying trend of accumulation or distribution. The downside is lag. The indicator will be slower to signal that a trend is changing.
Key Takeaway: Let your trading horizon be your guide. Shorter timeframes need faster signals, while longer-term strategies benefit from smoother, more reliable data.
The CMF setting isn't just about your trading style; it's also about what you're trading. A highly volatile asset, like a popular cryptocurrency, might actually need a longer look-back period to iron out its wild price swings and give you a clearer signal. On the flip side, a stable, low-volatility utility stock might work better with a shorter period to detect subtle shifts in money flow that would otherwise go unnoticed.
To help visualize this trade-off, here’s a quick comparison of how different look-back periods impact the CMF's behavior.
CMF Look-Back Period Comparison
| Look-Back Period | Sensitivity | Signal Lag | Best For |
|---|---|---|---|
| Short (e.g., 9-14) | High | Minimal | Day trading, scalping, and catching quick momentum shifts. |
| Standard (e.g., 20-21) | Medium | Moderate | Swing trading and general trend analysis; a balanced approach. |
| Long (e.g., 30-50) | Low | Significant | Long-term investing and identifying major market trends. |
As you can see, there’s a clear give-and-take. A shorter period gives you speed at the cost of reliability, while a longer period offers reliability at the cost of speed.
Ultimately, the goal is to experiment. Try out different settings on the assets you trade and see what feels right. By testing various periods, you can dial in the Chaikin Money Flow index until it perfectly matches the natural rhythm of your chosen market, transforming it into a much more precise and dependable part of your trading toolkit.
Chaikin Money Flow Index FAQ
It's natural to have questions when you're getting to grips with a new indicator. To clear up any lingering confusion and help you use the CMF with more confidence, we've put together answers to some of the most common questions we hear.
What Is the Difference Between CMF and the Money Flow Index (MFI)?
This is a great question because their names are so similar, but they operate very differently. Think of the Chaikin Money Flow as a pure accumulation and distribution gauge. Its entire calculation hinges on where an asset's price closes within its high-low range for the day, which tells you a lot about the conviction behind a move.
The Money Flow Index (MFI), on the other hand, is basically a volume-weighted version of the Relative Strength Index (RSI). It creates an oscillator that fluctuates between 0 and 100 by comparing periods of positive money flow to negative money flow. Its main job is to flag potential overbought and oversold conditions, much like the RSI does.
Can Chaikin Money Flow Be Used for Day Trading?
Absolutely. The Chaikin Money Flow index can be a solid part of a day trader's toolkit, but you can't use it straight out of the box. The standard 20-period setting is just too slow for the rapid-fire nature of intraday charts.
Day traders usually dial that look-back period down to somewhere between 9 and 14. This makes the indicator far more responsive to the quick momentum shifts you see on shorter timeframes. Just remember, a more sensitive setting also picks up more market noise, making it crucial to use other indicators to help filter out any false signals.
What Are the Best Indicators to Use with CMF?
The CMF is a team player, not a solo act. Its signals become much more reliable when you get confirmation from other tools that analyze the market from a different angle. This multi-indicator approach is key to avoiding whipsaws and building a robust strategy.
Some of the best partners for the CMF include:
- Moving Averages: These are perfect for confirming the overall trend. A CMF cross above the zero line is a much stronger buy signal if the price is already trading above a key moving average, like the 50-day.
- Relative Strength Index (RSI): The RSI adds context by showing you overbought or oversold levels. Imagine spotting a bullish CMF divergence while the RSI is just starting to climb out of oversold territory—that's a high-conviction setup.
- Bollinger Bands: These are great for gauging volatility. When the price is pushing against the upper or lower band, it gives context to what the CMF is telling you about buying or selling pressure.
The goal is to build a system where different, non-correlated indicators all point to the same conclusion. When your trend, momentum, and volume indicators are all in agreement, the probability of a successful trade goes up dramatically.
Ready to put the Chaikin Money Flow index to the test? ChartsWatcher gives you a powerful, customizable platform built for traders who are serious about their analysis. You can create your own tailored screen setups, set hyper-specific alerts, and backtest your strategies to find your edge. Explore what ChartsWatcher can do for you today.
