Master the Candlestick Engulfing Pattern: Trader's Essential Guide
The candlestick engulfing pattern is one of the most powerful two-candle reversal signals you'll find on a chart. It’s a clear visual cue that the market's momentum might be about to shift, hard. At its core, the pattern happens when a larger candlestick’s body completely swallows, or engulfs, the body of the smaller candle right before it. This tells you the previous trend is running out of gas.
The Foundation of Engulfing Patterns
Picture a tug-of-war between buyers and sellers. For a moment, one side is making slow, steady progress, represented by a small candle. Then, out of nowhere, the opposing team gives a massive heave that completely overwhelms the other side. That sudden, powerful pull is your engulfing candle. This visual conflict playing out on your chart tells a compelling story about a potential power shift in the market.
This pattern is a cornerstone of technical analysis because it’s not just a hint—it’s a loud declaration. Unlike single-candle patterns that can sometimes be ambiguous, the two-candle structure of an engulfing pattern gives you a bit more confirmation. The first candle shows you the trend that was, and the second, engulfing candle shows a decisive, often aggressive, rejection of that trend. If you're serious about reading charts, mastering this pattern is a must. For a deeper dive into the basics, check out our guide on understanding candlestick charting for better trading.
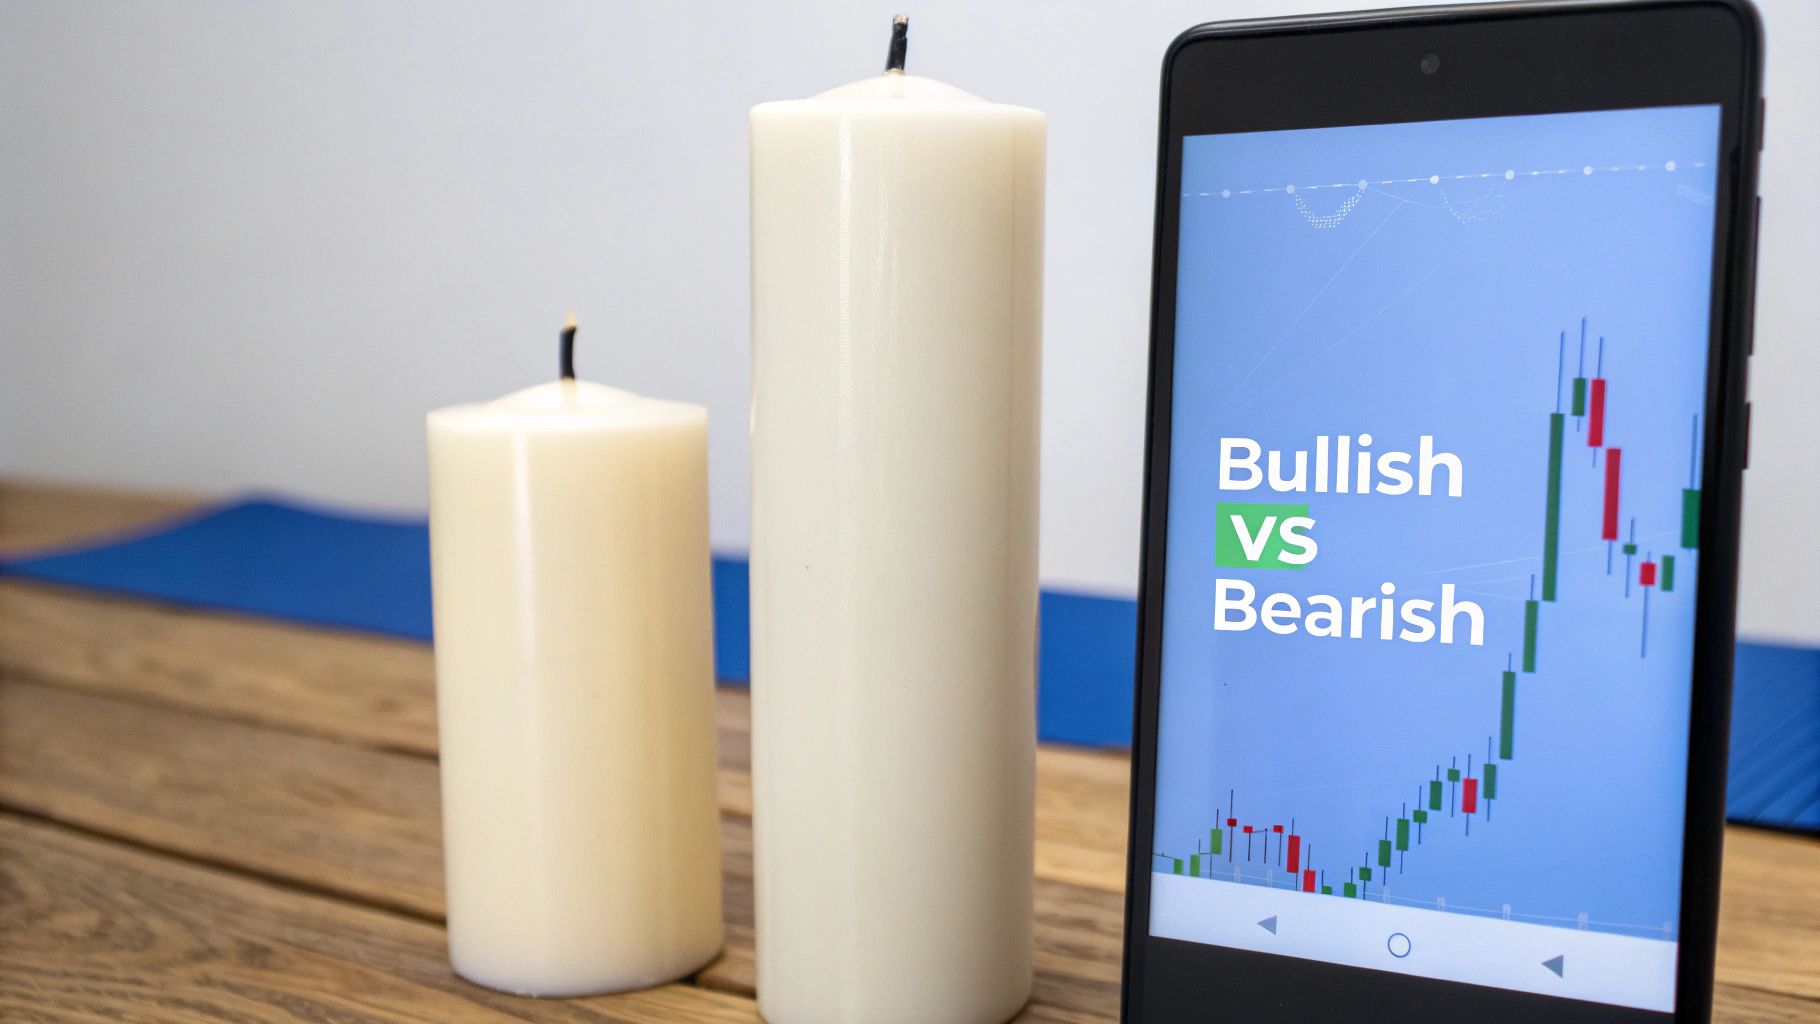
Bullish vs. Bearish Variations
The engulfing pattern shows up in two flavors, each pointing in the opposite direction:
- The Bullish Engulfing Pattern: This one pops up at the bottom of a downtrend. You’ll see a small bearish (red) candle, followed by a large bullish (green) candle that completely wraps around the prior candle's body. It’s a signal that buyers have stormed the field, overwhelming sellers and suggesting a potential rally.
- The Bearish Engulfing Pattern: This is the bullish pattern's evil twin, appearing at the top of an uptrend. It's a small bullish (green) candle that gets completely dwarfed by a larger, subsequent bearish (red) candle. This is a big red flag that sellers have wrestled control away from buyers, hinting that prices might be headed down.
To help you quickly spot the difference, here’s a simple breakdown of their defining features.
Bullish vs Bearish Engulfing Pattern at a Glance
| Characteristic | Bullish Engulfing Pattern | Bearish Engulfing Pattern |
|---|---|---|
| Location | Appears after a downtrend | Appears after an uptrend |
| First Candle | Bearish (Red) | Bullish (Green) |
| Second Candle | Bullish (Green) and larger | Bearish (Red) and larger |
| What It Signals | Potential upward reversal (buy signal) | Potential downward reversal (sell signal) |
| Psychology | Buyers have overwhelmed sellers | Sellers have overwhelmed buyers |
This table makes it easy to compare the two patterns side-by-side, but the real key is understanding the context—where the pattern appears in a trend is everything.
Historically, both patterns have proven to be reliable signals, especially when they form after a clear, established trend. Their predictive power isn’t just anecdotal; it's something traders have observed and tested for years.
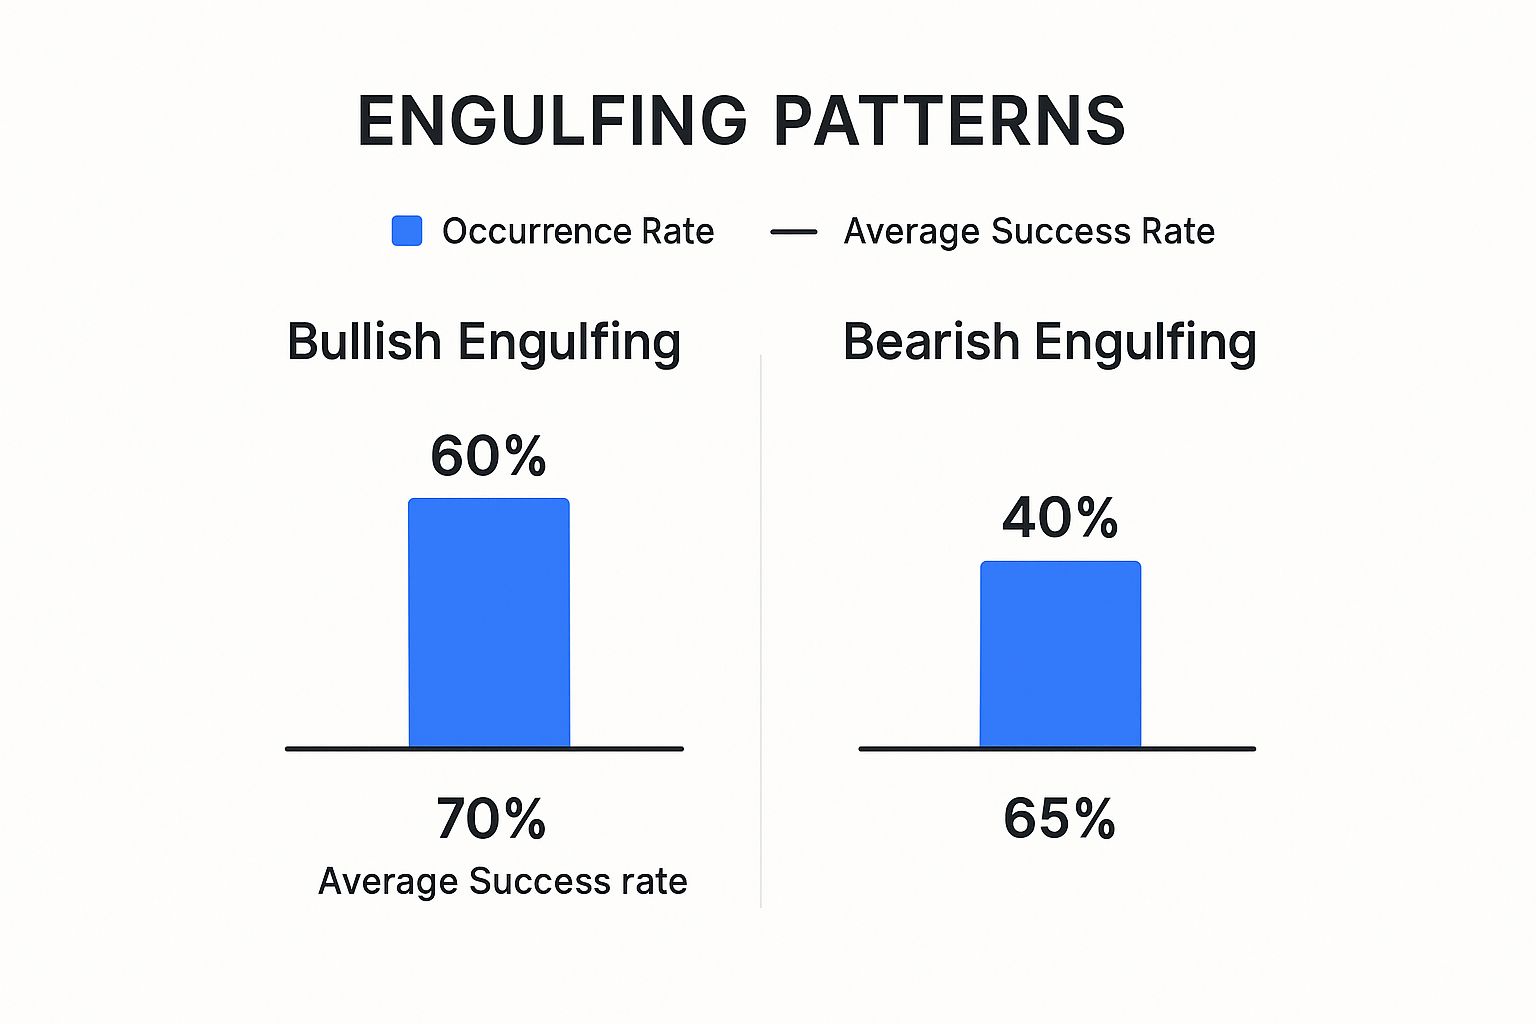
The data here shows that while you might see bullish patterns a bit more often, both variations pack a serious punch with a strong historical success rate. That makes them an incredibly valuable tool to have in your trading arsenal.
Decoding the Bullish Engulfing Pattern
The bullish engulfing pattern tells a fantastic story about a power struggle in the market. Picture this: a stock is in a clear downtrend. The sellers (bears) are in the driver's seat, pushing prices lower and lower. This action creates a small, bearish red candle, reflecting that same old selling pressure.
Then, out of nowhere, the tide turns. The next candle is a big, bold, bullish green one. This isn't just a tiny bounce. It opens at or even below the prior day's close and rallies to close well above the prior day's open, completely swallowing the previous candle's body. This is the moment the buyers (bulls) staged a decisive coup, overwhelming the sellers and signaling that the downtrend might finally be exhausted. It’s a powerful visual of pessimism giving way to sudden, aggressive optimism.
Key Criteria for Identification
To make sure you're looking at a genuine bullish engulfing pattern and not just random noise, you need to check a few specific boxes. Getting these details right is what separates a high-probability signal from a fakeout.
- Established Downtrend: The pattern has to show up after prices have been falling for a while. Its real power is in reversing an existing bearish move.
- First Candle is Bearish: The first of the two candles absolutely must be red (bearish). This confirms that sellers were still in control right before the reversal.
- Second Candle is Bullish: The second candle has to be green (bullish) and noticeably larger than the first.
- Complete Engulfment: The body of the second (green) candle must completely envelop the body of the first (red) one. While the wicks or shadows are good to note, it's the full engulfment of the bodies that truly matters.
Key Takeaway: A bullish engulfing pattern is more than just a couple of candles. It’s a narrative of a failed attempt by sellers to push prices down, immediately followed by an aggressive surge from buyers. The bigger that second candle is, the more conviction is behind the reversal.
As one of the most respected reversal indicators in technical analysis, the bullish engulfing pattern carries some statistical weight. At its core, it's a small bearish candle followed by a larger bullish candle that completely envelops the body of the first. Research suggests this pattern has shown roughly a 65% success rate in predicting price increases when it forms at the bottom of a downtrend—a significant figure in any major market.
This pattern is a foundational piece of the technical trading puzzle and just one of several potent reversal signals. If you're looking to build out your charting skills, you should also read also our guide on 7 candlestick reversal patterns every trader should know for a more complete arsenal.
Mastering the Bearish Engulfing Pattern

While the bullish engulfing pattern signals a potential new dawn for buyers, its counterpart, the bearish engulfing pattern, is a warning of a coming storm. It’s the market’s way of saying that a powerful uptrend may have just smashed into a brick wall of selling pressure.
Think of it as a party that’s been going strong, only for the music to abruptly stop and the lights to turn on. The mood shifts in an instant.
This pattern tells a story of a dramatic power shift from buyers to sellers. For a period, bullish momentum has been pushing prices higher, creating a small green (bullish) candle. Then, in the very next session, sellers show up with overwhelming force. A massive red (bearish) candle forms, opening at or above the previous day's close and then plummeting to finish well below its open, completely swallowing the prior bullish candle.
This isn't just a minor dip; it's a statement of intent from the sellers. It suggests the optimism driving the uptrend has been decisively crushed by a wave of selling—a potential market top and a flashing light for short-sellers.
Identifying a Valid Bearish Engulfing Pattern
Spotting a true bearish engulfing pattern requires more than just seeing a big red candle next to a small green one. Precision is what separates a high-probability reversal signal from simple market noise. A valid pattern has to meet specific criteria.
Here’s what you need to confirm before you even think about acting on it:
- A Preceding Uptrend: The pattern's power comes from its context. It must appear after a clear and sustained move higher to have any meaning as a reversal signal.
- A Bullish First Candle: The first candle has to be green (bullish), showing that buyers were still in control right before the tables turned.
- A Bearish Second Candle: The second candle must be red (bearish) and significantly larger than the first, demonstrating a powerful and sudden shift in sentiment.
- Total Body Engulfment: The real body of the red candle must completely engulf the real body of the preceding green candle. It’s the open-to-close action that tells the real story here.
The bearish engulfing pattern is a visual representation of market confidence shattering. When a small candle of optimism is completely overwhelmed by a large candle of pessimism, it’s a strong signal that the bears have seized control.
The Psychology Behind the Reversal
At its core, the bearish engulfing pattern is all about a rapid, visceral change in market psychology. The small green candle shows buyers are still confident, pushing the price up, but perhaps with less conviction than before. The advance is looking a little tired.
The large red candle that follows reveals a dramatic plot twist. It shows that sellers entered the market with such aggressive force that they not only erased the previous session's gains but also drove prices significantly lower. This sudden and aggressive selling often triggers a cascade effect, as bullish traders who were feeling good just a day before now rush to exit their positions to avoid losses.
This rapid psychological flip from greed to fear is exactly what makes the bearish engulfing pattern such a potent reversal signal.
How to Trade the Engulfing Pattern Profitably
Spotting an engulfing pattern is just the beginning. Turning that signal into a profitable trade requires a clear, disciplined strategy. If you just jump on every engulfing candle you see, you’re setting yourself up for a world of pain. A solid framework—covering your entry, risk, and getting confirmation from other tools—is what separates successful traders from the rest.
A common entry for a bullish engulfing pattern is to place a buy order just a tick above the high of that big green candle. For a bearish engulfing pattern, you’d look to place a sell or short order just below the low of the big red candle. This approach makes sure the market is starting to move in your favor before you put any capital on the line.
But remember, trading is a game of probabilities, not certainties. This is where getting confirmation becomes your best friend, helping you filter out the weak signals and stack the odds in your favor.
Building a Confirmation Checklist
Never, ever trade a pattern in isolation. Think of the engulfing pattern as a strong hint from the market; your job is to get a second opinion from your other indicators. A good confirmation checklist can dramatically improve your trade probability.
Here are three key things to check before you even think about hitting the buy or sell button:
- Volume Analysis: A high-probability engulfing pattern needs to have a noticeable spike in trading volume, especially on that second, engulfing candle. This surge in volume is your proof that there’s real money and conviction behind the reversal. If you see low volume, it suggests nobody is really committed, making the signal far less reliable.
- Moving Averages: Where the pattern shows up in relation to key moving averages (like the 50-day or 200-day) gives you critical context. A bullish engulfing pattern gets a massive boost in credibility if it forms right on a major moving average that's acting as support. On the flip side, a bearish engulfing pattern is much more powerful if it appears as the price gets rejected from a key moving average acting as resistance.
- RSI for Confirmation: The Relative Strength Index (RSI) is a fantastic tool for measuring momentum. For a bullish engulfing pattern, you want to see the RSI climbing out of oversold territory (below 30). For a bearish pattern, check if the RSI is rolling over from overbought territory (above 70). An even more powerful signal is RSI divergence: price makes a new low, but the RSI makes a higher low right before a bullish engulfing pattern forms. That’s a classic sign that sellers are running out of steam.
Setting Stops and Targets
Proper risk management is completely non-negotiable. This is what protects your capital and ensures that one bad trade doesn't blow up your account.
Trading Guideline: Always know your exits before you enter a trade. This takes the emotion out of the equation when your money is on the line.
Here’s a practical way to set your stop-loss and take-profit levels:
- Stop-Loss Placement: For a long trade on a bullish engulfing pattern, your stop-loss goes just below the low of the engulfing candle. For a short trade on a bearish pattern, place it just above the high of the engulfing candle. This clearly defines your maximum risk if the trade goes against you.
- Take-Profit Targets: A good rule of thumb is to aim for a risk-to-reward ratio of at least 1:2. That means if you're risking $1 per share on the trade, your target should be a $2 gain, at minimum. Look at the chart and identify the next significant level of resistance (for long trades) or support (for short trades) and set that as your first profit target.
Common Mistakes and How to Avoid Them
Even with a solid grasp of the engulfing pattern, many traders stumble over the same preventable mistakes. These errors usually boil down to ignoring market context, misjudging risk, or treating the pattern like an infallible crystal ball instead of just one piece of a much larger puzzle. Learning to sidestep these common pitfalls is what separates consistently profitable traders from the rest.
The biggest mistake? Trading the pattern completely out of context. An engulfing candle that shows up in the middle of a messy, sideways market is mostly just noise. It has real predictive muscle only when it appears at a logical turning point—like the very top of a clear uptrend or the bottom of a sustained downtrend.
Trading Every Pattern You See
It's incredibly tempting to jump on every single engulfing pattern that pops up on your screen. Don't do it. This is a surefire recipe for disaster.
Not all patterns are created equal, and a disciplined trader knows how to filter out the low-probability junk. You need to focus only on the A+ setups that meet your strictest criteria.
This is where data becomes your best friend. In a massive quantitative study across 4,120 markets, researchers crunched the numbers on 426,665 engulfing patterns. They found that, on average, one appears every 37 candles. That frequency alone tells you that you have to be selective. The same study revealed that while the pattern does signal the right direction about 67.3% of the time, a staggering 97.1% of them retrace to retest the entry price. You can see the full breakdown by exploring the complete engulfing pattern performance study on PatternsWizard.com.
This data drives home a critical lesson: successful trading isn't about being right 100% of the time. It's about having a statistical edge that plays out over hundreds of trades. By patiently waiting for high-quality setups confirmed by other factors, like a surge in volume or a bounce off a key support level, you're putting the odds in your favor.
Ignoring Candle Size and Risk
Another classic rookie error is getting mesmerized by the size of the engulfing candle itself. Sure, a massive candle can look like a powerful sign of market conviction, and often it is. But it also creates a huge practical problem: a terrible risk-to-reward ratio.
Think about it. If the engulfing candle is abnormally large, your stop-loss (placed below its low for a bullish setup or above its high for a bearish one) has to be incredibly far from your entry. This forces you to shoot for a massive profit target just to make the trade worthwhile—a target the market might never hit.
Trader's Rule: The candlestick engulfing pattern is a signal, not a guarantee. Its reliability depends entirely on the market context in which it appears.
To avoid this trap, keep these practical tips in mind:
- Avoid Chasing Giants: If an engulfing candle is dramatically larger than the recent price action, it’s often smarter to just sit on your hands and skip the trade. The risk is probably not worth the potential reward.
- Look for Confirmation: Never, ever trade the pattern in a vacuum. Always demand confirmation from other tools in your arsenal, whether it's an RSI divergence, a spike in volume, or proximity to a major moving average.
- Respect the Broader Trend: A bullish engulfing pattern is infinitely more reliable when it appears as a reversal of a minor pullback within a larger, established uptrend. The same logic holds true for bearish patterns in a bigger downtrend.
Still Have Questions About Engulfing Patterns?
Once traders start putting the engulfing pattern to work, a few common questions almost always pop up. Let's tackle them head-on with some practical, no-nonsense answers. Getting these details straight is what separates traders who use this pattern confidently from those who get tripped up by the nuances.
Think of this as your cheat sheet for mastering the engulfing pattern in the real world.
What’s the Main Difference Between an Engulfing and a Harami Pattern?
While they're both two-candle reversal signals, the engulfing and harami patterns tell completely opposite stories about market psychology.
Imagine a boxing match. The candlestick engulfing pattern is a decisive knockout punch. The second candle's body completely overwhelms and swallows the first, signaling a sudden, powerful shift in who's in control. The momentum has violently changed hands.
The harami pattern, on the other hand, is a sign of a fighter getting tired. The name means "pregnant" in Japanese, which is a perfect visual: a large candle is followed by a much smaller one tucked inside it. This shows the old trend is running out of steam and hitting a wall, but it doesn't have the same aggressive reversal force you see in an engulfing pattern.
How Reliable Is the Engulfing Pattern on Its Own?
This is a big one. An engulfing pattern is a strong clue, but you should never, ever trade it in isolation. Relying on the pattern alone without any other supporting evidence is one of the fastest ways for new traders to lose money.
Key Insight: A candlestick pattern is a clue, not a conclusion. The best traders use it as a starting point for a deeper investigation, not as a blind buy or sell trigger.
Its reliability skyrockets when you get confirmation. For example, a bullish engulfing pattern that forms right on a major support level, with a big spike in trading volume, is a far more credible signal than one that just shows up in the middle of choppy, random price action. Context is everything.
Does the Engulfing Pattern Work on All Timeframes?
Yes, you'll spot engulfing patterns on everything from a one-minute chart to a weekly chart. But—and this is a big but—their significance and reliability change dramatically with the timeframe.
- Higher Timeframes (Daily, Weekly): Patterns here are the real deal. They represent a much larger and more meaningful shift in market sentiment. Because they filter out all the short-term noise, they tend to be far more reliable.
- Lower Timeframes (1-minute, 5-minute): Engulfing patterns pop up all the time on these charts, but they're often less reliable and can generate a lot of false alarms. They reflect tiny, short-lived momentum shifts that might fizzle out before turning into a real move.
This is precisely why most seasoned traders give much more weight to engulfing patterns that form on daily or 4-hour charts.
What Is the Best Indicator to Combine with an Engulfing Pattern?
There's no single "best" indicator—it really depends on your trading style. That said, one of the most powerful and effective tools to pair with a candlestick engulfing pattern is the Relative Strength Index (RSI).
The RSI is fantastic for measuring momentum and spotting overbought or oversold conditions. A monster confirmation signal happens when you see RSI divergence. For instance, imagine the price grinds down to make a new low, but the RSI makes a higher low (this is called bullish divergence). If a bullish engulfing pattern forms right after that, it’s a huge tip-off that selling pressure is exhausted and a reversal is probably coming.
Ready to stop hunting for patterns by hand and start finding high-probability setups automatically? ChartsWatcher has an advanced scanning platform that lets you build custom alerts for the candlestick engulfing pattern and thousands of other criteria. Take back your time and let the best opportunities come to you. Explore ChartsWatcher today!
