7 Candlestick Reversal Patterns Every Trader Should Know
Spotting Market Turns with Candlesticks
This article details seven essential candlestick reversal patterns to help traders pinpoint market turning points. Understanding candlestick reversal patterns allows for more informed trading decisions and potentially increases profitability. Quickly identify potential trend reversals with patterns like the Hammer, Engulfing, and Morning Star. Learning these patterns empowers you to anticipate shifts in market direction and capitalize on new opportunities. Let's explore these key candlestick reversal patterns.
1. Hammer and Hanging Man Pattern
The Hammer and Hanging Man are essential candlestick reversal patterns that traders use to predict potential shifts in price direction. These single candlestick patterns offer valuable clues about the battle between buyers and sellers, often foreshadowing a trend reversal. They are characterized by a small real body (either green/white indicating a closing price higher than the opening price, or red/black indicating a closing price lower than the opening price), little or no upper shadow, and a long lower shadow at least twice the length of the real body. This distinctive shape reveals a specific trading dynamic: sellers initially pushed the price down, but buyers stepped in and drove the price back up (or closer to the open) before the close.
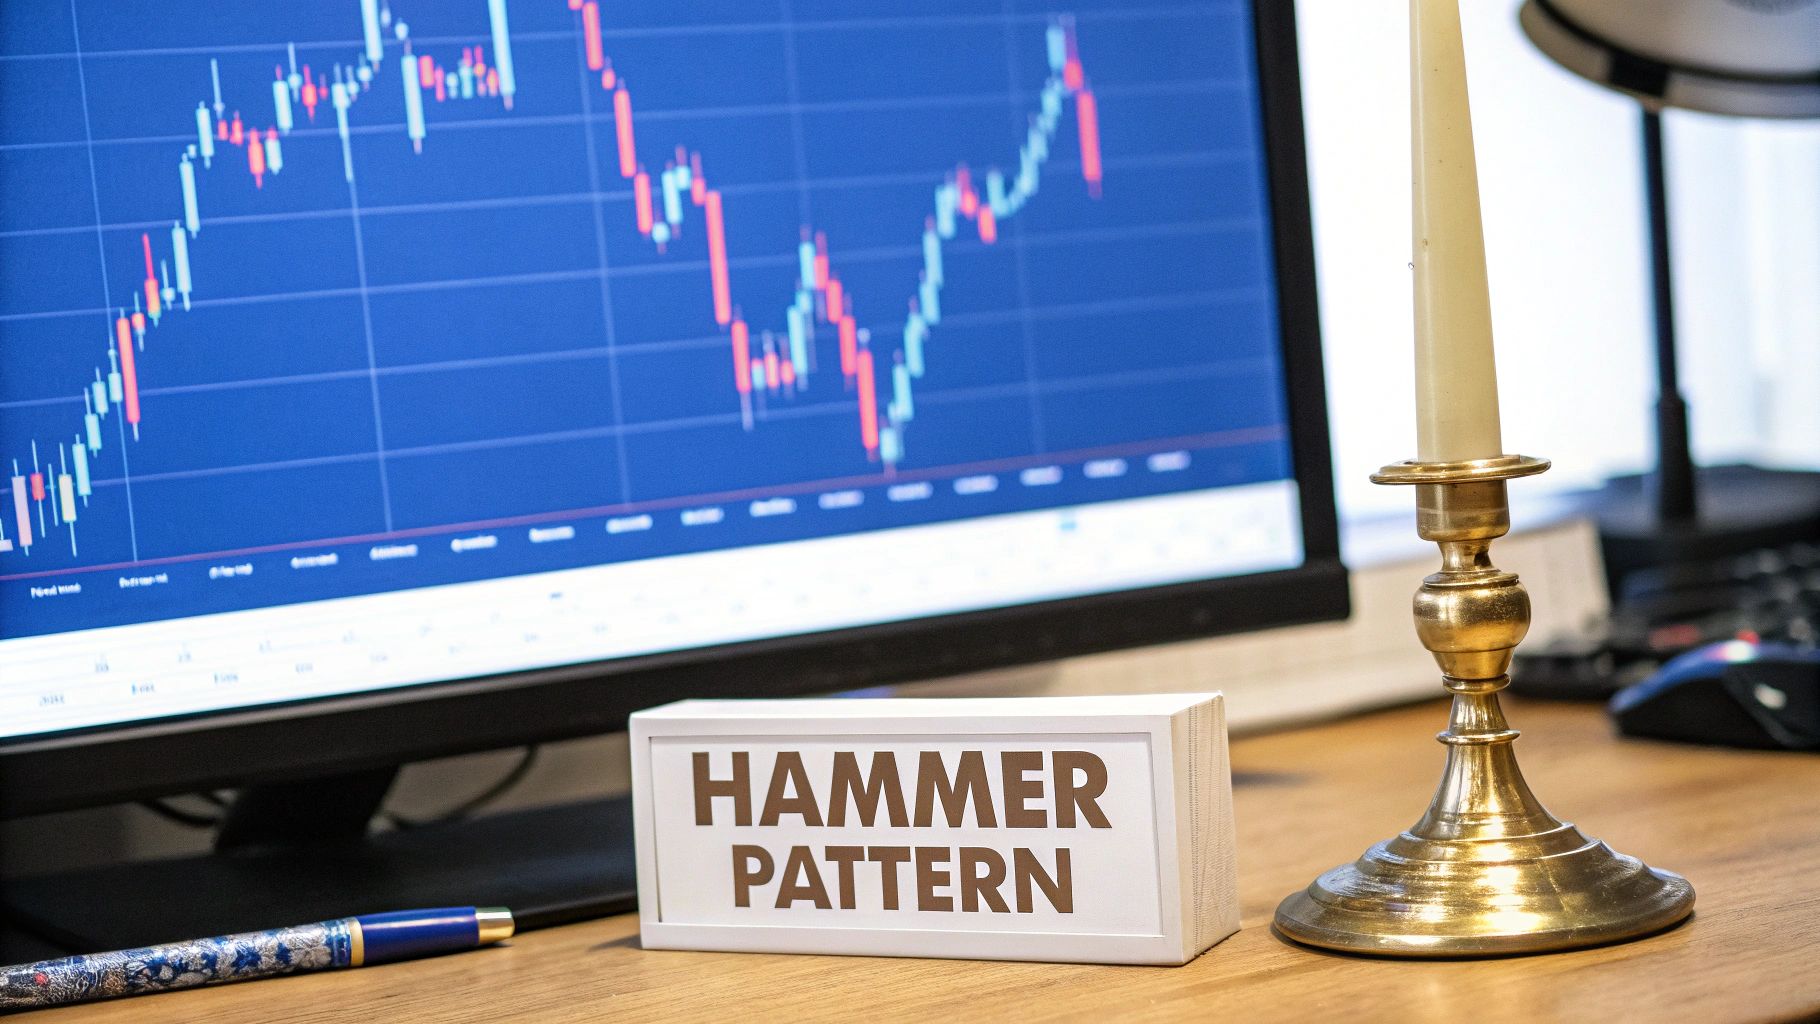
The critical difference between a Hammer and a Hanging Man lies in their position within a trend. A Hammer forms at the bottom of a downtrend and signals a potential bullish reversal. Conversely, a Hanging Man appears at the top of an uptrend and warns of a possible bearish reversal. Think of it this way: a hammer at the bottom suggests the price is trying to "hammer out" a bottom, while a hanging man at the top looks precariously positioned to fall.
Features of the Hammer and Hanging Man:
- Small Real Body: Indicates indecision in the market.
- Little or No Upper Shadow: Shows the extent of the initial selling pressure.
- Long Lower Shadow: Represents the buyers' strong entry and subsequent price recovery.
- Context is Key: The pattern's bullish or bearish interpretation depends entirely on its position within the existing trend.
Pros:
- Easy Visual Identification: Their distinct shape makes them relatively easy to spot on charts.
- Early Warning Signals: They provide early indications of a potential trend reversal, allowing traders to anticipate market shifts.
- Relatively High Reliability: When confirmed by subsequent price action, these patterns can have a good track record.
- Versatile Applicability: They can be used across various timeframes and markets.
Cons:
- Confirmation Needed: Requires confirmation from the following candlesticks to validate the reversal signal (e.g., a higher close after a Hammer).
- False Signals: Can produce false signals in choppy or sideways markets where clear trends are absent.
- Volume Considerations: Reliability decreases in low-volume markets, where price movements may be less significant.
- Not a Standalone Indicator: Should not be used in isolation and should be combined with other technical indicators and market analysis.
Examples:
- The March 2020 COVID-19 market bottom saw Apple stock form a Hammer pattern before a significant rally.
- Bitcoin displayed a Hanging Man in December 2017 near its peak, preceding a major correction.
- The EUR/USD frequently forms Hammer patterns after extended downtrends, often signaling temporary support levels.
Tips for Using Hammer and Hanging Man Patterns:
- Confirmation is Crucial: Wait for the next day's closing price to confirm the signal. For a Hammer, look for a close above the Hammer's high; for a Hanging Man, a close below the Hanging Man's low.
- Volume Adds Weight: High volume during the formation of the pattern strengthens the signal. Increased buying volume on a Hammer or selling volume on a Hanging Man enhances reliability.
- Context Matters: Look for Hammers at key support levels and Hanging Men at key resistance levels.
- Manage Risk: Always use stop-loss orders placed strategically based on the low of the Hammer or the high of the Hanging Man to limit potential losses.
The Hammer and Hanging Man patterns, popularized by technical analysts like Steve Nison and Thomas Bulkowski, deserve a place in any trader's toolkit because they provide a quick and visually accessible way to identify potential reversal points. While they are not foolproof, when used correctly in conjunction with other technical indicators and market analysis, they can significantly enhance trading decisions and increase the probability of success. They are particularly useful for professional traders, stock market analysts, financial institutions, and independent investors seeking an edge in navigating market volatility. Stock trading educators often utilize these patterns to teach price action and reversal concepts, and they are frequently incorporated into stock scanning and screening tools for automated identification. By understanding the nuances of these candlestick reversal patterns, traders can gain valuable insights into market sentiment and potentially capitalize on emerging opportunities.
2. Bullish and Bearish Engulfing Patterns
Engulfing patterns are powerful two-candlestick reversal signals that stand out among candlestick reversal patterns due to their strong reliability and clear visual cues. They occur when the second candle completely 'engulfs' the real body of the previous candle, not necessarily the shadows. This dramatic price action signals a potential shift in market sentiment and direction. A bullish engulfing pattern forms at the bottom of a downtrend. It's characterized by a large bullish (green/white) candle completely engulfing the previous bearish (red/black) candle's body, suggesting a surge in buying pressure. Conversely, a bearish engulfing pattern occurs at the top of an uptrend. Here, a large bearish (red/black) candle engulfs the preceding bullish (green/white) candle's body, indicating sellers have taken control.
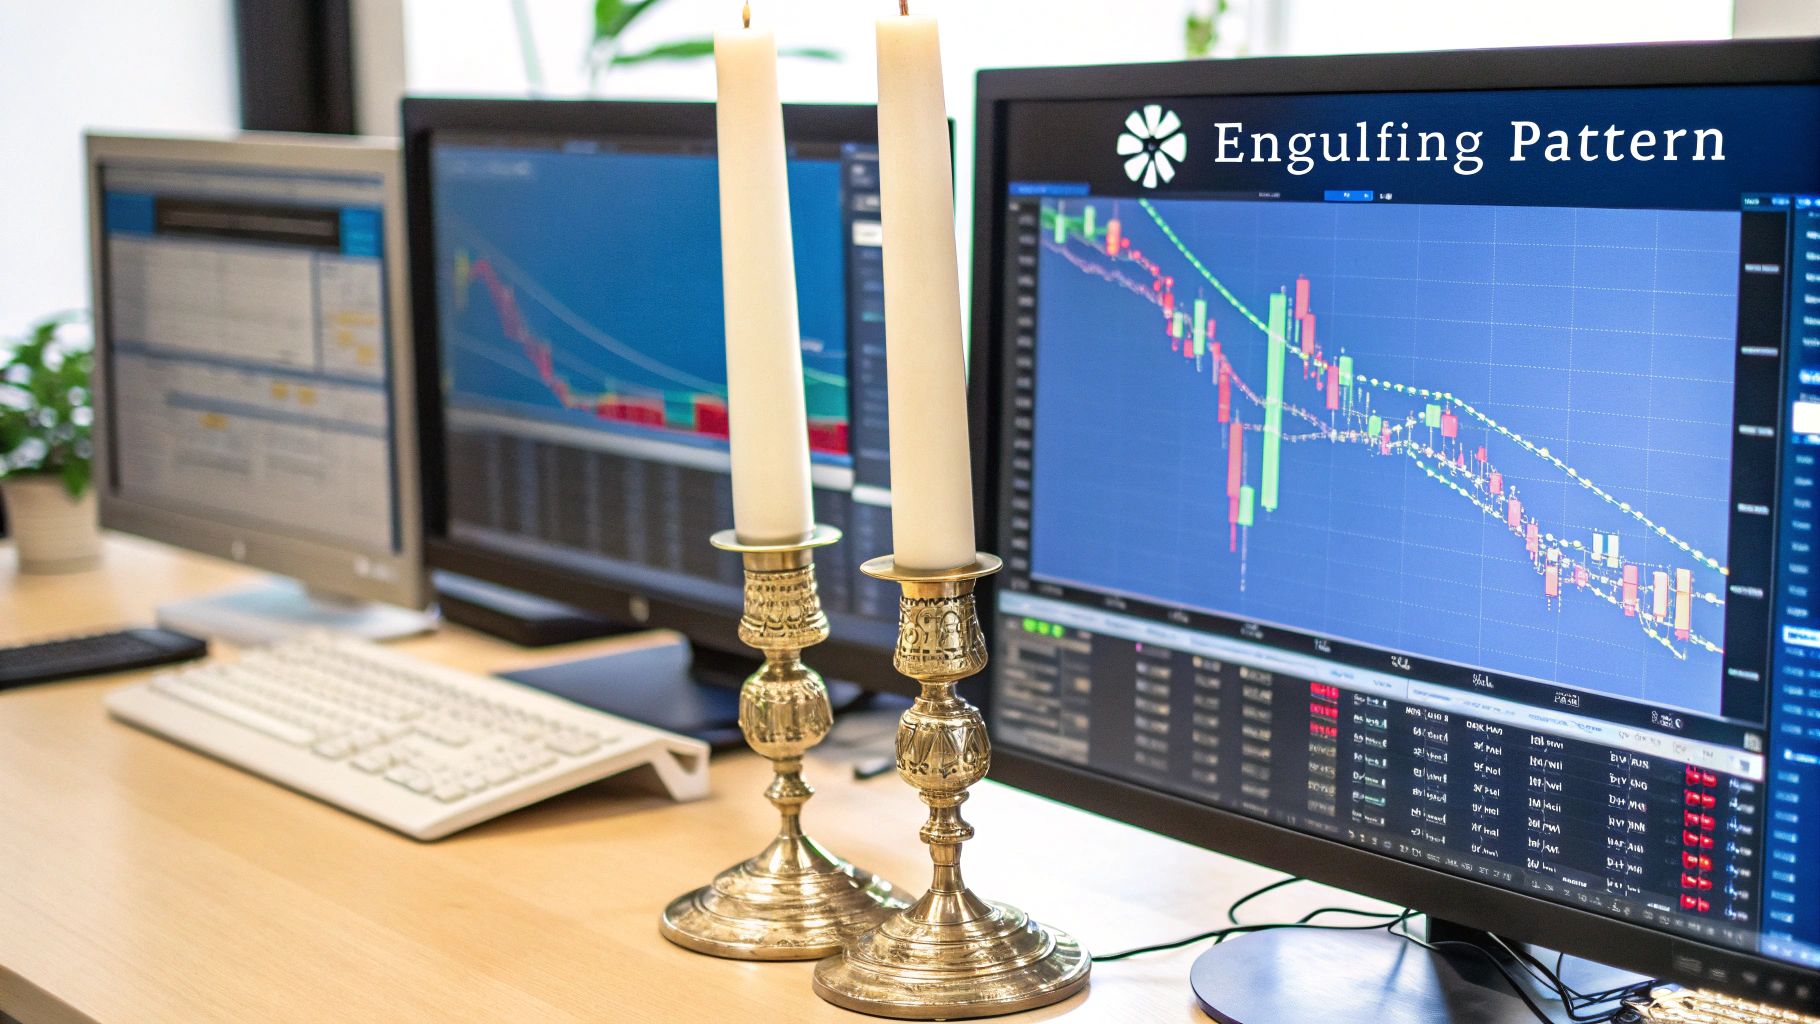
These patterns are particularly effective because they highlight a clear shift in momentum. The larger the second candle, the stronger the potential reversal. For example, the S&P 500 formed a bullish engulfing pattern in late March 2020, signaling a potential end to the COVID-19 crash and the beginning of a significant market recovery. Conversely, gold futures displayed bearish engulfing patterns at major tops in 2011, preceding multi-year corrections. The USD/JPY currency pair also frequently demonstrates these patterns at key reversal points. Learn more about Bullish and Bearish Engulfing Patterns.
Features:
- Two-candle pattern with opposing colors.
- Second candle's body fully engulfs the previous candle's body.
- Occurs at the end of a defined trend.
- Larger second candle indicates a strong momentum shift.
Pros:
- Strong reliability, especially after extended trends.
- Clear visual signal of momentum change.
- Works effectively across all timeframes and markets (from day trading to long-term investing).
- Higher success rate than many single-candle patterns.
Cons:
- Can produce false signals, especially in range-bound or choppy markets.
- Less effective during periods of low volatility.
- Entry point may be less optimal if the second candle has already made a substantial move.
- Requires a clear preceding trend for maximum effectiveness.
Tips for Professional Traders, Analysts, and Investors:
- Confirmation with Volume: Look for increased volume on the engulfing candle for a stronger signal. High volume validates the conviction behind the price move.
- Key Levels: Engulfing patterns occurring at key support/resistance levels or trendlines significantly increase their reliability. These levels act as crucial decision points for market participants.
- Candle Size: A substantially larger engulfing candle compared to the previous candle strengthens the reversal signal, showcasing dominant buying or selling pressure.
- Confluence with Oscillators: Consider using oscillators like the Relative Strength Index (RSI) or Stochastic Oscillator to confirm potential reversals. Divergence between price and oscillators can further strengthen the signal.
- Stop-Loss Placement: Place stop-loss orders beyond the high/low of the engulfing pattern to manage risk effectively. This limits potential losses if the reversal fails.
Engulfing patterns deserve a prominent place in any trader's toolkit due to their clear signals, ease of identification, and applicability across various markets and timeframes. While not foolproof, they provide valuable insights into potential trend reversals, offering traders the opportunity to capitalize on significant market shifts. They were popularized by Steve Nison in his book "Japanese Candlestick Charting Techniques" and further incorporated into Western technical analysis by John Murphy.
3. Morning Star and Evening Star Patterns
The Morning Star and Evening Star patterns are powerful three-candlestick reversal patterns in the world of candlestick analysis, frequently used to pinpoint potential shifts in market trends. They are highly regarded as reliable indicators of trend reversals when they appear at the end of established uptrends or downtrends. These patterns derive their predictive power from capturing the changing dynamics of market sentiment, transitioning from strength to indecision and finally to a reversal. Specifically, they signal a shift in the balance of power between buyers and sellers, offering valuable insights for traders seeking to capitalize on trend changes within the stock market.
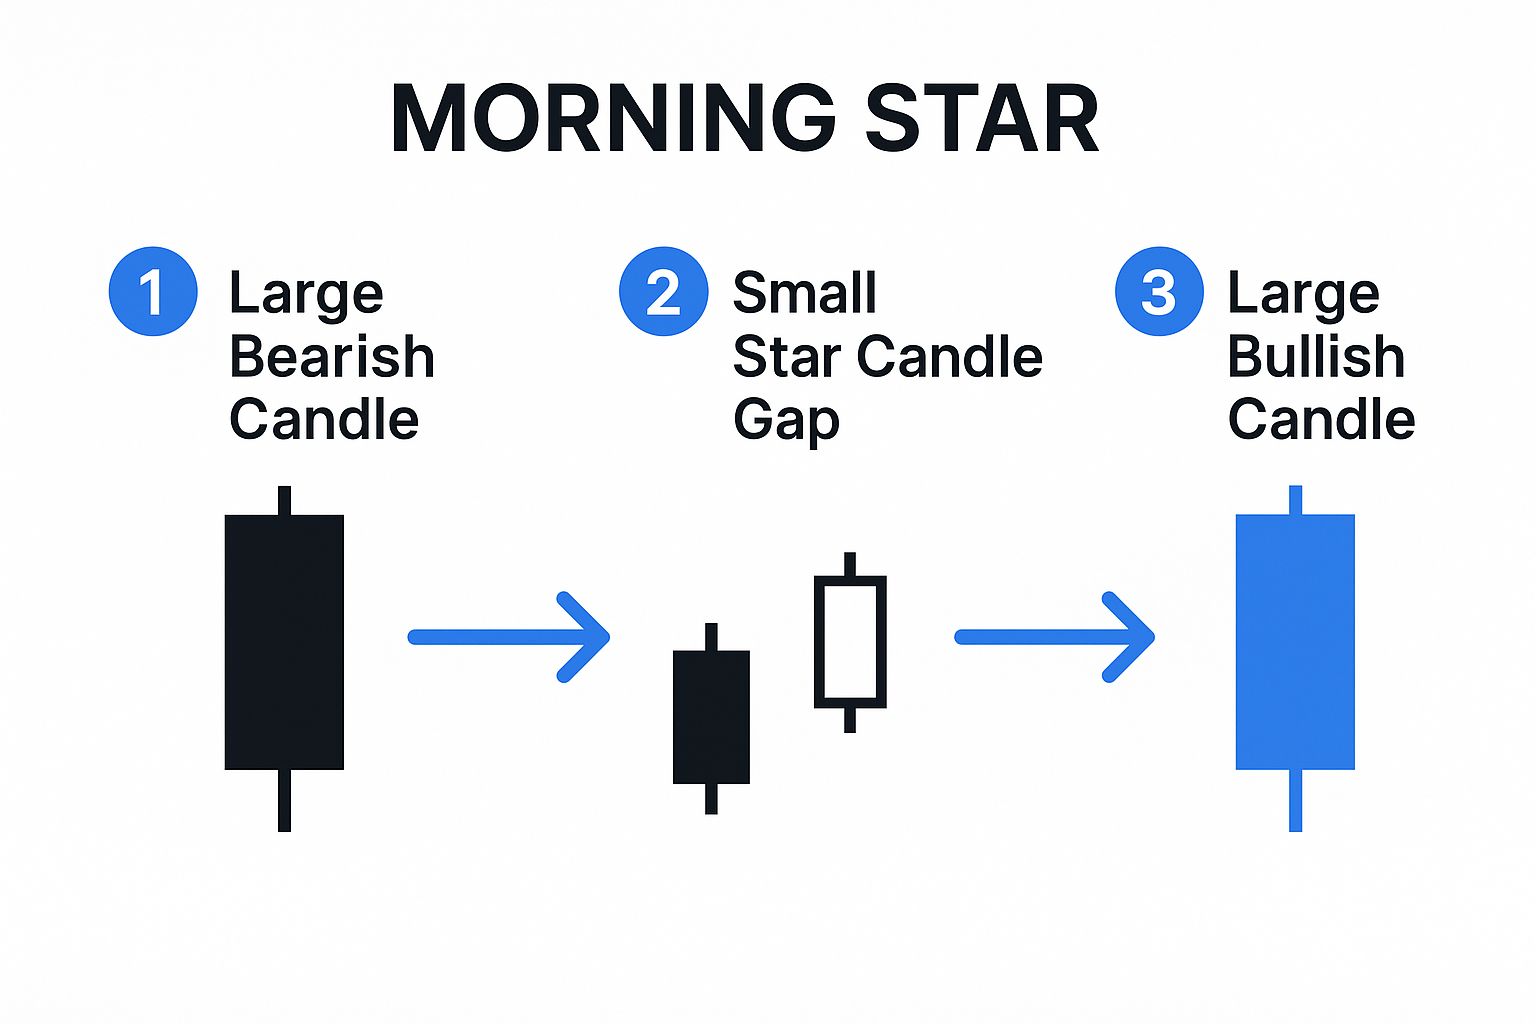
The infographic above visually represents the formation of both the Morning Star and Evening Star patterns. It clearly illustrates the size and relationship of the three candles that constitute these patterns, highlighting the importance of the small-bodied middle candle (the "star") and the significant penetration of the third candle into the body of the first.
A Morning Star pattern forms at the bottom of a downtrend. The process begins with a large bearish candle, reflecting the prevailing downward momentum. This is followed by a small-bodied candle, the "star," which gaps down from the previous candle. This star represents a period of indecision and a potential slowing of the downtrend. Finally, a large bullish candle emerges, gapping up and moving significantly into the body of the first bearish candle. This signals the resurgence of bullish sentiment and the potential for a trend reversal.
Conversely, the Evening Star pattern appears at the peak of an uptrend. It starts with a large bullish candle, reflecting strong upward momentum. A small-bodied star then gaps up, indicating hesitation among buyers. The pattern concludes with a large bearish candle breaking significantly into the body of the first bullish candle, signaling a shift to bearish sentiment and a potential downtrend.
The following steps outline the formation of these patterns:
- Established Trend: Identify a clear existing uptrend (for Evening Star) or downtrend (for Morning Star).
- First Candle: Observe a large candle consistent with the prevailing trend.
- Star: The second candle is a small-bodied "star" that gaps away from the first candle (down for Morning Star, up for Evening Star). This gap signifies a potential shift in momentum.
- Confirmation Candle: The third candle is a large candle that moves significantly into the body of the first candle, confirming the reversal.
The sequential nature of these steps is crucial for accurate pattern recognition. The star candle, signaling indecision, is pivotal, followed by the confirming third candle that reveals the emerging trend reversal.
These candlestick reversal patterns offer several advantages to professional traders, analysts, and investors:
- High Reliability: When fully formed with confirmation, they are considered highly reliable indicators of trend reversals.
- Clear Entry Points: They provide well-defined entry points for reversal trades, allowing for strategic positioning.
- Sentiment Shift: They represent a complete shift in market sentiment, from dominance to indecision and finally reversal.
However, some drawbacks exist:
- Rarity: They are less common compared to other patterns.
- Delayed Entry: They take three days to form, potentially delaying trade entry.
- False Signals: Without confirmation from subsequent price action, they can generate false signals.
Tips for Utilizing Morning Star and Evening Star Patterns:
- Confirmation: Wait for the completion of all three candles before entering a trade.
- Volume: Look for increasing volume on the third candle as confirmation of the reversal.
- Trend Context: The patterns are more reliable when they form after extended trends.
- Technical Levels: They are most effective at key technical levels such as support/resistance, Fibonacci levels, or round numbers.
- Stop Losses: Place stop-loss orders beyond the low of a Morning Star or above the high of an Evening Star to manage risk.
Examples of successful implementation include the Morning Star formation in Boeing stock before its recovery rally in March 2020 and the Evening Star in Netflix shares at the January 2022 tech peak before a major decline. These patterns have also been observed at key bottoms in major cryptocurrency corrections. Popularized by technical analysis experts like Steve Nison and Martin Pring, the Morning Star and Evening Star patterns deserve a prominent place in any trader's toolkit due to their ability to signal powerful trend reversals with a relatively high degree of accuracy. They offer a valuable edge in navigating the complexities of the financial markets.
4. Doji Reversal Patterns
Doji candlestick patterns are powerful tools in a trader's arsenal, providing valuable insights into potential trend reversals. These patterns emerge when the opening and closing prices of a security are virtually identical, resulting in a cross, plus, or inverted cross shape on a candlestick chart. This unique formation signals market indecision and potential exhaustion of the prevailing trend, suggesting a possible shift in momentum. The power of the Doji lies in its ability to highlight a moment of equilibrium between buyers and sellers.
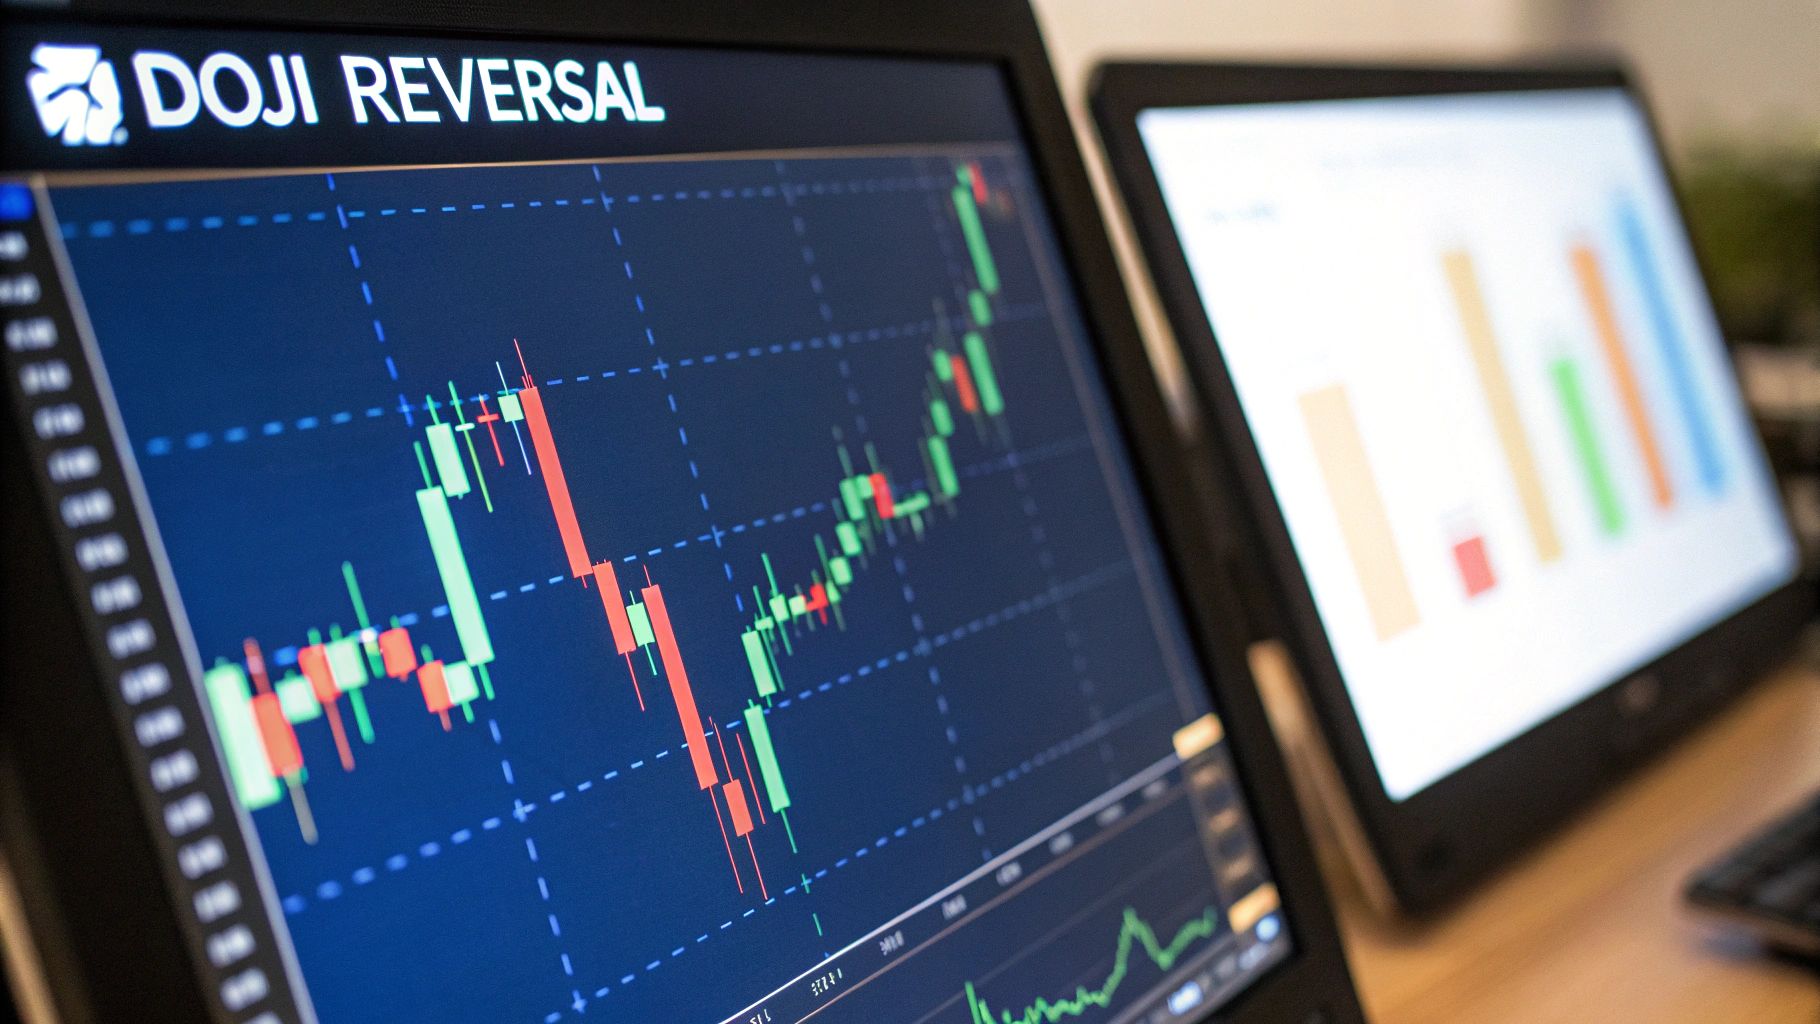
The four main types of Doji—standard, long-legged, dragonfly, and gravestone—offer unique insights into market psychology. A standard Doji has short shadows, indicating minimal price movement beyond the open and close. The long-legged Doji, with its extended upper and lower shadows, reveals significant price volatility during the period but an ultimate return to the opening price, highlighting the struggle between buyers and sellers. A dragonfly Doji, characterized by a long lower shadow and virtually no upper shadow, suggests strong buying pressure that pushed the price up from its lows, potentially signaling a bullish reversal. Conversely, a gravestone Doji, featuring a long upper shadow and no lower shadow, indicates strong selling pressure that pushed the price down from its highs, potentially signaling a bearish reversal.
Doji reversal patterns become particularly potent when they appear after extended trends or at crucial support/resistance levels. These contexts strengthen the signal, suggesting that the market is reaching a point of equilibrium and a reversal in direction may be imminent. For example, a long-legged Doji forming at a market top after a sustained uptrend, as seen during the February 2020 market peak before the COVID-19 crash, can act as a warning sign of impending decline. Similarly, a dragonfly Doji found at a Bitcoin support level during a major correction, often precedes a bounce, signifying renewed buying interest. Conversely, gravestone Dojis appearing at resistance levels in major stock indices have historically preceded corrections.
Pros:
- Frequent appearance across various markets and timeframes.
- Easy visual identification.
- Early warning of potential trend exhaustion.
- Increased effectiveness when combined with other technical indicators.
Cons:
- High frequency can lead to false signals.
- Requires confirmation from subsequent price action.
- Reduced reliability in low-volatility or thinly-traded markets.
- Different Doji types require distinct interpretations.
Tips for Utilizing Doji Reversal Patterns:
- Confirmation is Key: Never trade based solely on a Doji. Look for confirmation from the next candle or other indicators, such as volume increase, before entering a position.
- Dragonfly and Gravestone Reliability: Dragonfly Dojis are generally more reliable as bullish reversal signals, while gravestone Dojis are more dependable as bearish reversal signals.
- Volume Significance: An increase in volume accompanying a Doji formation strengthens the signal.
- Context Matters: Pay close attention to Dojis that form after strong directional movements or at significant support/resistance levels.
Doji reversal patterns, popularized by Steve Nison who brought the concept to Western traders, originated from the Japanese rice traders who developed candlestick charting. These patterns deserve a place in every trader's toolkit due to their ability to provide early warning signs of potential trend reversals. For more in-depth information, learn more about Doji Reversal Patterns. By understanding the nuances of each Doji type and combining them with other technical analysis tools, traders can gain a valuable edge in navigating the complexities of financial markets. This information is particularly relevant for professional traders, stock market analysts, financial institutions, independent investors, stock trading educators, and those utilizing stock scanners and screeners for day trading. Remember, using Doji patterns in conjunction with other candlestick reversal patterns can greatly improve your ability to identify and capitalize on market turning points.
5. Three Inside Up and Three Inside Down Patterns
The Three Inside Up and Three Inside Down patterns are valuable additions to the arsenal of any trader looking to identify potential candlestick reversal patterns. These three-candle formations offer a higher degree of reliability compared to simpler one or two-candle patterns, making them particularly attractive for spotting shifts in market sentiment. They represent a more gradual, evolving reversal rather than a sudden, sharp change, providing traders with valuable insights into the underlying market dynamics.
These patterns begin with a Harami pattern. A Harami is characterized by a small candle body completely contained within the range of the preceding larger candle. This suggests a potential slowing down of the prevailing trend. The third candle acts as the confirmation signal, solidifying the potential reversal.
Three Inside Up: This bullish reversal pattern forms during a downtrend. It starts with a large bearish candle, followed by a smaller bullish candle contained within the body of the first. The pattern is completed by a third bullish candle that closes above the high of the second candle. This decisive move above the second candle's high signals the potential start of an uptrend.
Three Inside Down: This bearish reversal pattern forms during an uptrend. It begins with a large bullish candle, followed by a smaller bearish candle within its range. The final bearish candle closes below the low of the second candle, confirming the potential downtrend.
Features and Benefits:
- Gradual Shift: Unlike abrupt reversals, these patterns illustrate a progressive shift in market control, offering a more reliable indication of a sustained price move.
- Clear Confirmation: The third candle provides a distinct confirmation signal, reducing the likelihood of false signals and whipsaws.
- Defined Entry and Risk Management: The pattern offers clear entry points (after the close of the third candle) and stop-loss levels (below the low of the Three Inside Up or above the high of the Three Inside Down).
- Versatility: These patterns work across various timeframes (intraday, daily, weekly) and markets (stocks, forex, futures).
Pros:
- Higher reliability than simpler candlestick reversal patterns.
- Clear confirmation component reduces false signals.
- Provides defined entry and stop-loss points.
- Effective across various timeframes and markets.
Cons:
- Requires patience to wait for the full three-candle formation.
- Less common than simpler patterns.
- Potential to miss a portion of the initial price move while waiting for confirmation.
- Effectiveness can diminish in highly volatile or news-driven markets.
Examples:
- Crude Oil Futures: Three Inside Up patterns can often be observed in crude oil futures after significant selloffs, preceding price recoveries.
- Tech Stocks: Three Inside Down patterns frequently appear at tops in major tech stocks, foreshadowing potential corrections.
- Forex: These patterns are common occurrences in major forex pairs like EUR/USD, marking key reversal points.
Actionable Tips:
- Entry: Place your entry order after the close of the third confirmation candle.
- Stop-Loss: Set your stop-loss order below the low of the Three Inside Up pattern or above the high of the Three Inside Down pattern.
- Trend Confirmation: The patterns are more reliable when they form after extended trends.
- Volume: Look for increasing volume on the third confirmation candle, adding further validation to the reversal.
- Indicators: Combine with momentum oscillators like RSI or MACD for added confirmation.
These patterns were popularized by technical analysts like Steve Nison, known for his work on candlestick charting, and Greg Morris, who conducted statistical analysis on their effectiveness. The Three Inside Up and Three Inside Down patterns, while requiring some patience, provide traders with valuable tools for identifying and capitalizing on potential market reversals. They deserve a prominent place in the toolkit of any serious trader seeking an edge in the market.
6. Piercing Line and Dark Cloud Cover Patterns
The Piercing Line and Dark Cloud Cover patterns are essential tools in the arsenal of any trader looking to identify potential candlestick reversal patterns. These two-candle formations provide valuable insights into shifts in market momentum and can signal upcoming trend reversals. Their inclusion in this list is warranted due to their strong predictive value, clear visual identification, and applicability across various markets.
How They Work:
These patterns rely on the interaction between two consecutive candlesticks with contrasting colors, signifying a struggle between buyers and sellers. Crucially, the second candle opens with a gap beyond the close of the first – a gap down for the Piercing Line (bullish reversal) and a gap up for the Dark Cloud Cover (bearish reversal). The extent of the second candle's penetration into the first candle's body is key: it must close beyond the midpoint of the previous candle.
-
Piercing Line (Bullish Reversal): Forms during a downtrend. A long bearish candle is followed by a bullish candle that gaps down at the open but rallies strongly to close above the midpoint of the preceding bearish candle's body. This demonstrates buyers overpowering sellers and suggests a potential trend reversal to the upside.
-
Dark Cloud Cover (Bearish Reversal): Appears during an uptrend. A long bullish candle is followed by a bearish candle that gaps up at the open but then falls significantly to close below the midpoint of the preceding bullish candle's body. This indicates sellers taking control from buyers and suggests a potential trend reversal to the downside.
Examples:
-
Piercing Line: Imagine the S&P 500 experiencing a correction. At a significant bottom, a Piercing Line forms, signaling a potential end to the downturn and the beginning of a new uptrend.
-
Dark Cloud Cover: Consider gold rallying strongly. At the peak of this rally, a Dark Cloud Cover appears, potentially foreshadowing a pullback or reversal in the gold price. Similarly, this pattern can be observed in individual stocks before earnings-driven reversals, indicating a shift in investor sentiment.
Pros:
- Strong Predictive Value: Particularly effective after extended trends, highlighting potential exhaustion points.
- Clear Visual Identification: Easily recognizable on candlestick charts.
- Common Occurrence: Found across various markets, including stocks, commodities, and forex (though gap openings can be less frequent in 24-hour markets).
- Defined Risk Parameters: Facilitates trade management with clear stop-loss placement.
Cons:
- Gap Requirement: Gap openings are essential but might not always be present, especially in 24-hour markets like forex.
- False Signals: Can occur in choppy or ranging markets lacking a clear trend.
- Midpoint Rule Rigidity: The midpoint penetration requirement may be too strict in certain market conditions.
- Confirmation Needed: Reliability improves significantly with confirmation from subsequent price action.
Actionable Tips:
- Deep Penetration: Aim for at least 50% penetration into the previous candle's body for increased reliability. Deeper penetration strengthens the signal.
- Volume Confirmation: Look for increased volume on the second candle, validating the strength of the reversal.
- Trend Context: These patterns are most effective after extended trends displaying signs of exhaustion.
- Stop-Loss Placement: Set stop-losses beyond the low of the Piercing Line or above the high of the Dark Cloud Cover to manage risk.
- Confirmation Candle: Wait for a confirming candle in the direction of the reversal before entering a trade to minimize false signals.
Popularized By: Steve Nison played a crucial role in introducing these candlestick reversal patterns to Western markets. Thomas Bulkowski's statistical analysis further contributed to understanding their performance and effectiveness.
By understanding and applying the Piercing Line and Dark Cloud Cover patterns, traders can gain a significant edge in identifying potential trend reversals and making informed trading decisions. These patterns offer a powerful visual representation of shifting market dynamics and, when used correctly, can greatly enhance trading strategies.
7. Shooting Star and Inverted Hammer Patterns
The Shooting Star and Inverted Hammer are crucial candlestick reversal patterns that deserve a place on any trader's watchlist. These single-candlestick formations provide valuable clues about potential trend exhaustion and upcoming reversals, offering traders an early warning system within the dynamic landscape of candlestick analysis. They are relatively easy to spot, making them accessible to both novice and experienced traders looking to enhance their understanding of price action.
These patterns share similar visual characteristics but differ significantly in their implications based on their location within a trend. Both feature a small real body (which can be either bullish or bearish) situated at the lower end of the trading range. Their defining characteristic is a long upper shadow, at least twice the length of the body, indicating a rejection of higher prices. They typically have little or no lower shadow.
Shooting Star (Bearish Reversal): Appearing at the top of an uptrend, the Shooting Star signals a potential downward reversal. The long upper shadow depicts a scenario where buyers initially pushed prices higher, but selling pressure emerged, driving prices back down to close near the opening price. This rejection of higher prices suggests waning bullish momentum and a potential shift towards bearish control.
Inverted Hammer (Bullish Reversal): Conversely, the Inverted Hammer forms at the bottom of a downtrend, hinting at a possible upward reversal. The upper shadow represents buying pressure testing higher levels, although sellers ultimately managed to push prices back down. However, the fact that buyers were able to drive prices up significantly during the session suggests underlying bullish strength and the potential for a trend change.
Why Use Shooting Star and Inverted Hammer Patterns?
These patterns are valuable tools for several reasons:
- Early Warning: They can provide early warnings of potential trend reversals, allowing traders to anticipate changes in market direction.
- Clear Stop-Loss Placement: The defined structure of these candlesticks offers clear points for placing stop-loss orders, managing risk effectively.
- Minimal Price Commitment: As single-candle patterns, they signal potential reversals with minimal price commitment before confirmation.
- Easy Identification: Their distinct visual characteristics make them readily identifiable on any chart or timeframe.
Examples:
- Shooting Stars: Often observed at the top of rapid rallies in assets like Tesla, preceding periods of correction.
- Inverted Hammers: Frequently appear at the bottom of major market corrections, foreshadowing potential recoveries. They are also common in commodity markets at key turning points.
Pros:
- Easy to identify
- Early warning of potential trend exhaustion
- Clear stop-loss placement
Cons:
- Frequent false signals without confirmation
- Less reliable in choppy markets
- Require supporting technical context
Actionable Tips for Using Shooting Star and Inverted Hammer Patterns:
- Confirmation is Key: Always wait for confirmation on the following candle before entering a trade. A close below the Shooting Star's body confirms the bearish reversal, while a close above the Inverted Hammer's body confirms the bullish reversal.
- Volume Analysis: Look for unusual volume accompanying the pattern for stronger signals. High volume reinforces the conviction of the reversal.
- Trend Context: These patterns are more reliable when appearing after extended unidirectional moves.
- Supporting Indicators: Combine with overbought/oversold indicators like the Relative Strength Index (RSI) or Stochastic Oscillator for stronger confirmation.
- Shadow Length: Use the length of the upper shadow to gauge the potential strength of the reversal. A longer shadow suggests a more significant rejection of higher prices.
By understanding the nuances of the Shooting Star and Inverted Hammer candlestick reversal patterns, traders can gain a valuable edge in identifying potential trend changes and making more informed trading decisions. These patterns, popularized by Steve Nison who introduced Japanese candlestick analysis to Western markets, offer a glimpse into the ongoing battle between buyers and sellers and the potential for shifts in market sentiment. They are part of a centuries-old tradition of market analysis developed by Japanese rice traders, demonstrating the enduring power of observing price action.
7 Key Candlestick Reversal Patterns Compared
| Pattern | Implementation Complexity 🔄 | Resource Requirements ⚡ | Expected Outcomes 📊 | Ideal Use Cases 💡 | Key Advantages ⭐ |
|---|---|---|---|---|---|
| Hammer and Hanging Man | Low – single candle identification | Low – chart observation | Moderate reliability with confirmation | Early reversal signals at trend extremes | Easy to spot, multi-timeframe applicability |
| Bullish and Bearish Engulfing | Medium – confirm two-candle pattern | Low to Medium – volume confirmation | High reliability at trend turning points | Momentum shifts after defined trends | Strong momentum indicator, clear visual cue |
| Morning Star and Evening Star | High – requires three-candle sequence | Medium – volume and gap analysis | Very high when confirmed | Major market turning points with clear sentiment shift | Highly reliable, shows complete sentiment change |
| Doji Reversal Patterns | Low to Medium – single candle but varied types | Low – standard chart analysis | Variable; early warning but needs confirmation | Trend exhaustion and indecision phases | Frequent, versatile early warning signals |
| Three Inside Up and Down | High – three-candle pattern with confirmation | Medium – multiple candle and volume check | High reliability with confirmation | Gradual trend shifts with clear entry points | Strong confirmation reduces false signals |
| Piercing Line and Dark Cloud Cover | Medium – two-candle with gap requirement | Medium – needs volume & gap check | High but gap-dependent | Clear momentum shifts, especially in gap-prone markets | Strong predictive value with risk parameters |
| Shooting Star and Inverted Hammer | Low – single candle identification | Low – chart pattern recognition | Moderate, needs confirmation | Early warning of trend exhaustion at extremes | Simple, quick identification |
Mastering Candlestick Reversals with ChartsWatcher
This article explored seven key candlestick reversal patterns: the Hammer and Hanging Man, Bullish and Bearish Engulfing, Morning Star and Evening Star, Doji, Three Inside Up and Three Inside Down, Piercing Line and Dark Cloud Cover, and the Shooting Star and Inverted Hammer. Mastering these candlestick reversal patterns provides invaluable insights into potential shifts in market sentiment and empowers you to anticipate trend reversals. By recognizing these patterns, you can refine your entry and exit points, manage risk more effectively, and ultimately, improve your trading decisions. Remember that while these patterns offer powerful clues, they are most effective when confirmed by other technical indicators and considered within the context of the broader market environment.
For professional traders, stock market analysts, financial institutions, and independent investors alike, the ability to identify these candlestick reversal patterns is a critical skill. Whether you're a day trader seeking quick gains or a long-term investor searching for optimal entry points, understanding these patterns can significantly enhance your trading strategy. By incorporating this knowledge into your analysis, you gain a crucial edge in navigating the complexities of the financial markets, increasing your potential for profitable trades and long-term success.
Ready to put your knowledge of candlestick reversal patterns into action? ChartsWatcher empowers you to identify these patterns in real-time with custom alerts, scan for them across multiple markets with our advanced scanner, and backtest your strategies to optimize your approach. Sign up for a free demo at ChartsWatcher and discover how our platform can help you leverage the power of candlestick reversal patterns to elevate your trading game today.
