Master the Engulfing Candlestick Pattern for Profits
Decoding the Engulfing Candlestick Pattern

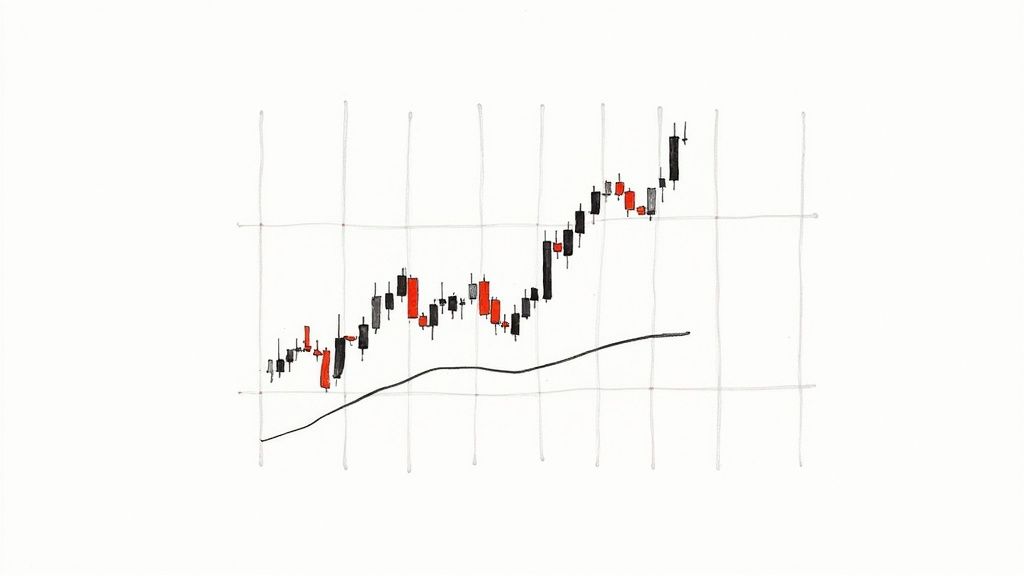
The engulfing candlestick pattern is a valuable tool for traders. It offers insights into the balance of power between buyers and sellers. This pattern can signal potential price reversals, making it an important aspect of technical analysis. But what makes this pattern so useful? It's all about understanding the market dynamics and psychology behind these formations.
Understanding The Psychology Behind Engulfing Patterns
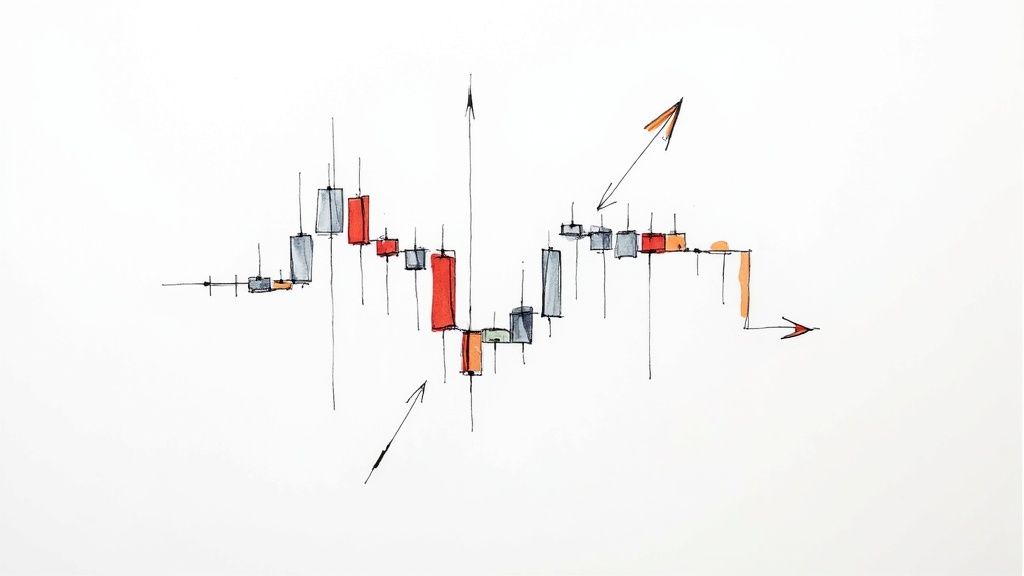
Engulfing patterns appear when market sentiment shifts dramatically. Imagine a downtrend where sellers are in control. Suddenly, a large bullish candle emerges, completely engulfing the previous bearish candle. This visual pattern suggests a surge in buying pressure. It may signal the end of the downtrend.
Conversely, a bearish engulfing pattern in an uptrend signifies increased selling pressure. This hints at a possible reversal. These shifts often mark critical price inflection points. This makes engulfing patterns highly attractive to traders.
The bullish engulfing candlestick pattern is a significant reversal indicator. It forms when a bullish candle entirely engulfs the preceding bearish candle's body. This signals a sentiment change, from bearish to bullish. This frequently indicates the end of a downtrend and the beginning of an uptrend.
For instance, after a significant price drop, it can suggest that buyers are gaining control, possibly leading to a price increase. The pattern's strength increases near support levels. Understanding these dynamics is essential for effectively using engulfing candlestick patterns. Learn more about them and their applications here.
Distinguishing True Engulfing Patterns
Not every engulfing pattern is reliable. To avoid misinterpretations, traders analyze specific characteristics. The size difference between the candles is key. The engulfing candle's body should be significantly larger than the previous candle. This shows a convincing momentum shift.
The body-to-shadow ratio offers additional clues. A long body with short shadows reinforces the reversal signal. Conversely, a long shadow on the engulfing candle could indicate market indecision.
Contextual Factors For Increased Reliability
While the pattern itself is informative, context adds to its reliability. Engulfing patterns at key support or resistance levels are often more potent. They indicate a significant struggle between buyers and sellers. A bullish engulfing pattern near a long-term support level could signal a strong buying opportunity.
Volume analysis also plays a vital role. Increased volume with the engulfing pattern confirms the reversal's strength. Considering these factors helps traders filter less reliable signals and focus on high-probability setups. You may be interested in: How to Read Stock Charts: The Complete Guide for Beginner Investors. This approach is essential for incorporating engulfing patterns into a trading strategy.
Bullish Vs. Bearish Engulfing Patterns: Key Differences

Both bullish and bearish engulfing candlestick patterns suggest potential reversals in the market. However, their structures and meanings differ significantly. Understanding these differences is key to interpreting them correctly and making informed trading decisions.
Formation and Market Context
A bullish engulfing pattern appears during a downtrend. It starts with a red (bearish) candle, followed by a larger green (bullish) candle. The green candle fully engulfs the previous red candle's body. This visually demonstrates buyers taking control, hinting at a possible upward reversal.
Imagine a stock consistently declining. A bullish engulfing pattern might suggest weakening selling pressure and increased buyer interest.
On the other hand, a bearish engulfing pattern appears during an uptrend. It begins with a green (bullish) candle, followed by a larger red (bearish) candle that fully engulfs the preceding green candle's body. This signals sellers gaining control, indicating a potential downward reversal.
For a stock in an uptrend, a bearish engulfing pattern could mark the beginning of a decline. This pattern is a significant reversal signal often appearing at the end of uptrends. It suggests sellers are overpowering buyers, hinting at a potential downtrend. According to Thomas Bulkowski, author of "Encyclopedia of Candlestick Charts", this pattern functions as a bearish reversal approximately 79% of the time, though the duration of the reversal can change. This pattern is especially strong during bear markets and downward breakouts, often leading to swift price drops. More detailed statistics can be found here.
Psychological Underpinnings
Each engulfing pattern reflects a change in market psychology. A bullish engulfing pattern signifies increasing buyer confidence. The market appears to be rejecting lower prices, leading to higher buying pressure. The size of the engulfing candle further indicates the strength of this bullish sentiment.
Conversely, a bearish engulfing pattern shows growing seller dominance. Sellers aggressively enter the market, driving prices down. This often happens due to profit-taking or increased bearish sentiment.
To better understand the key differences between these patterns, let's examine a comparison table:
To better understand the key differences between these patterns, let's examine a comparison table:
Bullish vs Bearish Engulfing Pattern Comparison
Key differences between bullish and bearish engulfing patterns including formation, market context, and trading implications
| Characteristic | Bullish Engulfing | Bearish Engulfing |
|---|---|---|
| Trend Context | Downtrend | Uptrend |
| First Candle | Red (Bearish) | Green (Bullish) |
| Second Candle | Green (Bullish), engulfs the first candle | Red (Bearish), engulfs the first candle |
| Implication | Potential upward reversal | Potential downward reversal |
| Psychology | Increased buyer confidence, rejection of lower prices | Increased seller dominance, aggressive selling |
This table highlights the opposing natures of these patterns. While both involve an engulfing candle, the context of the preceding trend and the color of the candles differentiate their meanings.
Reliability and Confirmation
Engulfing patterns can be strong indicators, but confirmation from other technical analysis tools improves reliability. Traders often look for increased volume with the engulfing candle. The pattern's location is also important. Engulfing patterns at key support or resistance levels tend to be more reliable than those occurring mid-trend. These levels represent significant points of contention between buyers and sellers.
For example, a bullish engulfing pattern near a support level can be a strong buy signal. Conversely, a bearish engulfing pattern at a resistance level can signal a sell opportunity.
Profitable Trading Strategies With Engulfing Patterns

Turning chart patterns into profit requires a solid trading strategy. This section explores how engulfing candlestick patterns can enhance your trading, focusing on entries, stop-losses, and profit targets. This information can help you maximize potential gains while minimizing risk. We'll also discuss how to adapt these strategies to different market conditions and timeframes.
Entry Techniques for Engulfing Patterns
Finding the right entry point is essential for maximizing profits with engulfing patterns. For bullish engulfing patterns, many traders enter a position when the next candle opens after the pattern completes. This approach aims to capture the immediate upward momentum.
A more cautious approach involves waiting for confirmation. This means waiting for the price to close above the high of the engulfing candle. This confirmation helps reduce the risk of false breakouts. For bearish engulfing patterns, these strategies are reversed. Traders either enter a short position on the next candle's open or wait for a confirmed close below the engulfing candle's low.
Stop-Loss Placement and Risk Management
Managing risk is crucial for any trading strategy. With engulfing patterns, stop-loss orders are placed to limit potential losses. For bullish engulfing patterns, the stop-loss is usually set just below the low of the engulfing candle. This placement protects against a failed reversal.
For bearish engulfing patterns, the stop-loss is placed just above the pattern's high. This placement mirrors the bullish strategy, limiting potential losses if the price moves against the expected direction.
Profit Target Strategies
Profit targets should align with your risk-reward ratio. One common approach involves setting a profit target based on the size of the engulfing candle. For example, if the engulfing candle's body is 10 points, the profit target could be 15 or 20 points. The specific target depends on your risk tolerance and current market conditions.
Traders may also use technical levels, like previous support and resistance zones, as dynamic profit targets. This approach takes advantage of potential price reactions at these key levels.
Combining Engulfing Patterns with Other Indicators
Engulfing patterns are often more effective when used with other technical indicators. For example, a bullish engulfing pattern occurring at a significant support level strengthens the buy signal. Conversely, a bearish engulfing pattern at a resistance level can indicate a strong sell opportunity.
Traders also consider the overall market trend. They may use tools like moving averages or the relative strength index (RSI) to confirm their decisions. For further reading on trading strategies, you can find more detailed information here: The Ultimate Forex Trading Blueprint.
Adapting Strategies to Different Markets
Engulfing pattern strategies are adaptable to various markets and timeframes. In trending markets, engulfing patterns that align with the current trend are often more successful. During periods of consolidation, these patterns can signal potential breakouts.
For intraday trading, engulfing patterns on shorter timeframes, like 5-minute or 15-minute charts, can offer quick trading opportunities. These signals require careful risk management due to the increased market volatility. For longer-term trades, engulfing patterns on daily or weekly charts offer a broader market perspective. You might also be interested in exploring more price action strategies: Price Action Trading Strategies: A Comprehensive Guide for Market Success. These adaptable strategies provide a framework for analyzing engulfing patterns in any market environment.
Engulfing Patterns Across Different Financial Markets

Engulfing candlestick patterns are powerful tools for technical analysis. However, their effectiveness isn't universal across all financial markets. Whether you're trading stocks, forex, cryptocurrencies, or commodities, understanding these nuances is key. Let's explore how these patterns perform in different environments.
Market-Specific Factors Influencing Engulfing Patterns
Several factors impact the reliability of engulfing patterns. Liquidity, the ease of buying or selling an asset, is a primary one. Highly liquid markets like forex often show clearer price action. This makes engulfing patterns easier to spot and potentially more reliable.
Volatility, the degree of price fluctuation, also matters. Highly volatile markets, like cryptocurrencies, can generate numerous false signals. Additional confirmation tools become essential in these environments. Conversely, less volatile markets, such as some commodities, may offer fewer but potentially more reliable patterns.
Finally, institutional participation can influence pattern behavior. Markets with significant institutional activity often see more controlled price movements, potentially increasing engulfing pattern reliability. However, this can also lead to sophisticated manipulation and false breakouts.
Adapting Engulfing Pattern Strategies Across Markets
Traders adapt their strategies based on the specific market. In the fast-paced forex market, traders might use shorter timeframes, such as 15-minute or 1-hour charts, to capitalize on quick price swings.
Stock market traders often analyze daily or weekly charts to identify longer-term trends signaled by engulfing patterns. Confirmation techniques also vary. In volatile markets, traders often look for increased volume alongside the engulfing candle to validate the signal. In less volatile markets, indicators like moving averages or support/resistance levels might provide more relevant confirmation.
Analyzing Engulfing Pattern Performance by Market
Getting precise statistics on engulfing pattern success rates is challenging due to varying testing methods and data sets. However, understanding general tendencies can improve trading approaches. The following table provides a general comparison:
To understand these tendencies across different markets, let's look at the table below.
| Market | Pattern Frequency | Success Rate (General Tendency) | Average Return (Illustrative) | Best Timeframes (Examples) |
|---|---|---|---|---|
| Stocks | Moderate | Medium | Variable | Daily, Weekly |
| Forex | High | Medium to High | Relatively Low | 15-minute, 1-hour |
| Cryptocurrencies | High | Low to Medium | Potentially High | 1-hour, 4-hour |
| Commodities | Low | Medium to High | Variable | Daily, Weekly |
This table highlights the diverse characteristics of engulfing patterns across different markets. Remember, these are general observations. Actual results can vary significantly based on specific market conditions and individual trading strategies. It’s crucial to combine this knowledge with other analytical tools and risk management strategies for a more comprehensive approach to trading.
Confirmation Techniques That Enhance Engulfing Signals
Engulfing candlestick patterns are strong signals on their own, but become even more reliable with added confirmation. Experienced traders know a multi-pronged approach significantly improves the accuracy of these signals. Let's explore some effective techniques for confirming engulfing patterns, enabling you to trade more confidently.
Volume Analysis: Measuring the Strength
Volume analysis is essential for confirming engulfing patterns. It offers vital clues about the move's strength. A bullish engulfing pattern ideally shows higher volume on the green candle compared to the preceding red candle. This higher volume indicates strong buying pressure, reinforcing the reversal signal. Conversely, a bearish engulfing pattern should have higher volume on the red candle, validating selling pressure. For instance, a bullish engulfing pattern with low volume might signal weak buying conviction, potentially leading to a false breakout.
Momentum Oscillators: Understanding Market Sentiment
Momentum oscillators, like the Relative Strength Index (RSI) or the Moving Average Convergence Divergence (MACD), can provide valuable confirmation. Look for the RSI moving out of oversold territory or a bullish MACD crossover for a bullish engulfing pattern. This suggests increasing momentum, aligning with the reversal. The opposite is true for bearish engulfing patterns: look for the RSI entering overbought territory or a bearish MACD crossover. These converging signals increase the likelihood of a successful trade. However, remember that oscillators can sometimes give misleading signals, especially in volatile markets.
Support and Resistance Levels: Pinpointing Critical Zones
The location of an engulfing pattern relative to support and resistance levels heavily influences its reliability. A bullish engulfing pattern near a key support level strengthens the buy signal. This confluence suggests buyers are actively defending that level, raising the probability of a reversal upwards. A bearish engulfing pattern near a significant resistance level reinforces the sell signal. It indicates sellers are preventing further price increases. These key levels act as turning points in price action.
Combining Confirmation Factors: A Comprehensive Strategy
Combine these techniques for the best results. A bullish engulfing pattern with high volume, a bullish RSI crossover, and formation near support is a high-probability buy setup. This combination greatly increases the odds of a winning trade. Creating a decision matrix with multiple factors helps build a consistent trading approach. This offers well-defined rules and increases the likelihood of spotting true signals.
Conflicting Signals: Deciphering the Data
Sometimes, confirmation signals conflict. A bullish engulfing pattern might appear with high volume, but the RSI stays in oversold territory. These situations require careful analysis. They might indicate the reversal is still forming, needing further observation. Or, they could suggest underlying weakness, hinting at a possible false breakout. Interpreting these conflicting signals is key for refining your trading strategy and avoiding losses. By using both engulfing patterns and confirming indicators, you'll be better prepared to navigate the market and improve trading performance.
Avoiding Critical Mistakes With Engulfing Patterns
After exploring the power of engulfing candlestick patterns, it's important to understand the common traps that can lead to trading losses. Recognizing these pitfalls is just as crucial as identifying the patterns themselves. This knowledge empowers you to make more informed trading choices.
Misidentification: Seeing What Isn't There
One of the most frequent errors is misidentifying engulfing patterns. Just because one candle's body engulfs another doesn't automatically qualify it as a true engulfing pattern. The surrounding price action and the candles' relative size matter significantly. A small engulfing candle within a powerful trend, for example, likely holds little significance. A valid engulfing pattern requires the engulfing candle's body to be substantially larger than the previous candle. Carefully assess the size difference to avoid basing trades on weak signals.
Context Blindness: Ignoring the Bigger Picture
Overlooking the broader market context is another common mistake. Even perfectly formed engulfing patterns can fail if they go against the prevailing trend or occur in low-volume, choppy market conditions. A bullish engulfing pattern during a strong downtrend has a lower probability of success compared to one appearing after consolidation. Always analyze the overall market environment, including trend, volume, and volatility, before acting on an engulfing pattern.
Poor Execution: Entering and Exiting Too Early or Too Late
Incorrect trade execution can sabotage even the best-planned strategies. Entering too early, before the pattern's confirmation, or exiting too late, sacrificing potential profits, are common errors. For a bullish engulfing pattern, consider using the next candle's open for entry or waiting for a confirmed close above the engulfing candle's high for a more conservative approach. Conversely, for a bearish pattern, the next candle's open can be an entry point, or a confirmed close below the engulfing candle's low offers more confirmation. This approach helps capture more of the price move while setting a clear stop-loss.
Risk Management Failures: Risking Too Much on a Single Trade
Perhaps the most damaging mistake is poor risk management. Risking excessive capital on any single trade, even one based on a seemingly perfect setup, can be disastrous. Set your stop-loss based on the pattern and market volatility. This limits potential losses if the trade moves against you. Placing a stop-loss just below the low of the engulfing candle in a bullish pattern, for instance, helps protect against a failed reversal. No pattern guarantees success. Always determine an appropriate position size based on your risk tolerance and account size.
Overreliance on Engulfing Patterns Alone: The Importance of Confirmation
While engulfing patterns are valuable tools, relying solely on them without additional confirmation can lead to disappointment. Integrate other technical indicators like volume analysis, momentum oscillators (such as RSI and MACD), and support/resistance levels to validate your signals. A high-volume bullish engulfing pattern near a key support level, coupled with a bullish RSI crossover, is far more reliable than a low-volume pattern within a downtrend. Combining multiple factors creates a more robust trading strategy.
Ready to enhance your trading? ChartsWatcher provides professional charting, scanning, and analysis tools to help you identify and exploit market opportunities, including engulfing candlestick patterns. Explore ChartsWatcher's features and flexible pricing today!

