Read Candlestick Charts: Master Profitable Trading
The Rich History Behind Candlestick Trading
To truly grasp candlestick charts, understanding their history is key. It adds depth and connects you to a rich trading legacy. These charts didn't originate on Wall Street, but in the 18th-century Japanese rice markets. This adds a fascinating dimension to how they've changed technical analysis.
The charts trace back to 18th-century Japan, developed by Munehisa Homma, a famous rice trader. Their introduction to Western markets is largely attributed to Steve Nison's 1991 book, Japanese Candlestick Charting Techniques. This book significantly impacted how Western traders viewed technical analysis. It offered a visual way to understand market sentiment and price action.
Today, candlestick charts are essential in financial markets. They are used with other tools to predict market trends and reversals. This widespread adoption highlights their usefulness in interpreting complex price data. Candlestick charts help traders identify patterns that signal shifts in market sentiment. They essentially use past price changes to predict future movements. Learn more about the history of candlestick charts here. This move to Western markets marks a pivotal moment in how traders visualize and interpret data.
From Rice Paddies to Trading Screens: The Evolution of Candlesticks
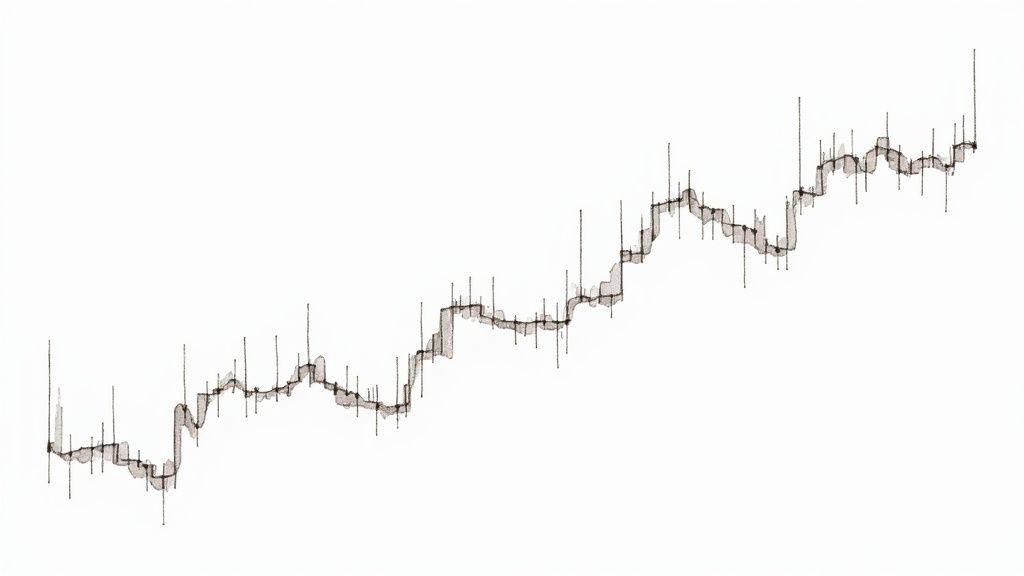
Japanese rice traders used candlesticks for centuries to monitor price changes and market feeling. They realized price wasn't random; it reflected trader psychology. This is still crucial for anyone learning about candlestick charts today. The ability to see this relationship between price and emotion is a key benefit of this charting method. It allowed them to predict market turns and make smarter trades. The visual design of candlesticks gave them a clear advantage over older methods.
Why Candlesticks Outperform Traditional Charts
Candlesticks provide a fuller picture of price action compared to basic line or bar charts. Line charts connect closing prices, and bar charts show the highs and lows. But candlesticks reveal the open, high, low, and close – all in one visual. This makes spotting potential turning points and gauging market sentiment easier. The clear display of opening and closing prices within each "candle" gives instant insights into buying and selling pressure. This offers vital data about market momentum and potential trend reversals. Such detailed information is crucial for successful technical analysis.
Connecting to Centuries of Trading Wisdom
Knowing the history of candlestick charts offers more than just interesting facts. It links modern traders to centuries of market knowledge. The principles used by Munehisa Homma and other early users of candlesticks are still relevant today. Recognizing these patterns connects traders to a long line of market analysis. By learning these patterns, traders understand the lasting principles of market behavior and human psychology that influence price changes. This historical context allows for a deeper understanding of current market conditions. It ultimately improves a trader’s ability to read candlestick charts effectively.
Decoding the Candlestick: What Each Element Reveals
Understanding candlestick charts is essential for any trader. Each candlestick provides a visual representation of price action over a specific time period, offering valuable insights into market sentiment and potential future movements. This visual language allows for a deeper understanding than simply looking at raw price data.
Anatomy of a Candlestick
Each candlestick, regardless of its size or color, is built from the same key components:
-
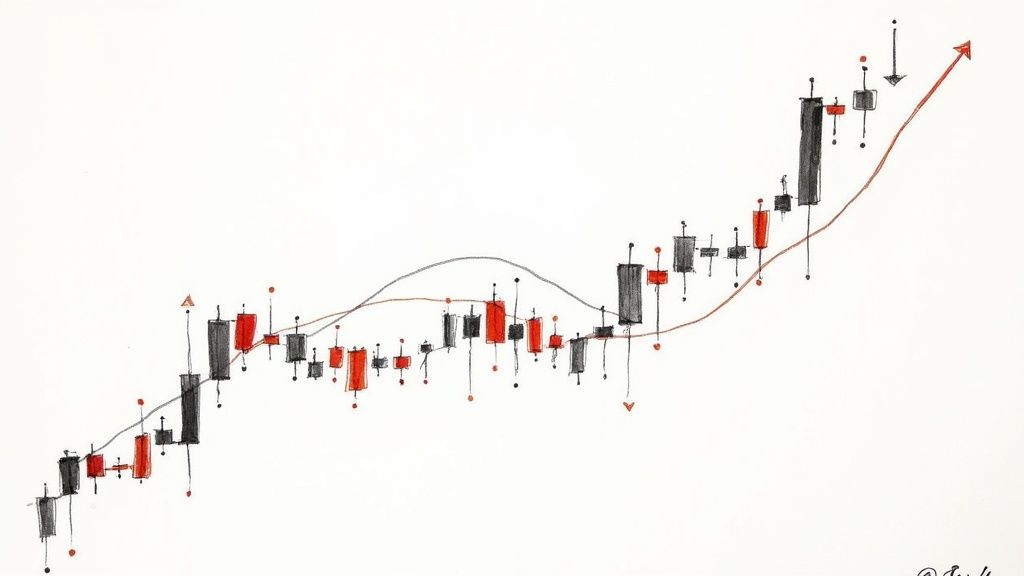
The Real Body: The thick, rectangular portion of the candlestick is known as the real body. This represents the price range between the opening and closing prices of the trading period. A green (or sometimes white/hollow) real body indicates the closing price was higher than the opening price, suggesting buying pressure. Conversely, a red (or sometimes black/filled) real body means the closing price was lower than the opening price, signaling selling pressure. The length of the real body also provides important information. A long body suggests strong momentum, while a short body indicates indecision or market consolidation.
-
The Wicks (or Shadows): Extending above and below the real body are thin lines called wicks, also known as shadows. These represent the highest and lowest prices reached during the trading period. A long upper wick can suggest buyers initially pushed prices higher, but then selling pressure emerged, preventing further upward movement. Similarly, a long lower wick can indicate strong selling initially drove prices lower, but buying support emerged, halting the decline. Short wicks indicate the price remained relatively stable near the opening and closing prices.
Candlestick charts rely on four data points: the opening price, closing price, high, and low. The candlestick's body visually displays whether the price closed higher or lower than it opened. The wicks illustrate the high and low prices within that timeframe. A bullish candle is typically hollow or green, representing a higher closing price than the opening price. A bearish candle, filled or red, signifies a lower closing price. This color-coding system helps traders quickly assess market momentum. Studies have shown certain candlestick patterns can predict market movements with notable success. For example, the bullish engulfing pattern has shown an approximate 65% accuracy rate in predicting price increases. You can explore more about candlestick patterns here.
Candlestick Components Breakdown
To visualize the information contained within a candlestick, let's examine each component in a table. The table below, "Candlestick Components Breakdown", provides a detailed look at each element and its market implications.
| Component | Visual Representation | Market Information | Trading Signal |
|---|---|---|---|
| Real Body (Green) | Thick, green rectangle | Closing price higher than opening price | Buying pressure, potential uptrend |
| Real Body (Red) | Thick, red rectangle | Closing price lower than opening price | Selling pressure, potential downtrend |
| Long Upper Wick | Thin line extending above the real body | Buyers met with resistance, potential price rejection | Caution for buyers, potential shorting opportunity |
| Long Lower Wick | Thin line extending below the real body | Sellers met with support, potential price bounce | Caution for sellers, potential buying opportunity |
| Short Wicks | Short lines above or below the real body | Price stability near the open or close | Consolidation, potential breakout or breakdown |
This table summarizes the visual cues and market information represented by each candlestick component. Understanding these elements individually lays the groundwork for recognizing more complex candlestick patterns.
Context is Key
While understanding individual candlesticks is crucial, analyzing them within the context of the overall chart is equally important. A single candlestick’s meaning can significantly change depending on surrounding price action and broader market conditions.
From Single Candles to Powerful Patterns
Individual candlesticks provide valuable insights, but recognizing patterns formed by multiple candlesticks unlocks the real power of this charting technique. Patterns like the hammer, doji, or engulfing patterns can signal potential trend reversals, continuations, or periods of consolidation. Learning to identify and interpret these patterns in context is vital for successful candlestick analysis. Combining this visual language with other technical indicators and market analysis can transform trading decisions from reactive to proactive. This empowers you to anticipate market movements and capitalize on emerging opportunities.
Essential Patterns That Actually Predict Market Moves
Now that we understand the individual parts of candlesticks, let's explore how they combine to create predictive patterns. These patterns are the visual cues experienced traders use to anticipate market movements and make informed decisions. Understanding these patterns is crucial for anyone who wants to effectively interpret candlestick charts.
Single Candlestick Patterns: Quick Insights
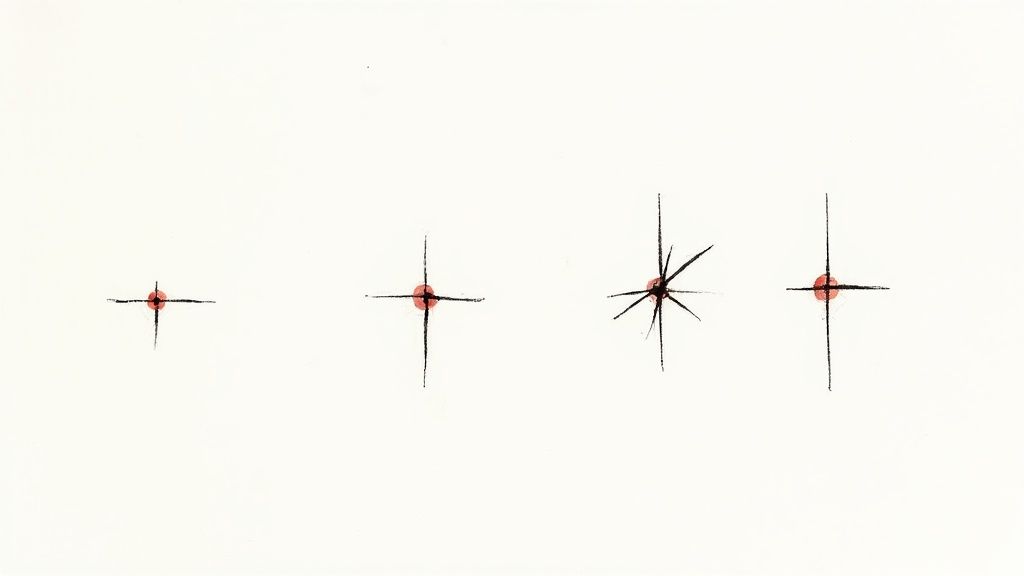
Even individual candlesticks can provide valuable information about market sentiment. For instance, a Doji, where the open and close prices are almost identical, signals market indecision. This can be a powerful indicator, suggesting a possible shift in momentum.
A Hammer, identified by a small body and a long lower wick, suggests a potential bullish reversal, especially when found at the bottom of a downtrend. Conversely, a Shooting Star, with a small body and a long upper wick, hints at a possible bearish reversal at the top of an uptrend. These single-candle patterns offer quick glimpses into potential market turning points.
Multi-Candlestick Patterns: Powerful Signals
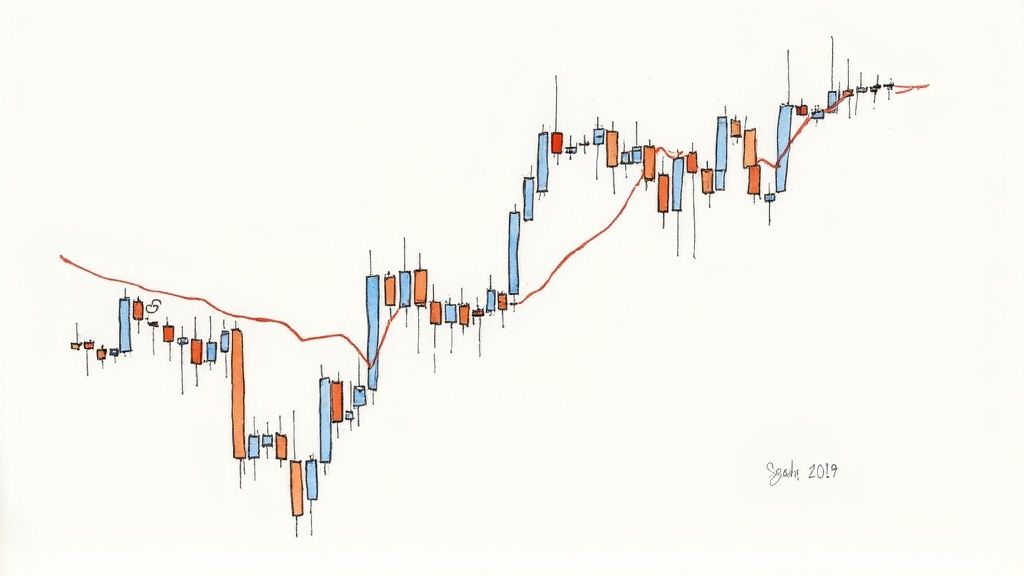
Multi-candlestick patterns offer even more reliable signals. The Engulfing Pattern, where a larger candlestick completely engulfs the previous one, indicates a potential reversal. This pattern highlights a significant shift in market control.
The Morning Star pattern, a three-candlestick formation, suggests a bullish reversal after a downtrend. It begins with a bearish candle, followed by a small-bodied candle (showing indecision), and concludes with a strong bullish candle (signaling the reversal). The Evening Star pattern, its bearish counterpart, signals a potential downtrend after an uptrend. For further reading, see How to master the engulfing candlestick pattern for profits. These multi-candle formations provide more substantial confirmation of potential trend changes.
Understanding Reliability and Context
It's crucial to remember that no pattern guarantees success. Candlestick patterns have been researched extensively, with studies examining the success rates of various patterns. For example, the morning star pattern has a reported success rate of about 65% in predicting price increases.
The three outside up pattern has a success rate of roughly 70%, highlighting the potential for using these patterns in predictive trading strategies. However, combining these patterns with other technical analysis tools is vital for improved reliability. Learn more about candlestick patterns here. A pattern's effectiveness depends heavily on the surrounding market conditions.
Combining Patterns with Other Indicators
Experienced traders often combine candlestick patterns with other technical indicators to enhance their effectiveness. Using volume indicators, for instance, can help confirm a pattern's strength. A bullish engulfing pattern accompanied by high volume is a much stronger signal than one with low volume.
Analyzing patterns alongside support and resistance levels can identify potential entry and exit points. A hammer pattern near a strong support level increases the likelihood of a bullish reversal. Understanding market structure and the overall trend helps filter out false signals and find high-probability setups.
Identifying the Top Performers
While numerous candlestick patterns exist, focusing on a select few can simplify your analysis. The following table highlights some of the most reliable and frequently used candlestick patterns, offering a comparison of their success rates and optimal usage:
Top 10 Candlestick Patterns and Their Reliability: This table compares common candlestick patterns, their success rates, and ideal market conditions.
| Pattern Name | Signal Type | Success Rate | Best Market Conditions | Key Characteristics |
|---|---|---|---|---|
| Engulfing Pattern | Reversal | Varies, generally considered reliable | End of an uptrend or downtrend | A large candlestick completely engulfs the previous one. |
| Morning Star/Evening Star | Reversal | ~65% / Varies | Bottom of a downtrend/Top of an uptrend | Three-candlestick formation indicating a shift in momentum. |
| Hammer/Shooting Star | Reversal | Varies, higher with confluence | Bottom of a downtrend/Top of an uptrend | Single candlestick with a small body and a long lower/upper wick. |
| Doji | Indecision | N/A (indicates potential reversal) | Periods of consolidation or uncertainty | Candlestick with open and close prices very close together. |
| Three Outside Up/Down | Reversal | ~70% / Varies | Bottom of a downtrend/Top of an uptrend | Three-candlestick pattern, similar to engulfing, with a stronger confirmation. |
| Harami | Reversal or Continuation | Varies depending on context | Trending or consolidating markets | Two-candlestick pattern with the second candle's body contained within the first. |
| Piercing Line/Dark Cloud Cover | Reversal | Moderately reliable | Bottom of a downtrend/Top of an uptrend | Two-candlestick pattern involving a strong second candle that closes significantly into the first candle's body. |
| Bullish/Bearish Abandoned Baby | Reversal | High reliability when confirmed | Bottom of a downtrend/Top of an uptrend | Three-candlestick pattern characterized by a gap between the first two candles and a doji as the second candle. |
| Tweezer Top/Bottom | Reversal | Moderate reliability | Top of an uptrend/Bottom of a downtrend | Two candlesticks with matching highs/lows and opposite bodies. |
| Rising/Falling Three Methods | Continuation | High reliability when confirmed | Established uptrend/downtrend | Five-candlestick pattern indicating a temporary pause in the trend before continuation. |
By mastering these key patterns and using them with other indicators, you can significantly improve your ability to interpret candlestick charts and anticipate market movements. Consistent practice and analysis are key to refining your pattern recognition skills and developing a profitable trading strategy. Focus on understanding the psychology behind each pattern and the context in which it occurs. This will help you interpret market signals more effectively. Remember to always manage your risk and never rely solely on any single indicator or pattern.
How Day Traders Read Candlesticks for Rapid Profits
Day trading involves buying and selling assets within the same day, aiming to profit from small price changes. This fast-paced approach requires quick thinking and precise timing. Candlestick charts offer a valuable visual tool for analyzing these rapid market movements, allowing traders to quickly interpret complex price information. This real-time insight enables traders to assess market sentiment and react to changing conditions.
Timeframe Strategies for Day Traders
Day traders frequently use multiple timeframes alongside candlestick charts. They might use a 1-minute chart for precise entry and exit points, while simultaneously consulting a 5-minute or 15-minute chart to understand the short-term trend. A hourly chart provides context about the overall market.
This multi-timeframe approach offers a comprehensive view while maintaining trade precision. For example, a trader might spot a bullish engulfing pattern on a 15-minute chart and then use the 1-minute chart for optimal trade entry.
Identifying Momentum Shifts and Reversals
Candlestick patterns provide valuable information about momentum shifts and potential reversals. Patterns like the hammer, doji, and engulfing patterns each have unique implications, helping traders anticipate market direction changes. A doji can signal market indecision, hinting at a potential momentum shift. A hammer often appears at the bottom of a downtrend, suggesting a possible bullish reversal.
Candlestick charts are essential for day traders because they convey detailed price information over short periods. These charts help traders identify potential buying and selling opportunities based on patterns like engulfing candles or hammer formations. These patterns help assess market sentiment and potential reversals, informing entry and exit decisions. The real-time nature of candlestick charts provides immediate feedback for quick strategy adjustments. Learn more about day trading strategies here.
The Role of Volume Analysis
Volume analysis is crucial for confirming candlestick patterns. High volume with a bullish engulfing pattern strengthens the signal and suggests conviction behind the upward movement. Low volume during a breakout could indicate a lack of follow-through, possibly a false signal. Traders must consider the volume accompanying the patterns, not just the formations themselves. You might be interested in: 8 Day Trading Chart Patterns Every Trader Should Know.
Practical Risk Management for Day Traders
Risk management is essential in day trading. Traders often use candlestick patterns to set stop-loss orders, automatically exiting a trade if the price moves unfavorably. This limits potential losses and protects capital. Candlestick analysis also helps determine profit targets, allowing traders to lock in gains at desired levels. This disciplined approach ensures effective risk management, even during volatile periods.
Case Studies and Real-World Examples
Analyzing real-world trading sessions is vital for understanding how professional day traders use candlestick charts. Examining their real-time pattern interpretation offers practical insights. This can help traders identify patterns more effectively in live trading. Studying real-world examples refines pattern understanding and builds confidence in applying these strategies.
Advanced Techniques That Separate Pros From Amateurs
While understanding individual candlestick patterns is essential, professional traders use more nuanced techniques. They combine patterns, analyze clusters of candlesticks, and interpret them within the broader market context. This sets them apart from those who rely solely on basic pattern recognition.
Combining Candlestick Patterns for Enhanced Signals
Professionals often analyze combinations of patterns. For example, a doji after a series of bearish candles may not confirm a reversal. However, if followed by a bullish engulfing pattern, the combined signal strengthens significantly.
This combined analysis provides a more robust signal. It allows traders to filter out weaker signals and focus on high-probability setups.
Candlestick Cluster Analysis: Uncovering Hidden Trends
Analyzing clusters of candlesticks can reveal hidden trends. A cluster with long upper wicks and small bodies suggests persistent selling pressure and potential resistance.
This cluster analysis offers valuable insights into market dynamics, even without readily apparent specific patterns. These observations provide information about the strength of buyers and sellers, helping anticipate future price movements.
Contextual Interpretation: Reading Between the Lines
Even reliable patterns can be misleading without considering the broader market context. A hammer pattern at a strong support level is more significant than one within a trading range. The support level adds confluence to the pattern.
Volume also validates candlestick signals. High volume with a bullish engulfing pattern confirms reversal strength, while low volume suggests a lack of conviction. Combining candlestick analysis with other technical indicators and market analysis is vital.
Integrating Candlestick Signals with Other Technical Tools
Professional traders integrate candlestick signals with other technical analysis tools.
- Support and Resistance Levels: Identifying these helps confirm patterns. A bullish engulfing pattern near support strengthens its signal.
- Volume Confirmation: High volume with bullish patterns confirms conviction, while low volume can indicate weaker signals.
- Market Structure: Understanding the broader trend helps filter out false signals. For example, a hammer pattern's significance changes depending on whether the market is trending down or sideways.
This integrated approach helps traders understand the market narrative. It allows for more strategic decisions, potentially leading to higher profitability. This isn't just about reading candlesticks, but understanding market forces. By combining candlestick analysis with other technical tools, professionals gain a comprehensive market view, separating themselves from amateurs who rely on isolated signals.
Avoiding the Costly Mistakes When Reading Charts
Reading candlestick charts effectively goes beyond simply recognizing patterns. It demands a disciplined approach and a keen awareness of potential pitfalls that can lead to significant financial losses. This is where separating objective analysis from wishful thinking becomes absolutely essential.
The Danger of Confirmation Bias
One of the most prevalent mistakes is confirmation bias. This refers to our tendency to favor information that supports pre-existing beliefs while disregarding contradictory evidence. Imagine a trader convinced a stock will rise, focusing solely on bullish candlestick patterns while ignoring bearish ones. This selective interpretation can result in holding losing positions for too long or missing profitable exit points. Maintaining objectivity is paramount for accurate chart analysis.
Market Conditions Can Invalidate Textbook Setups
Another frequent error is applying textbook candlestick patterns without considering the broader market environment. A hammer pattern, often a bullish reversal signal, might be less reliable during a significant market downtrend. Similarly, an engulfing pattern might fail in a low-volume, consolidating market. Always assess the prevailing market conditions and the overall trend when interpreting candlestick patterns.
How Cognitive Biases Sabotage Pattern Recognition
Our brains are naturally inclined to find patterns, even where none exist. This can lead to perceiving patterns in random price movements, especially when emotionally invested in a trade. This is particularly risky with candlestick analysis, where the visual presentation of charts can amplify these biases. Traders need to develop strategies to mitigate these biases. These could include using objective criteria for pattern validation and stepping away from trading during periods of heightened emotion.
Real Trading Disasters: Lessons Learned
Examining real trading disasters stemming from misinterpreting candlestick charts offers invaluable lessons. One common scenario involves entering a trade based on a single candlestick pattern without confirming it with other indicators or considering the market context. A trader might see a doji and prematurely assume a reversal, disregarding preceding price action or volume. Such actions can lead to ill-timed entries or exits, resulting in substantial losses. Learning from these past mistakes is essential for making better trading decisions.
Developing a Disciplined Approach to Pattern Validation
To prevent costly errors, traders should cultivate a disciplined approach to pattern validation. This involves:
-
Confirmation with Other Indicators: Utilize other technical indicators, such as volume, moving averages, and relative strength index (RSI), to validate candlestick signals. For example, a bullish engulfing pattern accompanied by high volume is a stronger indicator than one with low volume.
-
Contextual Analysis: Always factor in the overall market trend and surrounding price action when interpreting candlestick patterns. A hammer pattern near a key support level holds more significance than one appearing mid-range.
-
Backtesting: Test your candlestick strategies using historical data to assess their performance under various market conditions. This helps determine which patterns are most dependable and in what situations.
-
Risk Management: Implement appropriate stop-loss orders to limit potential losses. Candlestick patterns can inform stop-loss placement based on potential reversal points.
By incorporating these methods, traders can progress beyond simply reading candlestick charts and develop a more nuanced understanding of market dynamics. This not only helps avoid costly mistakes but also enhances the overall profitability of trading decisions.
Building Your Trading System Around Candlestick Mastery
Reading candlestick charts effectively is the first step in your trading journey. But to truly succeed and see consistent profits, you need a comprehensive trading system built around this knowledge. This involves a structured approach that not only identifies potential opportunities but also manages risk and adapts to the ever-shifting market dynamics.
Structuring a Rules-Based System
A rules-based system offers a crucial framework for objective trading decisions. It helps remove emotional biases and encourages consistency. Start by defining clear entry and exit rules based on specific candlestick patterns.
For example, a bullish engulfing pattern near a support level might trigger an entry. On the other hand, a bearish engulfing pattern after a strong upward trend could signal an exit point. These rules should be precise and quantifiable.
Don't forget risk management. Establish your maximum risk per trade, determine your position sizing, and set stop-loss levels. These safeguards protect your capital during periods of market volatility. Markets are dynamic, so your trading system must be adaptable. Regularly review and adjust your rules as needed.
Developing a Trading Journal for Pattern Tracking
A trading journal is essential for tracking your candlestick-based strategies. Log every trade, including the specific candlestick pattern that triggered the entry, the entry and exit prices, your stop-loss and take-profit levels, and the final outcome.
This detailed record provides valuable information for assessing your system's effectiveness. Analyze your journal entries to pinpoint which candlestick patterns work best under different market conditions. This allows you to fine-tune your strategies and concentrate on setups with higher probability.
Regularly review your journal to identify any weaknesses in your system and make adjustments. This process of continual improvement is vital for sustained trading success.
Integrating Technical Analysis and Fundamental Catalysts
Candlestick patterns provide valuable technical insights, but adding fundamental analysis can sharpen your trading edge. Fundamental catalysts, like news events, earnings reports, or economic data releases, can significantly impact market movements.
For example, a positive earnings surprise for a company could bolster a bullish candlestick pattern, increasing the chance of an upward price move. Combining technical and fundamental analysis gives you a more complete market understanding. This multifaceted perspective leads to better-informed decisions.
Continuous Improvement and Pattern Recognition
Mastering candlestick patterns is a continuous journey. Practice regularly by analyzing historical charts and recognizing different formations. This reinforces your pattern recognition skills and builds confidence in your system.
Stay informed about market trends and any new candlestick pattern variations. Consider joining TradingView communities or connecting with experienced traders to gain valuable insights. Continuous learning is crucial in the dynamic market environment.
Ready for a powerful platform to enhance your trading? ChartsWatcher offers customizable tools for tracking market movements, setting alerts, and backtesting strategies. With its flexible dashboards and advanced features, ChartsWatcher empowers traders to make well-informed decisions based on real-time data.
