Master Technical Trading Patterns for Better Trading Results
Decoding the Markets: Essential Technical Trading Patterns
Want to decipher market movements and improve your trading strategy? This listicle reveals eight essential technical trading patterns every trader should recognize. Learn to identify formations like Head and Shoulders, Double Tops and Bottoms, Bull and Bear Flags, Cup and Handle, Triangles, Fibonacci Retracement, Candlestick patterns, and Elliott Wave. Mastering these technical trading patterns provides valuable insights into potential price action, allowing you to pinpoint optimal entry and exit points and manage risk. Let's dive in.
1. Head and Shoulders Pattern
The Head and Shoulders pattern is a prominent technical trading pattern known for its reliability in predicting trend reversals. This powerful formation signals a potential shift in market direction, allowing traders to anticipate and capitalize on changes in momentum. It belongs in any discussion of technical trading patterns because of its clear structure, relatively high success rate, and potential for generating substantial profits when correctly identified.

The pattern consists of three distinct peaks, resembling a head and two shoulders. The highest peak forms the "head," while the two lower peaks on either side represent the "left shoulder" and "right shoulder." A "neckline," drawn connecting the lows between the peaks, acts as a critical support or resistance level. In a bearish Head and Shoulders "top" formation, the price action forms the left shoulder followed by a higher peak (the head), then a second shoulder roughly equal in height to the first. The neckline slopes downwards in this bearish scenario. When the price decisively breaks below the neckline after forming the right shoulder, it confirms the pattern and signals a bearish reversal. Conversely, an inverse Head and Shoulders "bottom" formation occurs at market bottoms, exhibiting three troughs with the middle trough being the deepest. The neckline in this bullish scenario slopes upwards. A break above the neckline confirms the pattern and suggests a bullish reversal.
Volume plays a crucial role in validating the Head and Shoulders pattern. Typically, volume decreases during the formation of the head and shoulders, reflecting weakening momentum. A surge in volume accompanying the neckline breakout confirms the pattern's strength and increases the likelihood of a sustained price move in the breakout direction. The distance between the head and the neckline is often used to project price targets after the breakout.
Notable examples of successful Head and Shoulders implementations include Bitcoin's bearish formation in November 2021, which preceded a significant market downturn, and Apple's (AAPL) bullish inverse Head and Shoulders in March 2020, foreshadowing its subsequent bull run. These examples highlight the pattern's potential across different asset classes. Learn more about Head and Shoulders Pattern
Pros:
- High reliability when properly formed and confirmed by volume.
- Clearly defined entry and exit points, facilitating risk management.
- Measurable price targets based on pattern dimensions.
Cons:
- Formation can take weeks or months, requiring patience.
- Possibility of false breakouts, leading to premature entries or exits.
- Requires confirmation through volume and follow-through price action.
Tips for Utilizing the Head and Shoulders Pattern:
- Confirmation is Key: Wait for a confirmed break of the neckline before entering a position.
- Measure Your Moves: Use the distance from the head to the neckline to project potential price targets after the breakout.
- Momentum Matters: Combine the Head and Shoulders pattern with momentum indicators (e.g., RSI, MACD) to increase the probability of a successful trade.
- Trend Awareness: Exercise caution when trading against the longer-term trend, as this increases risk.
The Head and Shoulders pattern is a powerful tool for professional traders, stock market analysts, financial institutions, and independent investors alike. It provides valuable insights into potential trend reversals, offering opportunities to profit from both bullish and bearish market movements. Popularized by technical analysts like Thomas Bulkowski and John Murphy, this pattern remains a cornerstone of technical analysis, assisting traders in navigating the complexities of financial markets. Leveraging its predictive capabilities can significantly enhance trading strategies for all levels of market participants, from day traders to long-term investors.
2. Double Top and Double Bottom
Double Top and Double Bottom patterns are highly sought-after technical trading patterns used to predict potential trend reversals in various financial markets. These formations are considered classic reversal patterns within technical analysis and are valued for their relative simplicity and potential for generating significant trading opportunities. Their inclusion in any discussion of technical trading patterns is essential due to their widespread recognition and practical application by traders of all experience levels.
These patterns are formed by the interaction of price with support and resistance levels. A Double Top, resembling the letter "M", indicates a bearish reversal. It occurs when the price reaches a resistance level twice but fails to break through on the second attempt. Conversely, a Double Bottom, resembling the letter "W", signals a bullish reversal. This pattern forms when the price tests a support level twice and bounces off it on the second test.
How they work:
The underlying principle behind these patterns is the exhaustion of the prevailing trend. In a Double Top, buyers lose momentum after failing to breach the resistance, leading to increased selling pressure and a price decline. In a Double Bottom, sellers are unable to push the price below the support, attracting buyers and fueling a price advance. The patterns are considered complete when the price breaks through the "neckline," which is a horizontal line drawn between the two peaks (Double Top) or troughs (Double Bottom). This breakout is often accompanied by a surge in trading volume, confirming the reversal.
Features:
- Two comparable peaks (Double Top) or troughs (Double Bottom).
- Peaks or troughs should be separated by at least a few weeks, particularly on longer timeframes, to avoid mistaking short-term price fluctuations for a genuine pattern.
- Confirmation by a break of the neckline, ideally with increased volume.
- The distance from the peaks/troughs to the neckline can be projected downward/upward from the neckline breakout to estimate potential price targets.
Pros:
- Relatively easy to identify compared to more complex technical trading patterns.
- Provides clear stop-loss levels (just beyond the second top or bottom).
- Successful patterns often lead to significant price moves, offering attractive risk-reward ratios.
Cons:
- Frequent false signals, especially in volatile markets. Not every double top or bottom results in a confirmed reversal.
- Requires patience to wait for neckline confirmation. Premature entry can lead to losses if the pattern fails.
- Lower reliability in shorter timeframes where price action can be more erratic.
Examples:
- Facebook (META) formed a notable Double Bottom in late 2018 before rallying significantly in 2019.
- Gold formed a Double Top in August 2020, which preceded a multi-month correction.
Tips for Using Double Top and Double Bottom Patterns:
- Confirm with volume: Increased volume on the neckline breakout adds validity to the pattern.
- Deeper corrections are more reliable: The greater the price correction between the peaks or troughs, the more significant the potential reversal.
- Trade with the primary trend: Avoid trading patterns that form against the prevailing long-term trend.
- Calculate price targets: Use the depth of the pattern (distance from peaks/troughs to neckline) to project potential price targets after the breakout.
Historical Context:
These patterns were popularized by Charles Dow, one of the founders of Dow Theory, and further elaborated upon in Edwards and Magee's seminal work, "Technical Analysis of Stock Trends." This historical grounding reinforces their enduring relevance in modern technical analysis.
By understanding the characteristics, benefits, and limitations of Double Top and Double Bottom patterns, traders can effectively integrate these powerful tools into their technical analysis arsenal and enhance their decision-making process. They are particularly beneficial for professional traders, stock market analysts, financial institutions, and independent investors aiming to identify potential trend reversals and capitalize on profitable trading opportunities. Stock trading educators also frequently utilize these patterns in their curriculum to teach fundamental technical analysis concepts. Furthermore, these patterns can be incorporated into stock scanners and screeners to automatically identify potential trading setups. For day traders, while the patterns might be less reliable on very short timeframes, they can still provide useful insights when combined with other indicators.
3. Bull and Bear Flags
Bull and Bear Flags are essential technical trading patterns representing brief periods of consolidation within a larger, powerful trend. These patterns are categorized as "continuation patterns," suggesting the prevailing trend will likely resume after the consolidation phase concludes. This makes them a valuable tool for traders looking to capitalize on established momentum within the market. Specifically, a Bull Flag forms during an uptrend and appears as a small, downward-sloping channel following a sharp upward price movement (known as the "flagpole"). Conversely, a Bear Flag develops during a downtrend as a small, upward-sloping channel after a sharp decline.
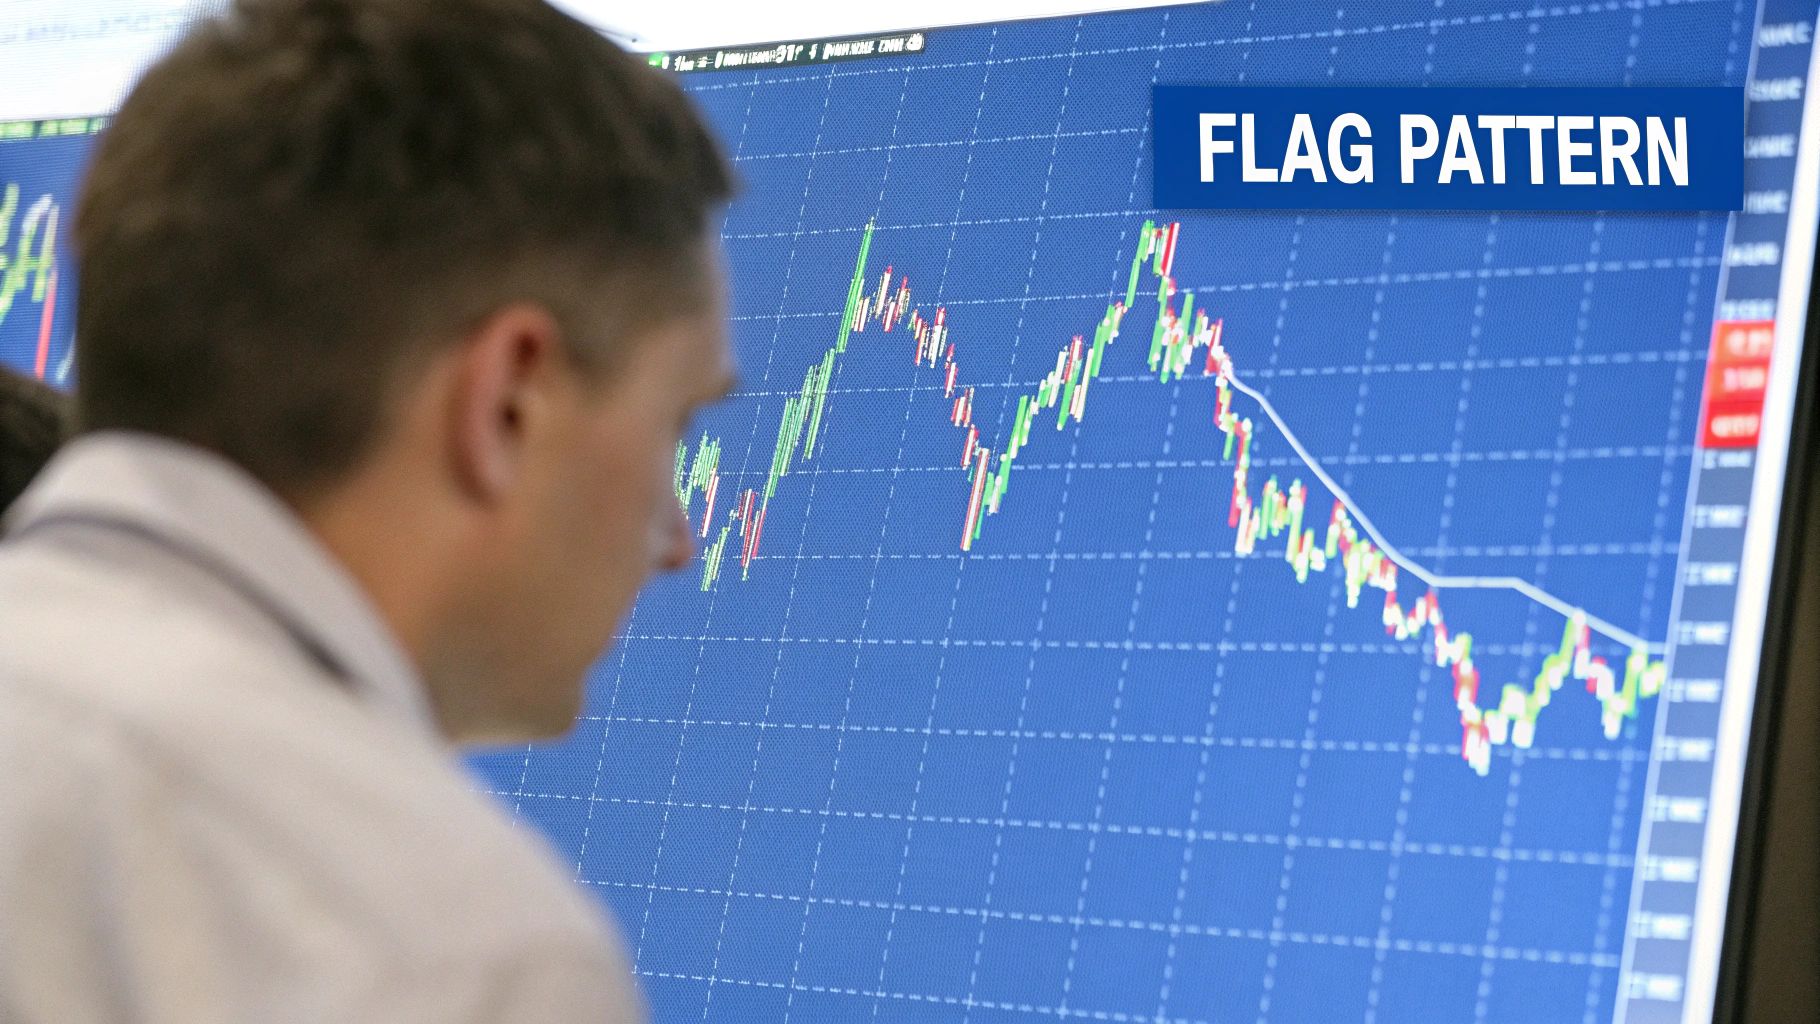
These patterns are characterized by several key features. Firstly, there's the initial sharp, directional move (the flagpole) followed by the consolidation period (the flag). The consolidation typically moves counter to the prevailing trend, creating the distinct "flag" shape. Trading volume usually diminishes during the flag's formation, indicating a temporary pause in market participation. The pattern is considered complete when the price decisively breaks out of the consolidation channel in the direction of the original trend. This breakout is often accompanied by a surge in volume, confirming the renewed strength of the trend.
For professional traders, stock market analysts, and independent investors, Bull and Bear Flags offer several advantages. They provide high-probability trading opportunities in trending markets, especially when confirmed by increased volume on the breakout. The patterns have clearly defined entry points, stop-loss levels (typically placed just beyond the opposite side of the flag), and profit targets (often projected using the length of the flagpole, known as a "measured move"). Furthermore, these patterns generally resolve relatively quickly, usually within 1-3 weeks, making them suitable for various trading styles including day trading. Their applicability across different timeframes and markets, from stocks and futures to forex, enhances their versatility for technical traders.
However, like all technical trading patterns, Bull and Bear Flags have limitations. They can sometimes be difficult to distinguish from potential reversal patterns, especially in volatile markets. False breakouts can occur, particularly in choppy or range-bound markets, leading to premature entries or stop-outs. Their effectiveness also diminishes in low-volume markets, as the breakout confirmation becomes less reliable.
Tesla's 2020 rally, where the stock surged from $100 to $900, showcased multiple bull flags, providing astute traders with numerous profitable entry opportunities. Conversely, the S&P 500 formed a bear flag in October 2008 before continuing its decline during the financial crisis, highlighting the pattern's relevance even in bearish market conditions.
For optimal implementation of Bull and Bear Flags within your technical trading strategy, consider the following tips: Enter trades when the price breaks out of the flag pattern with a corresponding increase in volume, confirming the breakout's validity. Set stop-loss orders beyond the opposite side of the flag to minimize losses in case of a false breakout. Utilize the flagpole's length to project minimum price targets using the measured move technique. Remember, flags that form after strong, established trend moves tend to be more reliable than those appearing in weaker or less defined trends. By understanding the nuances of Bull and Bear Flags, traders can effectively leverage these powerful patterns to identify high-probability trading setups and capitalize on trending markets. These patterns rightfully earn their place amongst crucial technical trading patterns due to their clear structure, defined entry and exit points, and potential for profitable trading opportunities. They were popularized by technical analyst Alan Andrews and further developed by Richard Schabacker, solidifying their position as a cornerstone of technical analysis.
4. Cup and Handle Pattern
The Cup and Handle pattern is a classic bullish continuation technical trading pattern that suggests a pause in an ongoing uptrend, followed by a resumption of that upward movement. It earns its spot on the list of essential technical trading patterns due to its relatively high reliability and clear price targets, making it a favorite among professional traders, stock market analysts, and independent investors alike. This pattern, popularized by William O'Neil in his book "How to Make Money in Stocks", offers valuable insights for those seeking to capitalize on established uptrends.
This pattern gets its name from its visual resemblance to a teacup with a handle. The "cup" forms over several weeks or months as a stock corrects, forming a rounded bottom. This correction typically retraces between 1/3 and 2/3 of the previous advance, indicating a healthy pullback. Following the cup formation, the "handle" develops as a smaller, downward-drifting consolidation period. The handle represents the final shakeout of weak hands before the stock resumes its uptrend. Crucially, the handle should retrace less than 1/3 of the cup's advance.
How it Works: The Cup and Handle pattern capitalizes on the psychology of market participants. The cup formation represents a period of profit-taking and consolidation after a significant price advance. The handle represents a final wave of selling pressure, creating a lower-risk entry point for those anticipating the continuation of the uptrend. The breakout above the handle's resistance line, often accompanied by increasing volume, signals the resumption of the uptrend.
Features:
- U-shaped cup: A rounded bottom is essential; V-shaped dips are not considered true cup formations.
- Downward drifting handle: A slight downward drift signifies consolidation before the breakout.
- Volume Dynamics: Volume generally decreases during the cup formation and increases significantly during the breakout above the handle.
Pros:
- High Reliability: When identified correctly, Cup and Handle patterns boast a strong track record of predicting uptrend continuations.
- Measurable Price Targets: The depth of the cup provides a clear price target. Measure the distance from the bottom of the cup to its rim and project that same distance upward from the breakout point above the handle.
- Clear Entry Points: The breakout above the handle's resistance line provides a well-defined entry point.
Cons:
- Time-Consuming Formation: Cup and Handle patterns can take several weeks, months, or even over a year to fully develop, requiring patience.
- False Breakouts: Market conditions can shift, leading to failed breakouts and potential losses.
- Less Reliable in Volatile Markets: The pattern’s reliability diminishes during periods of high market volatility.
Examples:
- Microsoft (MSFT): Formed a textbook Cup and Handle pattern in 2016 preceding a multi-year rally.
- Bitcoin: Showcased a Cup and Handle pattern in late 2020 before its surge to new all-time highs.
Tips for Using the Cup and Handle Pattern:
- Look for Rounded Cups: Ensure the cup has a smooth, U-shaped bottom, avoiding sharp V-shaped dips.
- Handle Placement: Ideally, the handle should form in the upper half of the cup.
- Volume Confirmation: Wait for a breakout above the handle's resistance with a corresponding increase in trading volume.
- Price Target Projection: Measure the depth of the cup and project that distance from the breakout point to determine a potential price target.
The Cup and Handle pattern provides valuable insights for traders seeking to identify and capitalize on continuing uptrends. By understanding the pattern's characteristics, features, and limitations, investors can make informed trading decisions and potentially increase their profitability. While other technical trading patterns exist, the Cup and Handle's clear entry and exit points, coupled with its measurable price targets, solidifies its place as a powerful tool for navigating the complexities of the stock market. Remember to combine this pattern with other technical indicators and fundamental analysis for a comprehensive trading strategy.
5. Triangle Patterns (Symmetrical, Ascending, Descending)
Triangle patterns are essential technical trading patterns representing periods of price consolidation before a potential breakout. These patterns are formed by converging trendlines that connect a series of peaks and troughs, creating a distinct triangle shape on a price chart. Understanding these patterns can provide valuable insights for traders looking to capitalize on impending price movements. They deserve a place on any list of important technical trading patterns due to their clear visual signals and potential for well-defined entry and exit points.
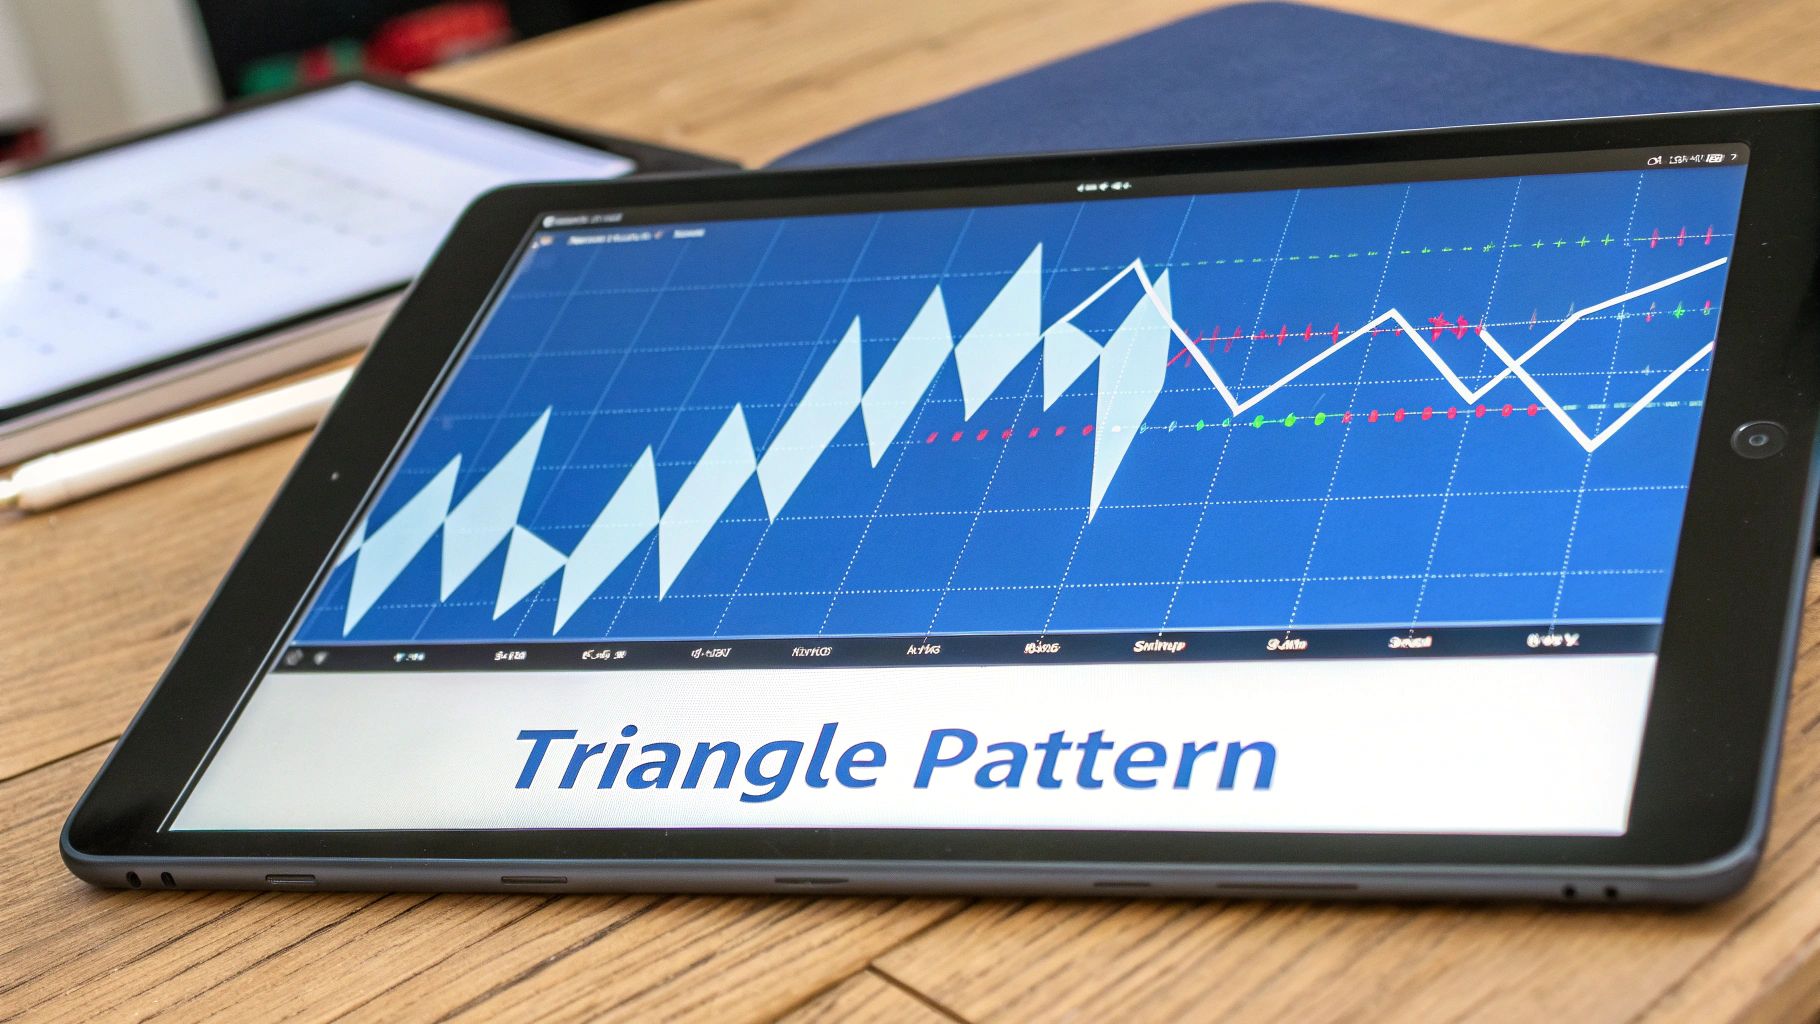
There are three primary types of triangle patterns: symmetrical, ascending, and descending. Each type offers unique predictive capabilities based on its shape and the prevailing market context.
-
Symmetrical Triangles: Characterized by converging trendlines with similar slopes, symmetrical triangles represent a period of indecision in the market. Neither bulls nor bears have a clear advantage, making the breakout direction unpredictable. While the breakout can occur in either direction, it often aligns with the preceding trend.
-
Ascending Triangles: These bullish patterns feature a flat upper resistance line and a rising support line. They suggest increasing buying pressure as the price consolidates. Breakouts typically occur upwards, indicating a continuation or strengthening of an uptrend.
-
Descending Triangles: These bearish patterns are formed by a flat lower support line and a falling resistance line. They reflect increasing selling pressure as the price consolidates. Breakouts usually occur downwards, signaling a continuation or intensification of a downtrend.
Features of Triangle Patterns:
- Converging trendlines connecting a series of highs and lows.
- Formation typically occurs over 1-3 months but can appear on any timeframe.
- Decreasing volume during pattern formation, followed by increasing volume during breakout.
- Narrowing trading range as the pattern progresses.
Pros of Using Triangle Patterns:
- Clear visual signals of accumulation (ascending) or distribution (descending).
- Well-defined entry points upon confirmation of a breakout.
- Measurable price targets based on the height of the triangle.
- Applicable across multiple timeframes and various markets.
Cons of Using Triangle Patterns:
- Potential for multiple false breakouts before a genuine price move.
- Difficulty in predicting the breakout direction of symmetrical triangles.
- Risk of failed breakouts, especially when triangles form at the end of extended trends.
Examples of Triangle Patterns:
- The S&P 500 formed a symmetrical triangle in late 2018 before breaking downward in December.
- Amazon (AMZN) formed an ascending triangle in April 2020 before continuing its uptrend.
Tips for Trading with Triangle Patterns:
- Trade in the direction of the longer-term trend for higher probability setups.
- Enter a position after the price closes beyond the triangle boundary, not on the initial penetration. This helps confirm the breakout and reduces the risk of false signals.
- Project the height of the triangle at its widest point to estimate potential price targets.
- Look for increasing volume accompanying the breakout as confirmation of the move.
- Be aware that triangles often occur around two-thirds of the way through a larger price move.
Historical Context:
Triangle patterns as a technical analysis tool have been popularized by prominent figures like John Murphy in his book "Technical Analysis of the Financial Markets" and Edwards and Magee in their classic text "Technical Analysis of Stock Trends."
Triangle patterns provide valuable insights into potential future price movements. By understanding the nuances of symmetrical, ascending, and descending triangles, traders can identify promising opportunities and manage risk effectively. Utilizing these patterns in conjunction with other technical indicators and market analysis techniques can enhance trading decisions.
6. Fibonacci Retracement Patterns
Fibonacci Retracement is a powerful technical trading pattern used to identify potential support and resistance levels in a market. It holds a significant place among technical trading patterns due to its ability to pinpoint reversal points, set price targets, and manage risk, all within the context of broader trend analysis. This makes it a valuable tool for professional traders, stock market analysts, financial institutions, independent investors, stock trading educators, and anyone utilizing stock scanners and screeners for day trading or longer-term investment strategies.
This method hinges on the Fibonacci sequence, a mathematical sequence where each number is the sum of the two preceding ones (e.g., 0, 1, 1, 2, 3, 5, 8). While 50% isn't a true Fibonacci number, it's commonly used in this analysis. By connecting significant high and low points on a price chart, traders can project potential support and resistance levels based on specific percentages derived from the Fibonacci sequence: 23.6%, 38.2%, 50%, 61.8%, and 78.6%.
How it Works:
Fibonacci Retracement works on the principle that after a significant price move (either up or down), the price tends to retrace a portion of that move before resuming its original direction. Traders apply the Fibonacci tool by connecting the swing high and swing low of the price move. The tool then automatically calculates and displays the retracement levels.
Examples of Successful Implementation:
- EUR/USD: The EUR/USD currency pair often exhibits retracements to key Fibonacci levels during significant trends, providing opportunities for traders to enter positions aligned with the dominant trend.
- S&P 500 (2020 COVID Crash Recovery): During the recovery phase of the 2020 COVID market crash, the S&P 500 index demonstrated several pauses and consolidations at Fibonacci retracement levels, offering potential entry and exit points for traders.
Actionable Tips for Using Fibonacci Retracement:
- Confirmation is Key: Don't rely solely on Fibonacci levels. Combine them with other technical indicators like price action patterns, volume analysis, or moving averages for confirmation before entering a trade.
- The Golden Ratio: The 61.8% retracement level is often considered the most critical and reliable level for potential reversals.
- Multi-Timeframe Analysis: Applying Fibonacci Retracement to different timeframes can reveal clusters of levels. These clusters often indicate stronger support or resistance zones.
- Price Action Confirmation: Wait for confirmation from price action, such as candlestick patterns or breakouts, at a Fibonacci level before initiating a trade.
- Fibonacci Extensions: In trending markets, consider using Fibonacci extensions to project potential price targets beyond the initial swing high or low.
Pros and Cons:
Pros:
- Objective Reference Points: Fibonacci retracement levels offer objective reference points for potential reversals, removing some of the subjectivity from technical analysis.
- Versatile Applicability: This method can be applied to any market (stocks, forex, commodities) and timeframe (intraday, daily, weekly).
- Trend-Based Entries: Fibonacci retracements help identify potential entry points in the direction of the underlying trend.
- Synergistic with Other Indicators: It works effectively when combined with other technical indicators.
Cons:
- Subjectivity in Application: Selecting the appropriate swing high and low points can be subjective, leading to variations in retracement levels.
- Potential for Confusion: Too many Fibonacci levels on a chart can create confusion and make it difficult to identify the most significant ones.
- Self-Fulfilling Prophecy: In some cases, Fibonacci retracement levels might work due to a self-fulfilling prophecy, as many traders watch these levels.
- Limited Effectiveness in Strong Trends/Volatility: Fibonacci retracements may not be as reliable in strongly trending or highly volatile markets where price moves can extend beyond typical retracement levels.
Why Fibonacci Retracement Deserves Its Place:
Fibonacci Retracement offers a structured approach to identifying potential support and resistance levels. By understanding and applying this technical trading pattern, traders gain valuable insights into potential price reversals, helping them to make more informed decisions about entry points, price targets, and stop-loss orders. Its combination of mathematical objectivity and practical application contributes to its enduring popularity among traders of all levels. It's a tool that, when used in conjunction with other technical analysis methods, can significantly enhance a trader's ability to navigate the complexities of the financial markets.
7. Candlestick Patterns (Engulfing, Doji, Hammer)
Candlestick patterns are a cornerstone of technical trading patterns, offering valuable insights into potential market reversals or continuations. These visual representations of price action, developed centuries ago in Japan, depict the open, high, low, and close prices for a specific time period, forming single or multi-candle formations on a candlestick chart. This makes them a powerful tool for professional traders, stock market analysts, financial institutions, independent investors, stock trading educators, and anyone using stock scanners or screeners for day trading or longer-term strategies. Their ability to reflect the psychology of market participants and provide timing signals for entries and exits secures their spot as a critical technical analysis method.
Each candlestick tells a story about the battle between buyers and sellers during that timeframe. Key patterns like the Engulfing pattern (where one candle completely 'engulfs' the previous one, signaling a potential reversal), the Doji (where the open and close are virtually equal, indicating indecision), and the Hammer/Hanging Man (single candles with small bodies and long lower shadows, suggesting a potential bottom or top) provide early warning signals for potential shifts in momentum.
For instance, the appearance of a Morning Star pattern, a bullish three-candle reversal pattern, near the March 2020 bottom of the COVID crash signaled a potential market turnaround. Conversely, the formation of an Evening Star pattern, a bearish counterpart, at Bitcoin's peak in April 2021 suggested a potential price decline. These examples demonstrate the practical application of candlestick patterns in identifying critical turning points in various markets. Learn more about Candlestick Patterns (Engulfing, Doji, Hammer) specifically the engulfing pattern.
Features and Benefits:
- Visual representation: Easily visualize price action within specific time periods.
- Versatility: Form as single or multi-candle patterns.
- Psychological insight: Reflect market sentiment shifts.
- Timing signals: Provide clear entry and exit points.
- Cross-market applicability: Work across all markets and timeframes.
- Compatibility: Can be combined with Western technical analysis methods.
Pros:
- Early warning signals: Identify potential trend reversals.
- Precise entry/exit: Offer clearly defined risk levels.
- Versatile application: Effective in various markets and timeframes.
- Integrable with other methods: Combine with other indicators for a comprehensive analysis.
Cons:
- False signals: Can occur, especially in choppy markets.
- Confirmation needed: Require validation from subsequent price action or indicators.
- Variable reliability: Performance depends on market conditions and timeframes.
- Learning curve: Requires practice to master interpretation.
Actionable Tips:
- Focus on key levels: Look for patterns at support/resistance levels or trend lines.
- Wait for confirmation: Confirm with the next candle before acting.
- Consider market context: Patterns have different implications depending on the overall trend.
- Use longer timeframes: Longer charts offer more reliable signals.
- Combine with volume analysis: Volume confirms the strength of the pattern.
Candlestick patterns offer a robust method within the broader spectrum of technical trading patterns. While they require careful study and practice to effectively utilize, the potential insights they provide regarding market sentiment and turning points make them invaluable for traders seeking an edge in the markets. Key figures like Steve Nison, who brought candlestick techniques to the West, Munehisa Homma, who developed the original concepts, and Thomas Bulkowski, who statistically analyzed pattern reliability, have cemented the importance of candlestick analysis in modern trading.
8. Elliott Wave Pattern
The Elliott Wave Pattern stands out among technical trading patterns for its attempt to decipher the underlying psychology of market participants and its potential to predict future price movements. This theory, developed by Ralph Nelson Elliott, posits that market prices move in recurring fractal wave patterns driven by the ebb and flow of investor optimism and pessimism. These patterns consist of five impulsive waves in the direction of the main trend, followed by three corrective waves.
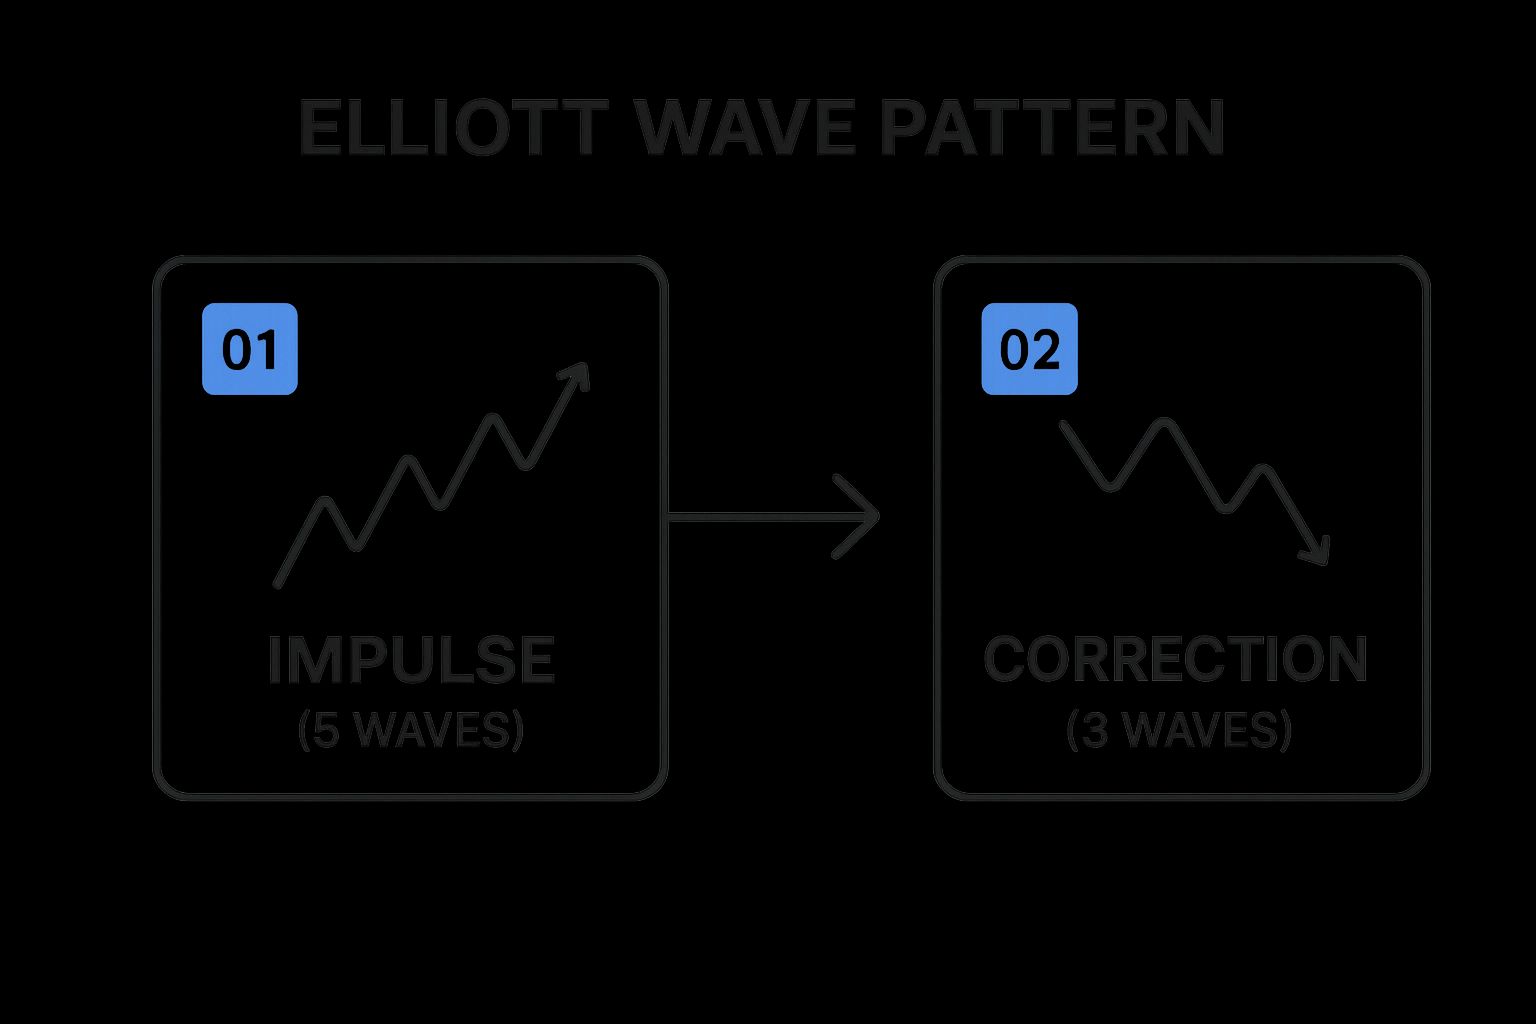
The infographic above visualizes the key components of an Elliott Wave sequence. It highlights the five-wave impulsive structure (labeled 1-5) moving with the dominant trend and the subsequent three-wave corrective structure (labeled A-C) against the trend. Notice how waves 1, 3, and 5 within the impulsive phase are themselves smaller five-wave structures, demonstrating the fractal nature of Elliott Waves.
Understanding the sequence and structure of Elliott Waves is crucial for identifying potential trading opportunities. The five-wave impulse unfolds with waves 1, 3, and 5 pushing the trend forward, interspersed by corrective waves 2 and 4. The subsequent three-wave correction (A-B-C) moves against the main trend, preparing the market for the next impulsive cycle. This fractal nature allows the pattern to repeat on different timeframes, from minutes to decades. Moreover, Fibonacci relationships often exist between the lengths of these waves, adding another layer of predictive power.
The embedded video above offers a more in-depth explanation of the Elliott Wave principle and its application in real-world trading scenarios.
Features of Elliott Wave Pattern:
- Five-wave impulsive structure: Waves 1, 3, and 5 propel the main trend; waves 2 and 4 are corrective.
- Three-wave corrective sequence: Waves A and C move against the main trend; wave B is a corrective wave within the correction.
- Fractal nature: Patterns replicate within larger patterns across various timeframes.
- Fibonacci relationships: Proportional relationships between wave lengths help confirm patterns and project price targets.
Pros:
- Comprehensive market framework: Offers a structured view of market behavior.
- Predictive potential: Aids in forecasting reversals and establishing price targets.
- Broad applicability: Applicable across various markets and timeframes.
- Combined approach: Integrates trend analysis and cycle theory.
Cons:
- Subjectivity: Prone to varied interpretations among analysts.
- Complexity: Requires dedicated study and practice.
- Revisions: Wave counts may require adjustments as price action evolves.
- Real-time challenge: Difficult to master for real-time trading without significant experience.
Examples:
- The bull market from 2009 to 2020 has been interpreted by some analysts as a complete five-wave Elliott structure.
- The rise in gold prices from 2001 to 2011 exhibited characteristics of a five-wave Elliott pattern.
Tips for Applying Elliott Wave Pattern:
- Start with the basics: Master identifying the fundamental five-wave and three-wave structures.
- Multi-timeframe analysis: Confirm wave counts using multiple timeframes.
- Wave personality: Focus on the characteristics of each wave (e.g., Wave 3 is typically the strongest and longest).
- Confirmation: Use other technical indicators in conjunction with Elliott Wave analysis.
- Flexibility: Be prepared to revise wave counts as new price data emerges.
Popularized By:
- Ralph Nelson Elliott (Developer)
- Robert Prechter (Revivalist)
- Glenn Neely (NEoWave creator)
The Elliott Wave Pattern earns its place among technical trading patterns because it provides a unique framework for understanding market cycles and predicting potential turning points. While its complexity and subjectivity require diligent study and practice, its potential to identify high-probability trading setups makes it a valuable tool for experienced traders. Its relevance for professional traders, stock market analysts, financial institutions, and independent investors stems from its potential to provide a deeper understanding of market dynamics beyond simpler technical patterns. While not a foolproof system, understanding Elliott Wave principles can significantly enhance market analysis and trading strategies. It is especially relevant for those interested in forecasting long-term market trends and identifying high-potential trading opportunities.
Technical Pattern Comparison Matrix
| Pattern | Implementation Complexity 🔄 | Resource Requirements ⚡ | Expected Outcomes 📊 | Ideal Use Cases 💡 | Key Advantages ⭐ |
|---|---|---|---|---|---|
| Head and Shoulders Pattern | Moderate; requires pattern formation over weeks/months and volume confirmation | Moderate; needs volume and price action analysis | High reliability reversal signals; measurable targets | Trend reversals after sustained moves | Clear entry/exit points; strong reversal indication |
| Double Top and Double Bottom | Low to moderate; simpler pattern recognition | Low; mostly price levels and volume confirmation | Effective reversal signals with clear stop-loss | Medium-term trend reversals | Easy identification; clear risk management |
| Bull and Bear Flags | Low; quick formation (1-3 weeks), continuation pattern | Low; focus on trend and volume breakouts | High-probability continuation signals | Trading strong trending markets | Fast resolving pattern; clear targets and stops |
| Cup and Handle Pattern | Moderate to high; requires months to form a smooth cup and handle | Moderate; needs volume and price trend analysis | Reliable bullish continuation with price projections | Long-term uptrend continuation on weekly charts | Strong reliability; measurable price targets |
| Triangle Patterns (Symmetrical, Ascending, Descending) | Moderate; pattern can span 1-3 months with multiple breakout possibilities | Moderate; volume and breakout confirmation needed | Visual consolidation indication with breakout targets | Consolidation phases before major trend moves | Works across timeframes; well-defined breakouts |
| Fibonacci Retracement Patterns | Low to moderate; subjective in placing levels | Low; requires high/low identification and overlay | Potential reversal/support/resistance levels | Setting targets or stops within trends | Objective reference points; works in any market/timeframe |
| Candlestick Patterns (Engulfing, Doji, Hammer) | Low; pattern recognition on short timeframes | Low; only price action needed but requires practice | Early reversal or continuation signals | Short-term trading or timing entries/exits | Early signals; precise risk levels |
| Elliott Wave Pattern | High; complex rules with subjective wave counting | High; requires deep analysis and multiple timeframe checks | Comprehensive market structure and forecast | Detailed trend analysis and forecasting | Framework for market cycles; price target prediction |
Level Up Your Trading with ChartsWatcher
From classic Head and Shoulders formations to intricate Elliott Wave patterns, this article has explored a range of powerful technical trading patterns, providing you with a foundational understanding of how these tools can be used to analyze market trends and predict potential price movements. Mastering these technical trading patterns – including Double Top and Double Bottom, Bull and Bear Flags, Cup and Handle, Triangle Patterns, Fibonacci Retracement, and Candlestick patterns – offers invaluable insights into market dynamics, allowing you to make data-driven decisions and enhance your trading strategies.
Remember, the key takeaway is to not just identify these patterns but also understand the underlying market context and confirm them with other indicators for a more comprehensive analysis. For those interested in further enhancing their analytical skills and adopting a structured approach to their trading strategies, exploring resources on code structure best practices can be highly valuable. A well-structured approach, like those found in the article, Master Code Structure Best Practices for Cleaner Code from TreeSnap, can significantly improve the organization and clarity of your trading rules, leading to better decision-making. Applying this structured thinking to your trading pattern recognition can further elevate your trading approach. The consistent application and refinement of these techniques will be instrumental in developing your trading edge and navigating the complexities of the financial markets.
Ready to take your technical analysis to the next level? ChartsWatcher makes identifying and capitalizing on these technical trading patterns easier than ever. Visit ChartsWatcher today and leverage its cutting-edge charting tools, real-time data, and customizable dashboards to unlock the full potential of your trading strategies.
