Master Supply and Demand Zones of Trading Success
The Hidden Power of Supply and Demand Zones
Supply and demand zones are more than just lines on a chart. They represent the core forces behind market movements, offering a glimpse into the collective mindset of buyers and sellers. These zones highlight where significant trading has taken place. Unlike traditional support and resistance levels, which can be subjective, supply and demand zones are grounded in observable price action and volume. This provides a more objective lens for market analysis. Understanding these zones can give you a significant advantage, allowing you to anticipate potential reversals and breakouts with increased accuracy.
Why Institutional Traders Rely on Supply and Demand
Major financial institutions, like banks and hedge funds, use supply and demand zones as a key part of their trading strategies. Their large order flow often creates these zones, leaving behind traces of "smart money" activity. For example, a sudden spike in buying volume followed by a sharp price jump can signal a demand zone. This suggests that large institutions are accumulating positions at that price, potentially setting the stage for further upward movement.
On the other hand, a sudden burst of selling volume leading to a quick price drop could mark a supply zone. This indicates institutional distribution. Grasping this market psychology is vital for anticipating future price movements. Exploring the Psychology of Marketing can further enhance your understanding of the psychological factors influencing zone trading and improve your decision-making.
The Reliability of Supply and Demand Zones
Supply and demand zones are foundational concepts in technical analysis, offering valuable insights into market trends and price action. These zones represent areas on price charts with significant buying or selling activity. For example, in the USD/JPY currency pair, a demand zone around 109 might be identified by the accumulation of buy orders when the price dips into this range. This is often characterized by a cluster of bullish candles, showing upward pressure from the accumulated buy orders at those levels.
Historical data often reveals upward pressure when price action enters such demand zones, as large institutions are likely buying in these areas. This allows traders to potentially follow the smart money and make more informed decisions. By identifying these zones, traders can better predict price reversals and execute strategic trades based on historical market behavior patterns. Learn more about supply and demand zones here.
Practical Application of Supply and Demand Zones
The real strength of supply and demand zones lies in their practical use. Traders use these zones to:
- Identify high-probability trading setups
- Determine optimal entry and exit points
- Manage risk effectively
By combining zone analysis with other technical tools like volume profile and order flow, traders can substantially improve their trading strategies. For instance, a trader might spot a demand zone on a daily chart and then use a shorter timeframe, like a 1-hour chart, to pinpoint a precise entry point with a good risk-reward ratio.
Identifying High-Probability Zones Like a Professional
Identifying genuine supply and demand zones is what separates average traders from the professionals. This skill involves distinguishing real opportunities from market noise by analyzing specific characteristics that mark certain supply and demand zones as worthy of attention. These characteristics include distinct volume signatures, specific candle formations, and timing factors that often signal institutional involvement.
Deciphering the Clues: Volume, Candles, and Timing
For example, a rapid price movement accompanied by a noticeable surge in volume can indicate a strong zone. Additionally, certain candlestick patterns, like engulfing candles or pin bars, can further confirm the presence of a significant supply or demand level. Timing also plays a crucial role. Zones formed near key market inflection points, such as major support or resistance levels, tend to be more reliable.
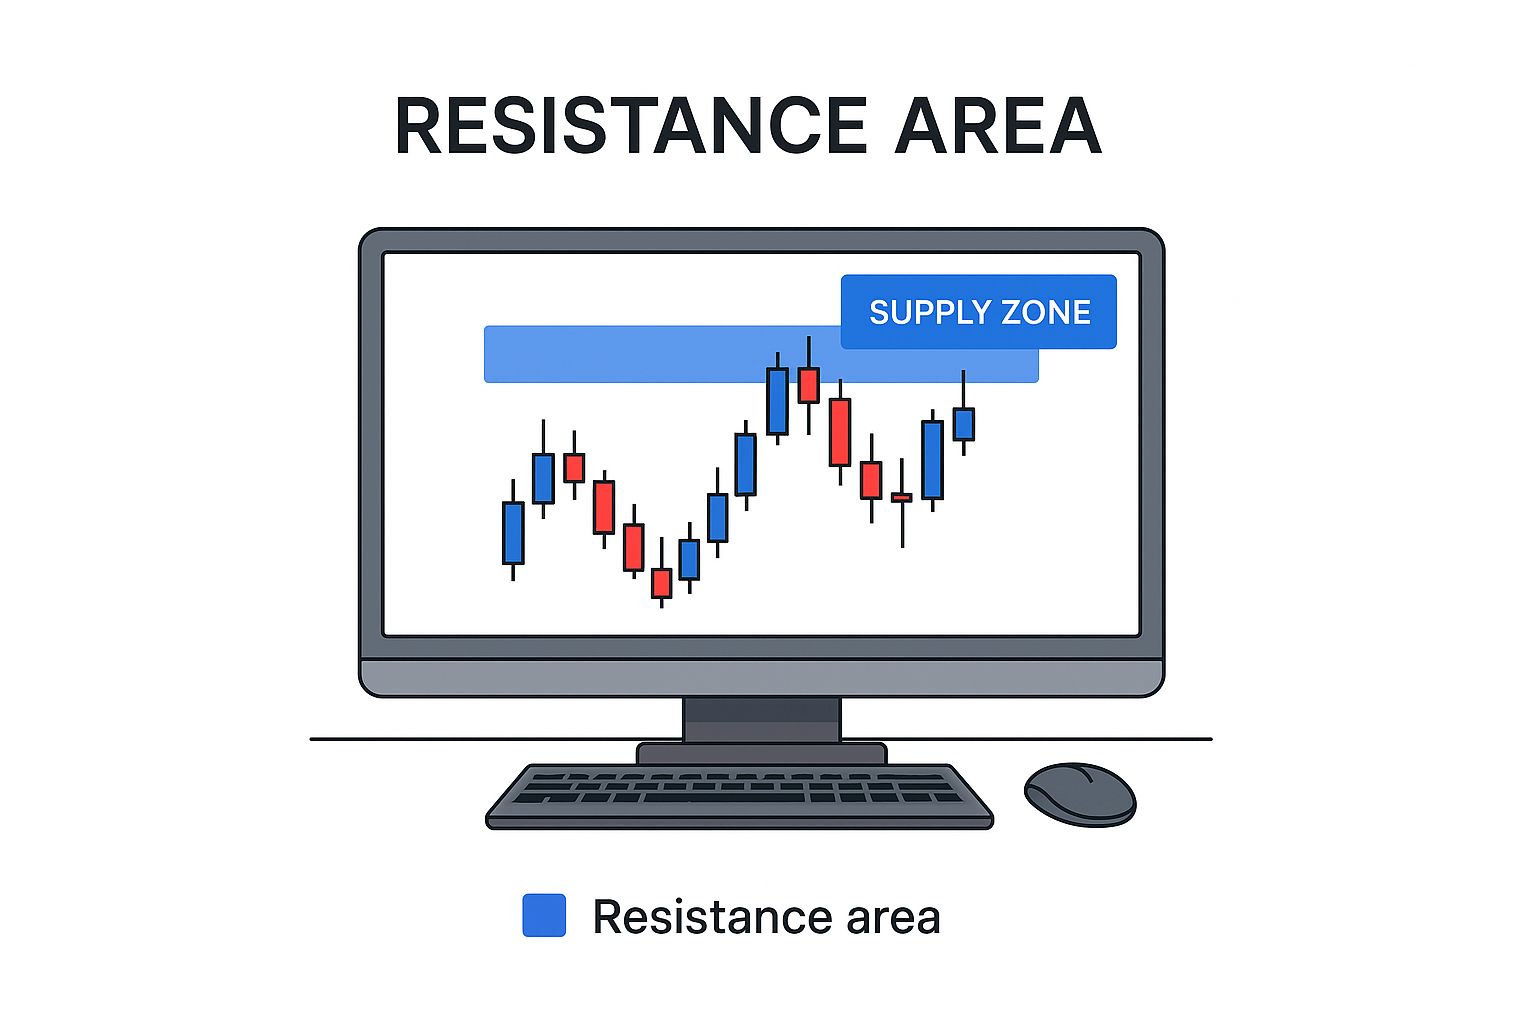
The infographic above depicts a trading desk with a candlestick chart highlighting a resistance area labeled as a 'Supply Zone'. This visualization emphasizes the practical application of identifying supply zones within a real trading environment. The clear resistance area marked as a supply zone indicates a potential selling opportunity for traders, showcasing how these zones can be used to anticipate market movements.
Understanding how quickly price leaves a zone is critical. A swift departure suggests strong conviction from either buyers or sellers, strengthening the zone’s significance. Professionals also carefully evaluate the quality of price rejection. A sharp reversal after price touches a zone demonstrates a powerful reaction, confirming the zone’s validity.
Supply and demand zones are used by traders to analyze historical price reactions and predict future market movements. On platforms like TradingView, traders utilize indicators and strategies based on these zones to pinpoint areas where significant price reactions have occurred. For instance, a supply zone could be where sellers have historically dominated, leading to price decreases.
Conversely, demand zones indicate buyer control, often leading to price increases. By combining historical data with real-time market analysis, traders can refine their strategies to identify high-probability trading opportunities. This helps traders bridge the gap between historical analysis and current market conditions, improving supply and demand charting and trading outcomes. These zones are crucial for traders aiming to capitalize on market fluctuations. Learn more about supply and demand zones here: https://www.tradingview.com/scripts/supplyanddemand/.
Filtering Out the Noise: Eliminating Low-Probability Setups
Not all supply and demand zones are created equal. To avoid costly mistakes, it’s crucial to develop filters that weed out low-probability setups. For example, zones formed with low volume or shallow price reversals often lack the necessary conviction to generate reliable trades. You might be interested in: How to master supply and demand zone trading techniques. Another common pitfall is focusing on zones that are too wide.
Precisely defined zones offer much clearer entry and exit points, leading to better risk management. This allows for more precise targeting of higher-probability trades. To help illustrate the differences, let's examine a comparison table:
To better understand the nuances between effective and less reliable zones, the following table provides a detailed comparison:
Characteristics of Strong vs. Weak Supply/Demand Zones A comparison of features that distinguish high-probability zones from low-probability ones
| Characteristic | Strong Zones | Weak Zones |
|---|---|---|
| Volume | High volume accompanying price movements | Low volume during price changes |
| Price Rejection | Sharp, decisive reversals at the zone | Shallow or weak reversals |
| Zone Width | Clearly defined, narrow zones | Wide, ambiguous zones |
| Candle Formations | Presence of confirming candlestick patterns (engulfing, pin bars) | Lack of clear candlestick confirmation |
| Timing | Formed near key support/resistance or market inflection points | Formed in less significant areas |
The table above clearly highlights the key distinctions between robust and weak supply and demand zones. Strong zones are marked by decisive price action, confirmed by volume and candlestick patterns, while weak zones lack these crucial elements.
Thinking Like a Pro: Developing a Robust Analytical Framework
By understanding the characteristics of strong supply and demand zones, you can develop the analytical framework used by consistently profitable traders. This involves integrating multiple factors, such as volume, price action, and timing, into a cohesive analysis. This holistic approach helps identify high-probability setups while minimizing risk. This framework will empower you to navigate the markets with greater confidence and consistently identify promising trading opportunities. Furthermore, this level of market understanding positions you to adapt to evolving market conditions and adjust your strategies accordingly.
Mastering Supply and Demand Across Multiple Timeframes
Timeframe analysis is crucial for profitable trading using supply and demand zones. These zones behave differently across various time horizons, from the fast-paced 1-minute chart to the long-term monthly view. Understanding these nuances is key to aligning your timeframe with your trading style and risk tolerance.
Timeframe Selection and Trading Style
The timeframe you choose should reflect your trading goals and lifestyle. Day traders, focusing on short-term price fluctuations, might use the 1-minute, 5-minute, or 15-minute charts. Swing traders, holding positions for several days or weeks, often prefer the 4-hour or daily charts. Position traders, with the longest-term horizons, may analyze weekly or monthly charts.
For example, a day trader could identify a demand zone on a 5-minute chart for a quick scalp trade. Meanwhile, a swing trader might use a daily chart to spot a larger demand zone for a multi-day swing trade. Choosing the right timeframe allows traders to filter out market noise and focus on relevant price action. This focus is vital for effective trading decisions.
The Power of Timeframe Confluence
One of the most powerful concepts in supply and demand zone trading is timeframe confluence. This occurs when supply or demand zones appear on multiple timeframes, creating high-probability trades. Imagine a demand zone appearing on the daily, 4-hour, and 1-hour charts.
This confluence suggests significant buyer interest at that price level, increasing the likelihood of an upward movement. These opportunities can offer excellent risk-reward profiles.
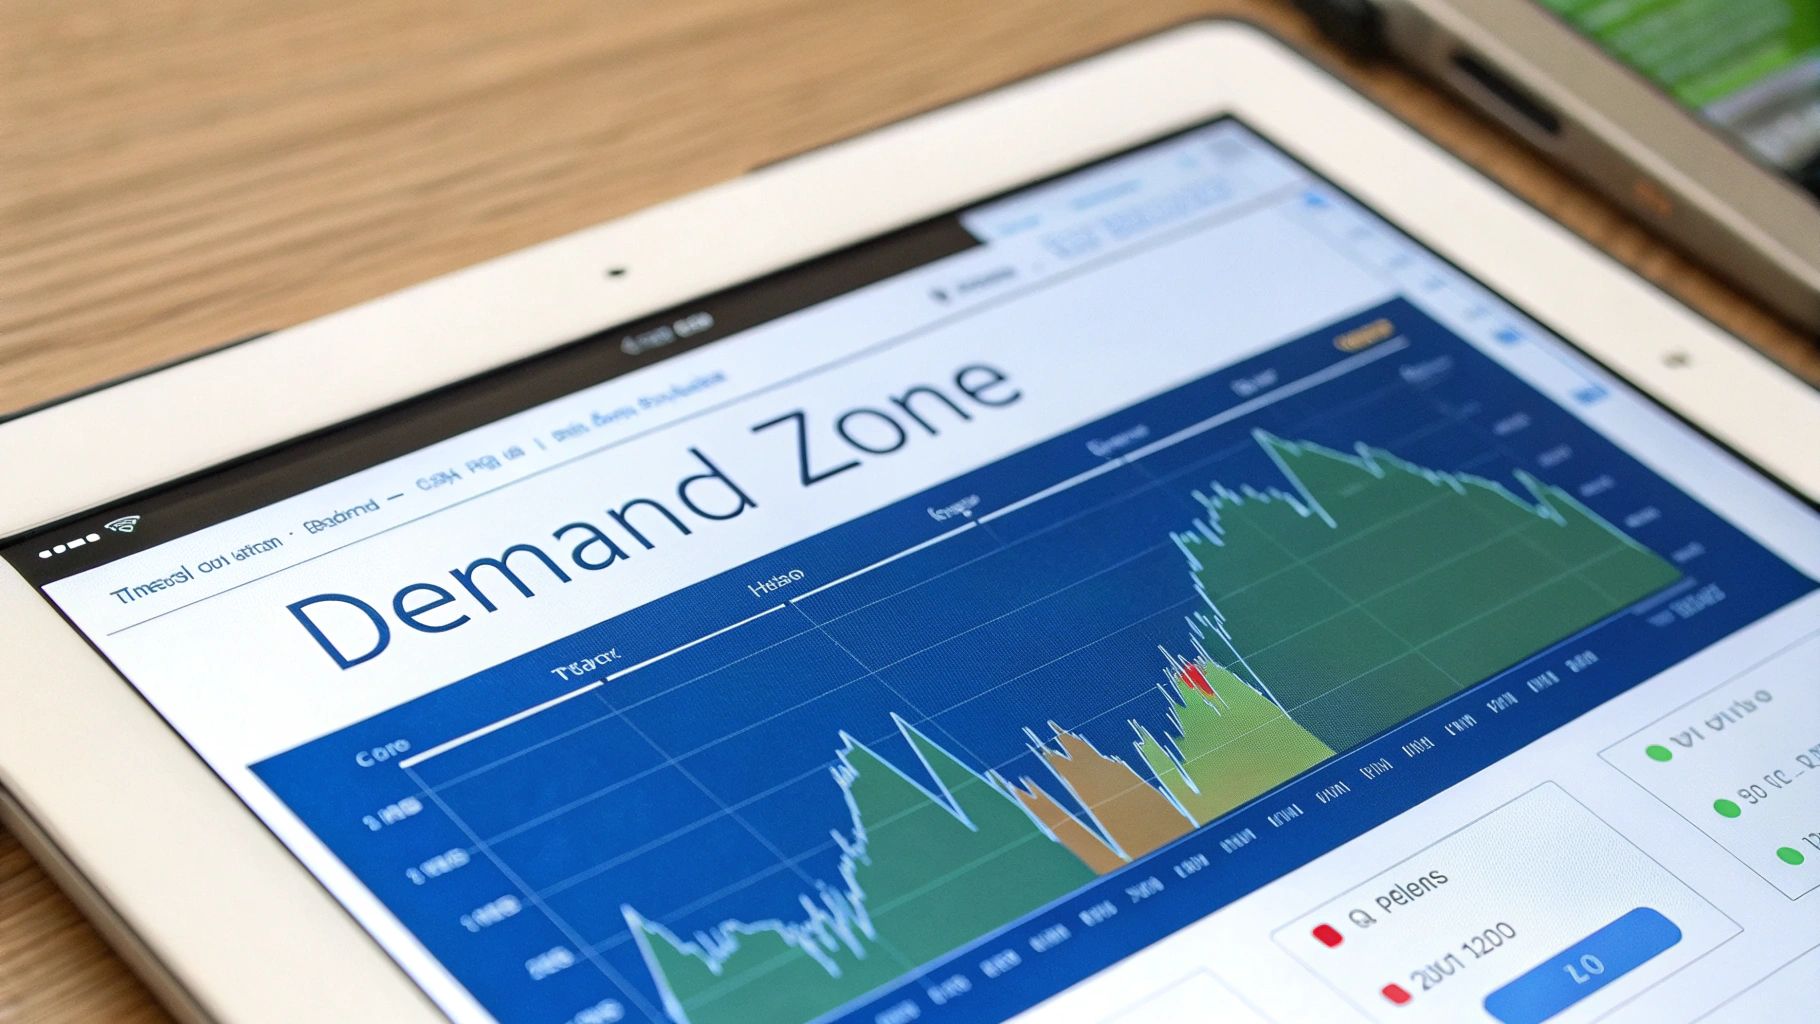
This image shows how zones might align across multiple charts, highlighting confluence. Overlapping zones represent a significant price level, making it an area of interest for traders.
Practical Timeframe Guidelines
Here’s how different traders might approach timeframe selection:
-
Day Traders: Focus on short-term charts (1-minute, 5-minute, 15-minute). Look for quick entries and exits within the same day. Manage risk tightly given the increased volatility.
-
Swing Traders: Use medium-term charts (4-hour, daily). Aim for trades lasting several days to weeks. Balance risk management with allowing trades room to develop.
-
Position Traders: Analyze long-term charts (weekly, monthly). Hold positions for weeks, months, or even years. Focus on larger market trends and macroeconomic factors.
By analyzing supply and demand zones across multiple timeframes, traders gain a comprehensive market view. This helps identify high-probability trades, improve risk management, and increase trading success. Aligning your timeframe with your objectives and lifestyle is crucial for long-term success. Mastering this allows you to tailor your trading approach and maximize your profit potential.
Real-World Supply and Demand Trading Case Studies
Theory is essential for building a foundation, but practical application is key. Seeing supply and demand zones in action is what truly solidifies understanding and can lead to profitable trading. This section dives into real-world examples across various markets, demonstrating how these zones can create trading opportunities. We'll analyze successful trades, detailing entry triggers, stop placement, and position management strategies. We'll also examine instances where zones failed, offering valuable lessons on market context and confirmation signals.
Forex Case Study: EUR/USD
Let's examine a trade setup in the EUR/USD forex market. A strong demand zone formed around 1.0850 after a sharp decline. Price consolidated above this zone, hinting at renewed buyer interest. A bullish engulfing candle then appeared, signaling a potential reversal.
- Entry Trigger: The breakout above the high of the engulfing candle.
- Stop Placement: A few pips below the low of the demand zone (1.0845).
- Position Management: Scaling out of the position as the price reached previous resistance levels.
This trade resulted in a profitable outcome due to the combination of a well-defined demand zone, a confirming candlestick pattern, and proper risk management.
Commodities Case Study: Gold
The gold market provides another interesting example. A clear supply zone developed near $1,950 after a strong rally. Noticeable bearish volume accompanied the price rejection at this level. A bearish engulfing candle indicated further downside potential.
- Entry Trigger: A break below the low of the bearish engulfing candle.
- Stop Placement: A few dollars above the high of the supply zone ($1,955).
- Position Management: Trailing the stop-loss as the price moved lower, locking in profits.
This trade shows how supply zones can be used for short-selling opportunities when combined with appropriate confirmation and risk management.
One compelling historical example of supply and demand zones occurred in the platinum market between 2013 and 2018. Significant price swings resulted from fluctuating industrial demand and mining output. A 2014 strike in South Africa, a major platinum producer, caused a supply shortage that drove prices up sharply. Analyzing the impact of these supply disruptions on historical prices can help traders anticipate similar situations and identify high-probability zones. More detailed information can be found here.
Cryptocurrencies Case Study: Bitcoin
The volatile cryptocurrency market often presents clear supply and demand zones. After a substantial drop, Bitcoin formed a demand zone around $25,000. Increased buying volume and a series of higher lows confirmed the zone's validity.
- Entry Trigger: A break above the recent swing high, confirming the reversal.
- Stop Placement: Slightly below the low of the demand zone.
- Position Management: Adjusting the stop-loss to the breakeven point after a certain percentage gain.
This example highlights the importance of volume analysis and confirmation signals in cryptocurrency trading using supply and demand zones.
Equities Case Study: Apple
Finally, let’s consider Apple stock. A supply zone emerged near $180 after a period of upward momentum. Lower highs and decreased volume signaled weakening buying pressure.
- Entry Trigger: A break below the low of the recent swing low within the supply zone.
- Stop Placement: A few dollars above the high of the supply zone.
- Position Management: Partially closing the position at predefined profit targets, and letting the remainder run with a trailing stop-loss.
Learning From Failures: When Zones Don’t Work
It's important to remember that not every trade based on supply and demand zones will be successful. Analyzing failed setups is just as crucial as studying winning ones. A zone might fail if market context changes significantly, such as a major news event or a shift in overall sentiment. Learning to recognize these changes is vital for minimizing losses and improving overall trading performance.

Building Your Complete Supply and Demand Trading System
Identifying supply and demand zones is just the first step. This section dives into building a full trading system around these zones, incorporating a structured approach to market scanning, order execution, and managing your positions. We'll also explore how seasoned traders use tools like market structure, order flow, and volume patterns to refine their zone analysis and improve their trading results.
Entry Triggers and Risk-Reward Optimization
Finding the optimal entry point is essential for a good risk-reward ratio. This means identifying specific price action signals that confirm a potential reversal or breakout within a supply or demand zone.
For example, a bullish engulfing candle at the bottom of a demand zone could signal a long entry opportunity. On the other hand, a bearish engulfing candle at the top of a supply zone could be a good short entry signal. Precise entry triggers allow for more favorable risk-reward scenarios, maximizing potential gains while minimizing potential losses.
Stop-Loss Placement and Capital Protection
Protecting your capital is the most important aspect of trading. Proper stop-loss placement is crucial for managing risk and preventing significant losses while allowing your trades room to develop. Stop-losses should be placed just outside the zone to account for market fluctuations or false breakouts.
When entering a long position within a demand zone, your stop-loss would sit just below the zone's lower boundary. This limits your downside if the price moves against your position and breaks through the demand zone, signaling a potential failure of the anticipated price reversal.
Profit-Taking Strategies and Return Maximization
A well-defined profit-taking strategy is just as important as entry and stop-loss strategies. It requires balancing profit maximization with the risk of missing out on potential further price movement in your favor.
Several methods can be used, like taking partial profits at pre-determined targets, using trailing stop-losses, or a combination of both. You might find How to master trading supply and demand zones helpful for further reading. These strategies help ensure consistent profits while still allowing for the possibility of bigger gains in favorable market conditions.
Adapting to Different Market Conditions
Markets are dynamic and constantly changing. Therefore, your trading system needs to adapt to these various conditions. Different market phases, such as trending or ranging markets, may require adjustments to your entry, stop-loss, and profit-taking approaches.
For example, in a strong trending market, you might widen your stop-loss to account for increased volatility. In a ranging market, you might tighten your profit targets and take partial profits more frequently.
Practical Workflow and System Structure
The following table offers a framework for integrating supply and demand zone analysis into a practical trading system.
To get a better picture of a comprehensive system, take a look at the following table:
Supply and Demand Zone Trading Strategy Components A comprehensive breakdown of key elements required for an effective trading strategy based on supply and demand zones
| Component | Implementation | Key Considerations |
|---|---|---|
| Market Scanning | Use ChartsWatcher to identify potential supply and demand zones across multiple timeframes. Focus on zones near key support/resistance levels. | Prioritize high-volume zones and confluence areas. |
| Entry Trigger | Look for confirming candlestick patterns, such as engulfing candles or pin bars, within the identified zones. | Consider aggressive, conservative, or breakout entry strategies depending on your risk tolerance. |
| Stop-Loss | Place stop-loss orders just outside the zone boundaries, accounting for market volatility. | Adjust stop-loss placement based on market conditions and timeframe. |
| Profit-Taking | Employ a combination of predefined profit targets and trailing stop-losses. | Consider partial profit-taking at significant levels, such as previous swing highs or lows. |
| Position Management | Adjust position size based on the risk-reward ratio of the setup. Monitor trades closely and adjust stops or targets as needed. | Maintain proper risk management throughout the trade lifecycle. |
This table outlines a structured approach to using supply and demand zones in your trading strategy. By following a structured workflow like this, traders can maintain discipline and consistently apply their strategy, which can improve long-term trading success. This organized process helps ensure you apply your strategy consistently across various market situations, increasing your chances of success.
Conquering the Psychology of Zone Trading
Even the most technically sound trading strategies can be undermined by flawed psychology. This section addresses the mental hurdles specific to supply and demand zone trading, from the fear of missing out (FOMO) on perfect setups to the anxiety of weathering drawdowns.
The Fear of Missing Out and Impulsive Trading
One of the biggest psychological challenges in zone trading is the fear of missing out (FOMO). Seeing a perfectly formed zone can trigger an urge to jump in prematurely, even without proper confirmation. This impulsive behavior often leads to losses. For those building their trading systems, a broader market understanding can be valuable. This startup growth strategy might offer a fresh perspective.
To combat FOMO, develop the discipline to wait for A+ setups. This involves looking for the confluence of multiple factors.
- Strong price rejection at the zone boundaries
- High volume accompanying the price movement
- Confirming candlestick patterns
By waiting for these confirmations, you increase the probability of a successful trade. You also significantly reduce the risk of emotional decision-making.
Managing Emotions During Retests
Supply and demand zones are often retested, leading to volatile price swings. These retests can be emotionally challenging, triggering doubt and fear. It's crucial to have a clear plan for managing these situations. Predetermined stop-loss orders are essential. They protect your capital and prevent emotional reactions. Visualizing potential scenarios beforehand can also help you stay calm and execute your plan effectively.
Maintaining Confidence After Losses
Experiencing losses is inevitable in trading. Consecutive losses can be particularly damaging to confidence. It’s important to focus on the process, not just the outcome. Review your trades objectively, identify any mistakes, and adjust your strategy accordingly. Remember that even professional traders experience losing streaks. Learning from these experiences and maintaining a long-term perspective is key.
The Trap of Abandoning Your Strategy
Another common psychological pitfall is abandoning a proven strategy after a series of losses, or just before a potential winning streak. This often happens when traders become frustrated or doubt their system. This can be a costly mistake.
Trusting your strategy requires discipline and patience. Backtesting your strategy can reinforce its effectiveness. This can help you maintain confidence during challenging periods. Consistent profitability comes from adhering to a well-defined plan, even during temporary setbacks. By mastering the psychology of zone trading, you'll improve your trading performance. You will also develop a more resilient and disciplined mindset essential for long-term market success.
Ready to elevate your trading? Discover how ChartsWatcher can help you identify high-probability supply and demand zones and transform your trading strategy. Explore ChartsWatcher today.
