Master Moving Average Crossover Trading Strategies
The Science Behind Moving Average Crossover Success

Moving average crossovers are more than just a technical indicator. They offer traders valuable insights into the collective mindset of the market, visually representing shifts in sentiment. This allows traders to potentially anticipate changes in trends before they become widely recognized.
For instance, a bullish crossover happens when a shorter-term moving average rises above a longer-term moving average. This often suggests increased buying pressure and the potential for price appreciation, making it a potentially helpful signal for traders considering long positions.
Understanding the Basics of Moving Averages
The core principle of moving average crossovers involves comparing two distinct moving averages. These averages are calculated over different periods, typically a shorter period (such as 50 days) and a longer period (such as 200 days).
The moving average crossover strategy helps identify potential trend changes. It does this by tracking crossovers between two moving averages of varying lengths. A common example uses a 50-day Simple Moving Average (SMA) and a 200-day SMA. A bullish signal occurs when the shorter-term average crosses above the longer-term average, hinting at a potential uptrend. Conversely, a bearish signal occurs when the shorter-term average falls below the longer-term average, suggesting a possible downtrend. This strategy is especially popular with traders focused on major markets like the S&P 500. Historical data suggests that such strategies can be helpful in identifying trends, although they may not consistently predict market peaks or troughs. Using other types of moving averages, like Exponential Moving Averages (EMAs), can refine the strategy further, adding more weight to recent price action. Learn more about moving average crossover strategies.
Psychological Impact of Crossovers
Understanding the psychological impact of crossovers is essential. You might even find value in exploring concepts like consumer behavior marketing to deepen your understanding. Crossovers serve as strong visual cues for many traders, influencing their actions based on how they interpret the signal. This can result in increased buying or selling pressure, which may amplify the emerging trend.
It's important to remember that crossovers are not infallible. False signals can, and do, occur, particularly in volatile or sideways markets. Therefore, it's wise to combine crossover analysis with other technical indicators and market analysis techniques. For more in-depth information, consider this resource: How to master the moving average crossover strategy.
Applying Crossovers in Different Markets
The success of moving average crossovers depends on the specific market. Each market has its own characteristics, volatility levels, and trading patterns. A strategy that works well in one market may not be as successful in another.
Traders should adapt their crossover strategies based on the specific market they are trading. This involves carefully evaluating factors such as market volatility, trading volume, and the overall strength of the current trend.
Choosing the Perfect Moving Average Combination
Not all moving averages are created equal. Selecting the right combination can significantly impact your trading results. This section explores the strengths and weaknesses of different moving average types, offering insights gleaned from successful traders.
Simple vs. Exponential Moving Averages
Simple Moving Averages (SMAs) smooth price fluctuations by averaging closing prices over a specific period. This provides a stable view of the trend, especially helpful in volatile markets. However, SMAs can lag behind current price action, potentially delaying signals for entries and exits.
Exponential Moving Averages (EMAs) prioritize recent prices, making them more responsive to market changes. EMAs excel at capturing rapid momentum shifts that SMAs might miss. However, this sensitivity can also lead to false signals in choppy markets.
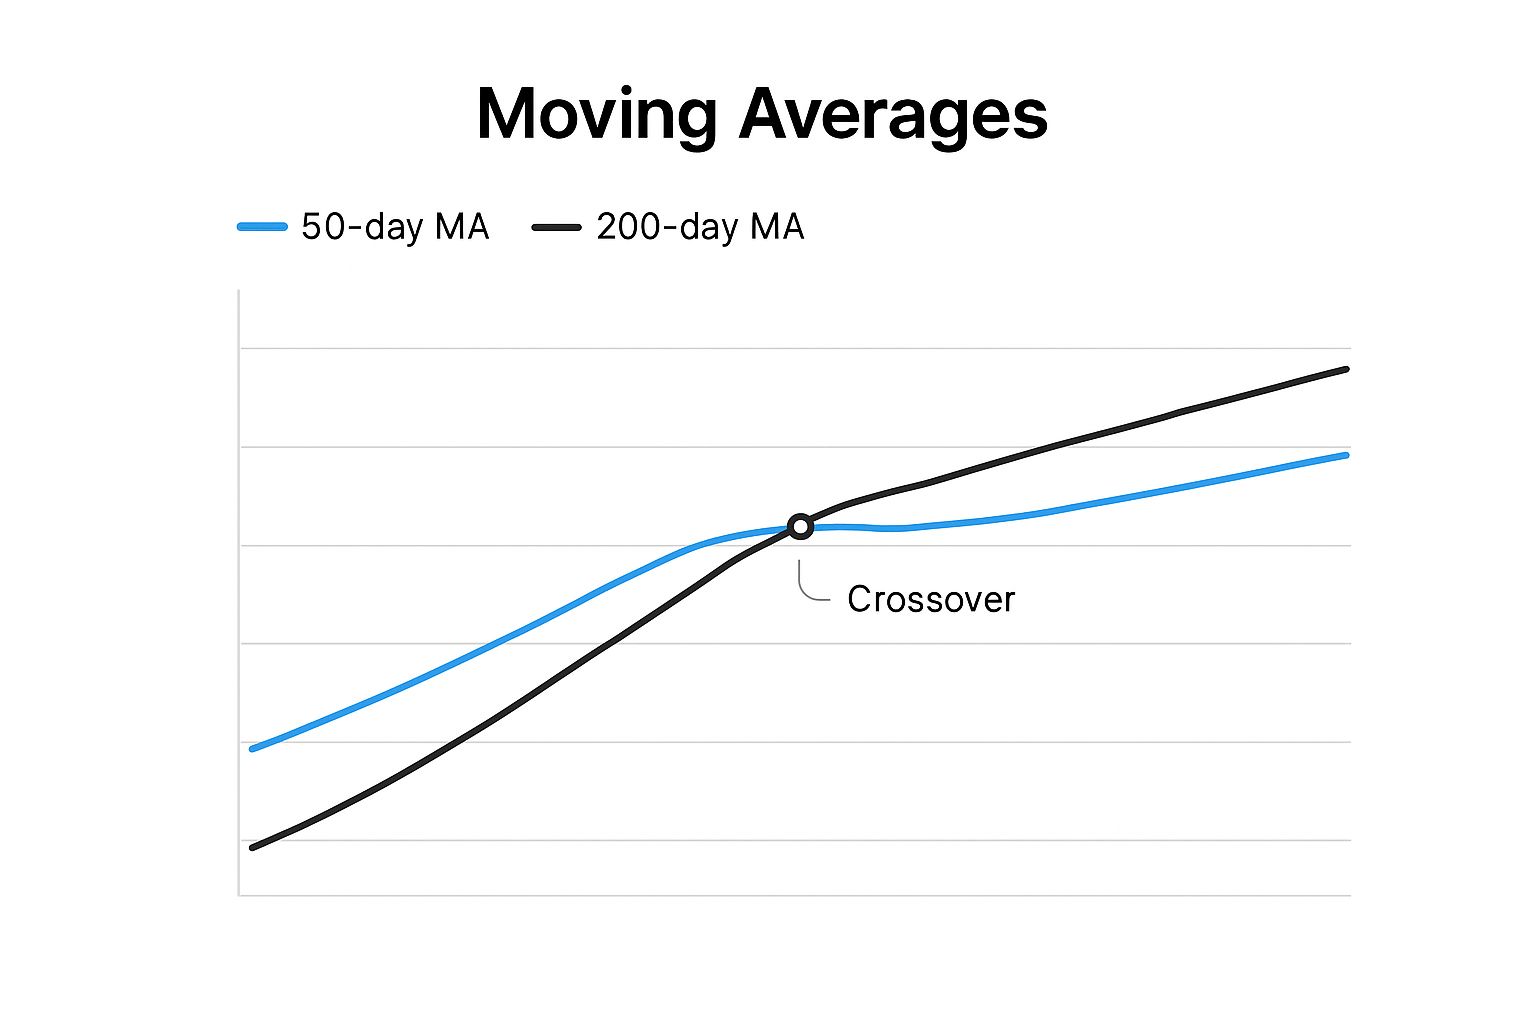
The infographic above visualizes a 50-day and 200-day moving average crossover. The crossover provides a clear visual signal, potentially indicating a momentum shift. However, it's important to consider other factors and confirm the signal with additional indicators before making trading decisions.
Popular Moving Average Combinations
Different trading styles and market conditions require different moving average pairings. Here are some popular combinations:
-
50-day and 200-day SMA: This classic combination identifies long-term trend changes. The 200-day SMA often acts as a strong support or resistance level.
-
10-day and 20-day EMA: Favored by day traders for its responsiveness to short-term price fluctuations. This combination generates frequent signals but necessitates careful risk management.
-
20-day and 50-day EMA: A balanced approach suitable for swing trading, offering a compromise between responsiveness and stability.
To further clarify the nuances of each moving average type and their application in crossover strategies, let's examine the following table:
Comparison of Moving Average Types for Crossover Strategies This table compares the key characteristics of different moving average types used in crossover strategies.
| Moving Average Type | Calculation Method | Sensitivity to Price Changes | Lag Factor | Best Used For | Common Combinations |
|---|---|---|---|---|---|
| Simple Moving Average (SMA) | Average of closing prices over a specified period | Lower | Higher | Long-term trend identification | 50-day & 200-day |
| Exponential Moving Average (EMA) | Weighted average favoring recent prices | Higher | Lower | Short-term trend identification & momentum trading | 10-day & 20-day, 20-day & 50-day |
As the table highlights, SMAs, with their slower response, are better suited for long-term trend following, while EMAs, being more sensitive, are preferable for shorter-term strategies. The combination used depends heavily on individual trading styles and preferences.
Optimizing Your Moving Average Strategy
The effectiveness of moving average crossovers can be enhanced through several techniques:
-
Multiple Timeframe Analysis: Combining signals from different timeframes can improve reliability. Confirming a daily chart crossover with a weekly one can bolster confidence.
-
Volume Confirmation: Increased trading volume during a crossover strengthens the signal, indicating conviction behind the price movement.
-
Other Indicators: Incorporating other technical indicators, like the Relative Strength Index (RSI) or Moving Average Convergence Divergence (MACD), can provide additional confirmation and filter out false signals. You can find these indicators on platforms like TradingView.
Finding the optimal moving average combination requires experimentation and adaptation to specific market conditions and personal trading styles. ChartsWatcher can help you backtest and optimize your strategies. Its customizable dashboards allow you to monitor multiple moving averages and receive real-time alerts on crossover events. This empowers you to react quickly to market changes and refine your approach based on real-world performance.
Selecting Time Periods That Actually Generate Profits
The success of a moving average crossover strategy depends heavily on choosing the correct periods for your moving averages. There's no universal solution; what works for one trader may not be suitable for another. Successful traders understand this and adjust their methods based on several factors.
The Impact of Time Period Selection
The periods you select directly affect the frequency and precision of trading signals. Shorter periods, such as a 10-day moving average, react swiftly to price fluctuations, generating more frequent signals.
However, this quick response can also lead to more false signals, particularly in volatile markets. Longer periods, like a 200-day moving average, provide greater stability and filter out market noise. The trade-off is that they may lag behind significant price shifts.
Finding the right balance between responsiveness and reliability is essential. It's about identifying the ideal combination that matches your trading style, risk tolerance, and the specific market you're trading in.
Understanding Market Dynamics
Different markets have distinct characteristics, and these traits significantly impact the effectiveness of various moving average periods. For instance, the fast-paced cryptocurrency market often favors shorter-term moving averages because of its high volatility. A 5/10-day EMA crossover might be a helpful tool for capturing short-term price swings in Bitcoin, while this short-term approach could be less effective in the comparatively stable forex markets.
Furthermore, the same market can behave differently under various conditions. During periods of high volatility, longer-term moving averages can offer more stable signals, helping traders minimize losses. Conversely, during trending markets, shorter-term moving averages might be better suited for capturing momentum.
Analyzing Proven Combinations
Certain moving average period combinations have historically been more effective than others. Frequently used periods include 50-day, 100-day, and 200-day moving averages, which are considered reliable trend indicators. For example, in the S&P 500, the 200-day SMA is often used as a benchmark for long-term trends due to its smoothing of short-term fluctuations.
This makes it a popular choice for traders aiming to capture broader market trends. Combining different moving average types, such as an SMA with an EMA, can provide more subtle insights into market dynamics. The effectiveness of these combinations can vary based on market conditions and the specific assets being analyzed. Explore this topic further.
While these combinations are a good starting point, it's crucial to remember that their effectiveness can fluctuate. This highlights the importance of testing and adjusting strategies based on your personal experience and the specific market you're trading.
Testing and Optimization
The key to discovering the best moving average periods lies in thorough testing. Platforms like ChartsWatcher provide robust backtesting features, allowing you to simulate different combinations on historical data. This lets you assess which periods yield the highest win rates and the best risk-adjusted returns for your chosen assets.
By systematically testing different combinations and modifying your strategy based on the results, you can determine the optimal moving average periods for consistent profits and your trading style. This data-driven method helps you find your advantage in the market and refine your approach over time. Combining this approach with effective risk management is vital for long-term trading success.
Market-Specific Moving Average Crossover Tactics
Applying the same moving average crossover strategy to every market is a common trading pitfall, often leading to unpredictable results. Savvy traders recognize that each market possesses unique characteristics, demanding a customized approach. Let's delve into adapting moving average crossovers for various market environments.
Cryptocurrency Markets: Navigating Volatility
Cryptocurrency markets are notorious for their volatility and swift price fluctuations. Traders often prefer Exponential Moving Averages (EMAs) because of their responsiveness to recent price changes.
A combination of a 10-day and 20-day EMA, for instance, can highlight short-term momentum shifts in Bitcoin or other cryptocurrencies. These faster moving averages enable traders to react quickly, potentially maximizing profits. However, careful risk management is essential in this dynamic environment.
Stock Markets: Focusing on Long-Term Trends
Stock markets generally exhibit more stability than the frenetic cryptocurrency world. This makes Simple Moving Averages (SMAs) a popular choice among stock investors.
Longer-term SMAs, like the 50-day and 200-day SMA, filter out short-term noise and identify established trends. These longer periods offer more stable signals, lessening the risk of whipsaw losses from short-term price swings. The 200-day SMA is often seen as a key indicator of long-term market sentiment for stocks.
Forex Markets: Strategies for Continuous Trading
The 24/7 nature of the forex market generates a constant flow of price data. Relying solely on basic crossovers can lead to a multitude of false signals. To address this, forex professionals frequently use triple moving average systems.
This strategy incorporates three moving averages of different lengths – for example, a 10-day, 20-day, and 50-day EMA combination. This layered approach helps confirm signals and minimize the risk of acting on fleeting price changes.
Commodity Markets: Considering Seasonal Factors
Commodity markets are often susceptible to seasonal influences like weather patterns or harvest cycles. This necessitates adjusting moving average parameters accordingly.
A commodity trader might use shorter-term moving averages during periods of heightened seasonal volatility and longer-term averages during more stable periods. Understanding fundamental factors like supply and demand is also vital for interpreting crossover signals effectively.
Adapting to Market Regime Changes
Market conditions can shift between trending and ranging. Adapting moving average crossover strategies to these regime changes is crucial.
Shorter-term moving averages can effectively capture momentum during trending markets. However, in ranging markets, these same short-term averages can lead to frequent whipsaw losses.
Analyzing market behavior and adjusting moving average periods allows traders to optimize their strategies for different market environments. This adaptability can improve the effectiveness of moving average crossovers and enhance overall trading results.
Backtesting historical data provides valuable insights into which combinations perform best under different market conditions. Tools like ChartsWatcher can be helpful for this analysis. Its backtesting feature allows traders to simulate various strategies and evaluate their historical performance, aiding in the selection of appropriate periods and combinations for their specific market and asset.
Advanced Moving Average Crossover Techniques
Moving beyond the basics of moving average crossovers opens a world of sophisticated techniques used by professional traders. These advanced methods help filter out false signals, allowing for more accurate identification of true trend changes and potentially more profitable trades.
Filtering Out False Signals
One common challenge with basic moving average crossovers is the prevalence of false signals, especially in choppy or ranging markets. These misleading signals can lead to premature entries and exits, resulting in losses. Here are a few ways to mitigate this risk:
-
Volume-Weighted Crossover Confirmation: Incorporating volume analysis adds a layer of confirmation. A crossover coupled with increased trading volume reinforces the signal. Conversely, low volume during a crossover may indicate a lack of true market interest.
-
Adaptive Moving Average Systems: These systems self-adjust to changing market volatility. During volatile periods, the moving average lengthens, reducing the impact of short-term price swings. In calmer markets, the periods shorten to capture momentum shifts.
Enhancing Entry and Exit Strategies
Advanced traders often combine moving average crossovers with other indicators to refine entries and exits.
-
Momentum Oscillators: Combining crossovers with momentum oscillators like the Relative Strength Index (RSI) Relative Strength Index or the Stochastic Oscillator Stochastic Oscillator can help identify optimal entry and exit points. A bullish crossover with an oversold RSI reading might signal a buying opportunity.
-
Multi-Timeframe Confirmation: Analyzing crossovers on multiple timeframes can increase signal reliability. A bullish crossover on a daily chart confirmed by a similar crossover on a weekly chart provides stronger evidence of a sustained uptrend.
Backtesting and Optimization
Traders can further refine strategies with tools like TradingView. By backtesting historical data, traders can pinpoint moving average combinations that have performed well. The "Best MA Pair Finder" indicator, for example, identifies the most effective moving average pairs for crossover strategies by evaluating various combinations and their profit factors.
Let's look at some hypothetical performance data for different combinations.
Performance Metrics of Various Moving Average Crossover Combinations
Statistical performance data for popular moving average crossover combinations across different market conditions.
| MA Combination | Win Rate | Profit Factor | Max Drawdown | Average Holding Period | Best Market Condition |
|---|---|---|---|---|---|
| 5-day/20-day SMA | 55% | 1.2 | 8% | 3 days | Trending |
| 10-day/50-day EMA | 60% | 1.5 | 12% | 7 days | Trending |
| 20-day/100-day SMA | 45% | 1.1 | 5% | 15 days | Sideways |
| 50-day/200-day EMA | 50% | 1.8 | 15% | 30 days | Trending |
This table shows how different MA combinations can yield varying results. While the 50/200 EMA shows a higher profit factor, it also carries a larger maximum drawdown. Shorter-term combinations like the 5/20 SMA have faster holding periods, suitable for short-term traders. Longer-term combinations like the 20/100 SMA perform relatively better in sideways markets. Remember, past performance is not indicative of future results.
You can find more about moving average optimization here. However, past performance doesn't guarantee future returns, and sound risk management is crucial.
Adapting to Different Market Phases
Successful traders adapt their crossover strategies to evolving market conditions. During trending markets, shorter-term moving averages might be preferred to capture momentum. In ranging markets, longer-term moving averages or indicators like the Average Directional Index (ADX) Average Directional Index can be more effective.
By combining these advanced techniques with platforms like ChartsWatcher, traders can elevate their moving average crossover strategies beyond basic signals for potentially more consistent market profits. Features like customizable dashboards and real-time alerts allow for efficient monitoring of crossovers and other indicators.
Avoiding the Traps That Derail Moving Average Traders

Even seasoned traders sometimes stumble when using moving average crossover strategies. This section explores common pitfalls and offers practical advice to help you protect your capital and improve your trading performance.
The Danger of Ranging Markets
One of the most frequent mistakes is applying moving average crossovers in ranging markets without considering the specific market context. These sideways markets, where prices fluctuate within a defined band, often generate false signals. This can lead to whipsaw losses, where small, frequent losses add up. Imagine a short-term moving average repeatedly crossing above and below a longer-term one within a narrow price range. Each crossover could trigger a trade, but the absence of a sustained trend results in accumulating losses.
Before using a moving average crossover strategy, assess the market conditions. Tools like the Average Directional Index (ADX) can help you determine if the market is trending or ranging. A low ADX value typically indicates a ranging market, suggesting caution against relying solely on crossovers.
Psychological Pitfalls
Trading psychology plays a vital role in any strategy’s success. A common trap is abandoning a tested system during periods of drawdown. A string of losses can shake a trader’s confidence, leading them to deviate from their plan.
Another psychological hurdle is the fear of missing out (FOMO). This can cause impulsive entries, chasing crossovers in volatile markets without confirmation, resulting in losses. Discipline and adherence to predefined trading rules are key to avoiding emotional decisions. Continuously improving your trading system might also involve code refactoring to refine your automated strategies.
Risk Management Frameworks
Effective risk management is paramount for any trading strategy. For moving average crossovers, these techniques are especially important:
-
Position Sizing: Carefully determine the appropriate position size for each trade based on your risk tolerance and account capital. This prevents overexposure, mitigating potential losses.
-
Stop-Loss Placement: Stop-loss orders are essential to limit losses. A common practice involves placing stops below support levels for long positions and above resistance levels for short positions.
-
Managing Trades Through Volatility: Crossover periods can be volatile. Have a plan for managing open trades during such times, which might include adjusting stop-loss orders or profit targets.
Analyzing Trade Performance
Regular performance review is vital for ongoing improvement. Track key metrics like win rate, average profit/loss, and maximum drawdown to identify areas for refinement. For instance, your analysis might show that a certain moving average combination works better in specific market conditions, or that adjusting your stop-loss placement improves profitability.
By understanding and addressing these common issues, traders can use moving average crossovers more effectively. This involves recognizing the strategy's limitations, maintaining discipline, implementing sound risk management, and continually analyzing and adapting your approach. These steps contribute to a more disciplined and potentially more profitable trading experience.
Building Your Personal Moving Average Crossover System
Turning your understanding of moving average crossovers into a personalized trading system is key for consistent profitability. This means creating a detailed trading plan that fits your goals, risk tolerance, and preferred trading style.
Defining Your Trading Objectives and Style
Before getting into specifics, clearly define your trading objectives. Are you a day trader looking for quick profits from short-term price changes? Or are you a swing trader aiming to capture intermediate-term swings? Maybe you’re a long-term investor focused on broader market trends. Your trading style will determine the type of moving average crossover system you build. For instance, a day trader might use shorter-period Exponential Moving Averages (EMAs), while a long-term investor might choose longer-period Simple Moving Averages (SMAs).
Selecting Your Moving Average Combination
Based on your style and objectives, choose the right moving average types and periods. A day trader may go with a 10-day and 20-day EMA crossover, wanting fast signals. A long-term investor might find a 50-day and 200-day SMA crossover more suitable. Learn more from this article on How to Backtest Your Trading Strategy.
Establishing Entry and Exit Criteria
Your plan should have clear entry and exit rules based on crossover signals. A bullish crossover could trigger a buy order, while a bearish crossover signals a sell. Document these rules and follow them consistently to keep emotion out of your trading.
-
Entry: Define the exact conditions for a trade entry. This might be a simple crossover, or a crossover supported by other indicators like increased volume or a bullish Relative Strength Index (RSI) reading.
-
Exit: Set your profit targets and stop-loss levels. This determines when you lock in profits and limits potential losses.
Setting Risk Parameters
Managing risk is vital for long-term success. Figure out your maximum risk per trade and use proper position sizing. This ensures no single trade wipes out your capital.
-
Stop-Loss: Decide on your stop-loss strategy, perhaps a fixed percentage below the entry price or based on recent support levels.
-
Position Sizing: Calculate the right number of shares or contracts to trade, considering your stop-loss and maximum risk.
Tracking and Evaluating Performance
Regularly track and analyze your trading to find areas to improve. Look at metrics like win rate, average profit/loss, and maximum drawdown. This helps you refine your system, adapting to market changes and optimizing for profit. Keep a trading journal or spreadsheet to record your trades and results. Review this data to find patterns and strengths and weaknesses in your system.
By following these steps and using the tools on ChartsWatcher, you can build a personalized moving average crossover system for your unique style and goals. This approach helps remove bias and makes for a more consistent, profitable trading experience. Ready to improve your trading? Check out ChartsWatcher's features and start building your system today! Visit ChartsWatcher
