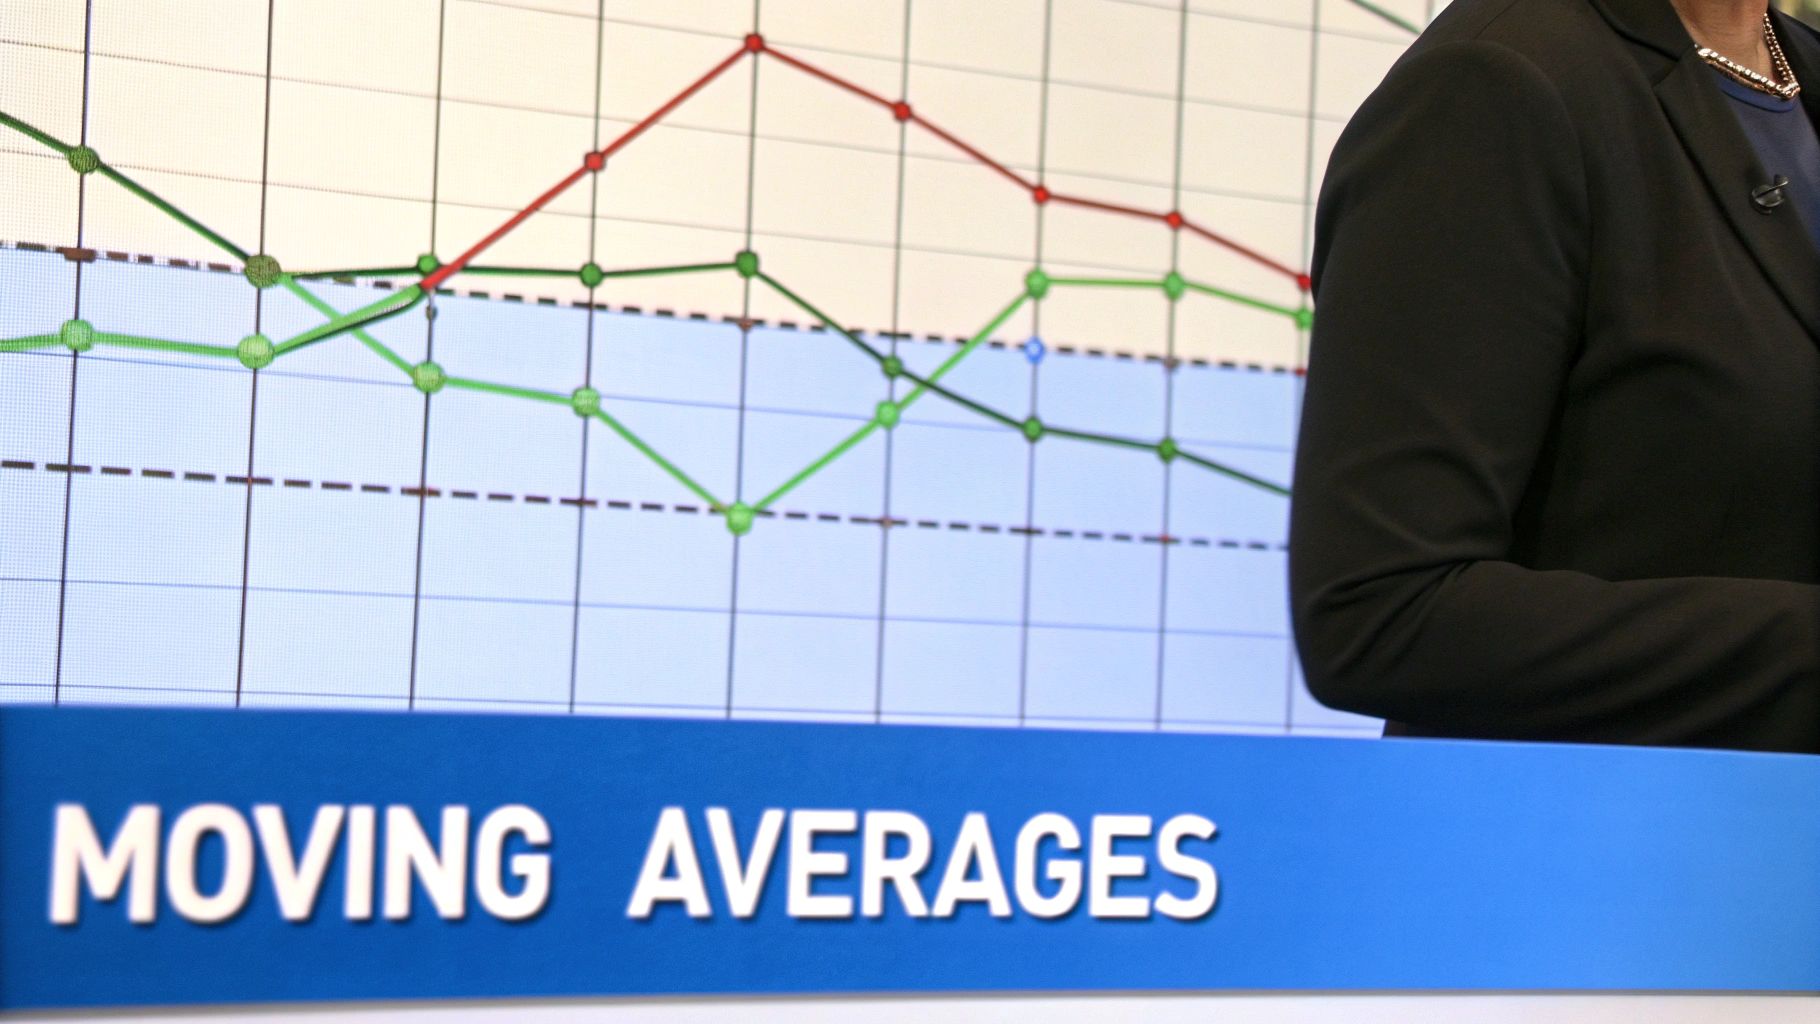
Master the Moving Average Crossover Strategy: Tips & Tricks
The Art and Science of Moving Average Crossovers

Moving average crossover strategies are a fundamental aspect of technical analysis, used by traders in various markets. These strategies use the power of moving averages to filter out market fluctuations and identify core trends. This empowers traders to make informed decisions based on smoothed price action, rather than reacting to every short-term price change. This section explores the key principles behind these strategies and discusses their continued relevance in today's markets.
Understanding Moving Averages
The foundation of a moving average crossover strategy is the concept of the moving average itself. A moving average (MA) is a statistical calculation that averages a set of data points over a specific time period. This creates a dynamic average that smooths out price volatility, revealing the underlying trend. Several types of moving averages exist, each with its own calculation method and characteristics:
- Simple Moving Average (SMA): The SMA is the most basic type, calculated by adding the closing prices over a given period and dividing by the number of periods.
- Exponential Moving Average (EMA): The EMA prioritizes recent prices, making it more sensitive to new market data compared to the SMA.
- Weighted Moving Average (WMA): Similar to the EMA, the WMA assigns different weights to each data point, but uses a linear weighting system.
The selection of moving average type depends on the trader's preferences and trading style.
The Crossover Signal
The essence of the moving average crossover strategy lies in the interplay between two or more moving averages with different lengths. Typically, a shorter-term MA (e.g., 50-day) and a longer-term MA (e.g., 200-day) are used. When these two lines intersect, they produce trading signals:
- Golden Cross: A Golden Cross forms when the shorter-term MA crosses above the longer-term MA. This pattern suggests a potential upward trend and may signal a buying opportunity.
- Death Cross: A Death Cross forms when the shorter-term MA crosses below the longer-term MA. This pattern indicates a potential downward trend and may signal a selling opportunity.
The moving average crossover strategy, a cornerstone of technical analysis, gained prominence in the 20th century, particularly with the growth of computer-based trading in the 1970s and 1980s. This strategy typically employs two moving averages of different lengths, such as a 50-day and a 200-day simple moving average (SMA). The classic signals are a "Golden Cross," where the shorter 50-day SMA crosses above the longer 200-day SMA, hinting at a bullish trend, and a "Death Cross," where the shorter SMA crosses below, suggesting a potential bear market. Learn more about this strategy here.
Timeframe Selection
The timeframe chosen for the moving averages significantly influences the signal quality. Shorter timeframes (e.g., 10-day, 20-day MAs) generate more signals but are also susceptible to false signals, often called whipsaws. Longer timeframes (e.g., 100-day, 200-day MAs) generate fewer signals, which may be more reliable, but might result in missed opportunities or delayed entries. The best timeframe depends on the trader's individual trading style and risk tolerance. Day traders might favor shorter timeframes, while long-term investors might choose longer ones.
Limitations of Moving Average Crossovers
Although powerful, moving average crossover strategies have limitations. They are lagging indicators, reacting to price changes rather than anticipating them. This lag can lead to delayed entries and exits, potentially affecting profitability. Moreover, crossovers can produce false signals, particularly in volatile or sideways markets. Consequently, it's essential to combine moving average crossovers with other technical indicators and analyze the overall market conditions to enhance their effectiveness. This approach helps traders validate signals, reduce noise, and make more informed trading choices.
Golden Cross vs. Death Cross: Timing Market Reversals
Moving average crossovers offer valuable clues about potential market reversals. Two well-known patterns are the Golden Cross and the Death Cross. These seemingly simple patterns can provide powerful signals when viewed within the context of the overall market. Let's explore the nuances of these signals and how traders use them to anticipate market shifts.
Decoding the Golden and Death Crosses
Both the Golden Cross and Death Cross are formed by the intersection of two moving averages: a shorter-term and a longer-term moving average. The Golden Cross, a bullish signal, appears when the shorter-term MA crosses above the longer-term MA. This suggests strengthening short-term momentum and a possible emerging uptrend. A classic example is the 50-day MA crossing above the 200-day MA. The Death Cross, conversely, is a bearish signal. It occurs when the shorter-term MA crosses below the longer-term MA, suggesting weakening momentum and a potential downtrend.
Confirmation Is Key: Separating Signal from Noise
While the crossover itself is significant, relying on it alone can lead to inaccurate signals. Traders often look for confirmation signals to validate the crossover. Analyzing volume patterns provides an additional layer of confidence. High volume with a Golden Cross strengthens the bullish signal. Likewise, increased volume during a Death Cross reinforces the bearish outlook. The overall market context is also crucial. A Golden Cross during a period of market optimism is more reliable than one during a bearish period.
Context Matters: Adapting to Market Environments
The reliability of Golden and Death Cross signals varies depending on the market environment. During strong trends, these crossovers tend to be effective. However, in choppy or sideways markets, they can generate false signals, often called whipsaws. Experienced traders adjust their interpretation of these signals based on market conditions. They might seek stronger confirmation in volatile markets or disregard crossovers during periods of consolidation.
Institutional vs. Retail Interpretation: Why It Matters
Institutional and retail traders often interpret these signals differently. Institutional traders, with their extensive resources and sophisticated algorithms, often use crossovers as one part of a larger, multi-faceted approach. They might incorporate other technical indicators, fundamental analysis, and market sentiment data. Retail traders, however, may rely more heavily on the crossover itself, increasing their vulnerability to false signals.
To further understand the key differences between these two crucial indicators, let's take a look at the following comparison:
Golden Cross vs. Death Cross Comparison
| Signal Type | Formation Pattern | Market Indication | Timeframe Reliability | Historical Win Rate | Best Market Conditions |
|---|---|---|---|---|---|
| Golden Cross | Shorter-term MA crosses above longer-term MA | Bullish | More reliable in longer timeframes | Varies depending on asset and timeframe; generally not a standalone predictor | Trending bull markets |
| Death Cross | Shorter-term MA crosses below longer-term MA | Bearish | More reliable in longer timeframes | Varies depending on asset and timeframe; generally not a standalone predictor | Trending bear markets |
This table highlights the core differences and similarities between the Golden Cross and Death Cross, emphasizing their respective bullish and bearish implications and the importance of timeframe considerations. While historical win rates offer some insight, it's crucial to remember that neither signal guarantees future market direction.
Understanding these differences is crucial for developing a robust moving average crossover strategy. Learning to filter out the noise and identify true shifts in market sentiment is key. This involves recognizing the limitations of these signals and combining them with other analytical tools.
Customizing Your Strategy for Maximum Performance
While the basic moving average crossover strategy offers a solid starting point, customizing it can greatly improve its effectiveness. This involves refining parameters, choosing the appropriate moving average type, and thoroughly testing your approach. Ultimately, customization allows you to tailor the strategy to specific market dynamics and your personal trading style.
Optimizing Moving Average Parameters
A key aspect of customization involves adjusting the periods of your moving averages. The standard 50-day and 200-day combination may not be ideal for all markets or timeframes.
Shorter periods, such as 10-day and 20-day, can be more sensitive to short-term price fluctuations, making them suitable for day trading. However, this sensitivity can also generate false signals in volatile markets.
Longer periods, conversely, produce smoother signals suitable for longer-term trends. The trade-off is potentially delayed entries and exits. Finding the right balance is crucial for consistent success.
Choosing the Right Moving Average Type
Beyond the standard Simple Moving Average (SMA), traders also use Exponential Moving Averages (EMAs) and Triple Exponential Moving Averages (TEMAs).
- EMAs: Give greater weight to recent prices, making them more responsive to new information.
- TEMAs: Amplify the EMA effect, resulting in even greater sensitivity.
The best choice depends on the specific market and your trading goals. In trending markets, EMAs and TEMAs can effectively capture momentum. However, in ranging markets, their sensitivity can lead to whipsaws.
For example, in a fast-paced market like cryptocurrencies, a shorter-period EMA crossover might be more effective. In a less volatile market like bonds, an SMA crossover with longer periods might be preferable. For more on chart customization, check out this article: How to master stock chart customizations.
Backtesting and Avoiding Curve-Fitting
Optimizing a moving average crossover strategy requires comprehensive backtesting. This involves trying different parameter combinations and moving average types across various historical market scenarios. This helps identify robust configurations that perform consistently.
However, it's essential to avoid curve-fitting, or over-optimizing a strategy to perfectly match past data. This often leads to disappointing results in live trading. Rigorous backtesting across diverse market conditions is key to ensuring robustness. One sophisticated method involves systematically testing numerous moving average pairings—including SMAs, EMAs, and TEMAs—using historical data to find the optimal combinations.
For example, the Best MA Pair Finder (as of March 2025) automatically backtests all possible fast and slow MA combinations. It focuses on pairs with a statistically significant number of trades (minimum trade threshold) to ensure reliability. Learn more here.
Adapting to Market Conditions and Risk Tolerance
Finally, adapting your moving average crossover strategy to current market conditions and your personal risk tolerance is paramount.
In volatile markets, wider stop-loss orders may be needed to prevent premature exits. In calmer markets, tighter stops can maximize profits. Your risk tolerance should also influence position size and trading frequency.
A conservative trader may favor a longer-term strategy with fewer trades, while a more aggressive trader might choose a shorter-term, higher-frequency approach. Finding the right balance between performance and risk is the key to long-term success in trading.
Multiple Timeframe Analysis: The Professional Edge
Professional traders rarely rely on just one timeframe when using a moving average crossover strategy. Analyzing multiple timeframes offers a more complete understanding of market trends and helps filter out those pesky false signals. This section explores the advantages of this approach and provides practical frameworks for implementation.
Why Use Multiple Timeframes?
Relying solely on a single timeframe, like a daily chart, can sometimes be misleading. A crossover on a daily chart might initially look like a buy signal. However, a higher timeframe, such as the weekly chart, could reveal a prevailing downtrend. This can lead to entering a trade against the overall market direction, increasing potential losses. Analyzing multiple timeframes allows traders to see the bigger picture, reducing the likelihood of being caught in these false signals.
For example, a 50-day and 200-day moving average crossover on a daily chart might generate a buy signal. But, checking the weekly chart could show those same averages are still in a bearish configuration. This difference suggests the daily buy signal could be unreliable and warrants further investigation.
Building a Timeframe Hierarchy
A key element of successful multi-timeframe analysis is establishing a clear hierarchy. This means choosing timeframes that align with your trading goals and analyzing them methodically. A common strategy is to use a blend of long-term, medium-term, and short-term timeframes.
-
Long-term: Provides the overall market context and identifies the main trend. Examples include weekly or monthly charts.
-
Medium-term: Confirms the direction of the long-term trend and identifies possible entry and exit points. The daily chart is often used here.
-
Short-term: Used for fine-tuning entry and exit timing, and for managing active trades. Hourly or 15-minute charts are common examples.
A swing trader might use weekly charts to identify general trends, daily charts for pinpointing entry/exit points, and hourly charts for precise trade management.
Timeframe Combinations for Different Trading Styles
Different trading styles often benefit from particular timeframe combinations.
-
Day Trading: Focus is on shorter timeframes such as 5-minute, 15-minute, and hourly charts. Longer timeframes, like the 4-hour or daily chart, can be helpful for context.
-
Swing Trading: A combination of daily, weekly, and monthly charts helps to align entries and exits with broader market moves.
-
Position Trading: The emphasis here is on weekly, monthly, and even yearly charts to capture those longer-term trends.
Resolving Conflicting Signals
Sometimes, multi-timeframe analysis reveals conflicting signals. For example, a shorter timeframe might show a buy signal, while a longer timeframe indicates a sell. In these situations, it's often wise to prioritize the longer timeframe signal as it generally represents the more dominant market trend. This approach can help you avoid trading against the prevailing direction.
Imagine a day trader sees a buy signal on a 15-minute chart, but the hourly chart shows a sell signal. Prioritizing the hourly chart could help prevent a loss, as the short-term uptrend may simply be a temporary pullback within a larger downtrend.
Adapting to Volatility
Adapting your multi-timeframe analysis to evolving market conditions is essential. During high volatility, it's usually best to use longer timeframes for greater signal stability. In calmer periods, shorter timeframes can help capture smaller price moves. This flexibility allows your moving average crossover strategy to remain effective no matter the market environment. By understanding multi-timeframe analysis, you gain a valuable advantage, allowing you to identify high-probability trades and better manage risk.
Creating a Complete Trading System With Complementary Indicators

Moving average crossover strategies are effective tools for technical traders. However, even these reliable strategies can be significantly improved. By incorporating complementary indicators, professional traders often enhance their results and boost their signal-to-noise ratio. They achieve this by integrating indicators that confirm existing trends, filter out those pesky false signals, and ultimately give a more comprehensive market view.
Enhancing Moving Average Crossovers With Momentum Oscillators
Momentum oscillators like the Relative Strength Index (RSI) and the Stochastic Oscillator offer valuable insights into potential market reversals. They help identify overbought and oversold conditions, confirming signals from moving average crossovers.
For instance, a golden cross (when a short-term moving average crosses above a long-term moving average) accompanied by an RSI rising from oversold territory creates a stronger bullish signal. Conversely, a death cross (short-term moving average crossing below a long-term moving average) combined with an overbought stochastic oscillator reinforces a bearish signal. This combination helps traders identify higher-probability trades.
Adding Volume Indicators for Confirmation
Volume indicators such as On-Balance Volume (OBV) and Volume Profile offer a deeper understanding of trend strength. Rising OBV during a golden cross confirms strong buying pressure, validating the bullish move. Declining OBV during a death cross confirms selling pressure, adding weight to the bearish outlook. Volume Profile helps identify key support and resistance levels, enhancing entries and exits based on the moving average crossover strategy.
Incorporating Volatility Measures for Risk Management
Volatility indicators like the Average True Range (ATR) and Bollinger Bands are crucial for risk management. The ATR sets dynamic stop-loss orders based on market volatility, helping traders avoid being stopped out during normal price swings. Bollinger Bands visually represent price volatility, aiding in spotting breakouts or reversals and complementing crossover signals. For example, a price breakout above the upper Bollinger Band combined with a golden cross could signal a strong upward movement.
Analyzing Moving Average Crossover Strategies with Backtesting
Empirical analysis and backtesting offer invaluable insights. A key finding shows combining multiple moving averages (e.g., a short-term and a long-term) provides more reliable signals than a single moving average. The crossover acts as a difference function, highlighting buy or sell opportunities when it crosses zero. Shorter-period moving averages (like 20 or 50 days) react quickly, but can generate false signals in volatile or range-bound markets. Longer-period averages (100 or 200 days) are smoother, better for trend-following. Learn more about optimizing your trading plan with moving averages here.
Resolving Conflicting Signals and Establishing a Decision Hierarchy
Sometimes, indicators will disagree. A clear decision hierarchy is essential. A trader might prioritize the moving average crossover as the primary signal, using momentum and volume as secondary confirmation filters. This combats analysis paralysis and fosters consistent decision-making. Requiring confirmation from both momentum and volume before entering a trade further refines the strategy.
Practical Trading Examples: Enhancing Signal-to-Noise Ratio
Consider a stock showing a golden cross, but the RSI is overbought. This hints at a potential pullback. A prudent trader might wait for the RSI to retreat before entering long. Conversely, a death cross with a rising OBV signals a potential false signal. This might encourage delaying a short position or even considering a long position if other indicators are bullish.
By strategically combining moving average crossovers with other technical indicators, traders can develop a robust, adaptable trading system. This integrated approach filters noise, confirms high-probability signals, and improves risk management, ultimately boosting trading performance.
Risk Management: Protecting Capital While Maximizing Gains
A well-defined moving average crossover strategy can provide clear entry and exit signals. However, even the best strategy can fail without proper risk management. This section explores how successful traders incorporate robust risk management frameworks into their crossover strategies to protect capital while maximizing gains.
Position Sizing: A Volatility-Based Approach
Instead of using arbitrary percentages, professional traders often base position sizing on market volatility. A popular tool for measuring volatility is the Average True Range (ATR). By using the ATR to determine position size, traders can adjust their exposure based on current market conditions. For example, a smaller position size can limit potential losses in a high-volatility environment. Conversely, a larger position size can magnify profits when volatility is low.
Stop-Loss Orders: Respecting Market Structure
Experienced traders often use ATR-based stops. These stops are placed a certain multiple of the ATR away from the entry price. This approach allows stops to adjust dynamically to changing market volatility. This means stops are wider during volatile periods, giving trades room to breathe, and tighter during calmer periods, maximizing profit potential.
Scaling into Positions: Optimizing Entry Points
Scaling into positions allows traders to enter a trade gradually. Rather than committing all their capital at once, traders enter in stages at progressively better price points. This method reduces risk, especially when entering near a potential reversal. This approach uses the moving averages themselves as dynamic support and resistance levels, allowing traders to add to winning positions as the trend develops.
Trailing Stops: Protecting Profits and Letting Trends Run
Trailing stops are essential for locking in profits while allowing trends to develop. These stops automatically adjust as the price moves favorably, protecting profits while letting the trade continue as long as the trend persists. Using a moving average as a dynamic trailing stop offers a way to stay with winning trends while limiting downside risk. As the price rises, the trailing stop moves higher, locking in gains. If the price reverses, the trailing stop triggers an exit, protecting profits.
Diversification: Smoothing the Equity Curve
Diversifying across multiple markets is a fundamental principle of risk management. This spreads risk and reduces the impact of any single market's performance on the overall portfolio. Combining a moving average crossover strategy with diversification can smooth the equity curve, leading to more consistent returns over time. This can involve using the strategy across various asset classes or different timeframes. Learn more in this article about How to master day trading risk management.
Adapting to Changing Market Conditions: Dynamic Risk Management
Experienced traders understand that market conditions can change rapidly. They adapt their risk management parameters accordingly. For example, they might widen stop-loss orders or reduce position sizes during periods of high volatility. They might tighten stops or increase position sizes during calmer periods. This dynamic approach helps them navigate various market environments and consistently manage risk.
To illustrate the impact of different moving average combinations and risk management techniques, let's examine some performance metrics.
The following table provides a summary of key performance indicators across various market situations and asset classes for different moving average crossover combinations.
Moving Average Crossover Strategy Performance Metrics
| MA Combination | Win Rate | Profit Factor | Max Drawdown | Avg Trade Duration | Market Conditions | Best Asset Class |
|---|---|---|---|---|---|---|
| 5-20 | 55% | 1.8 | 8% | 3 Days | Trending | Stocks |
| 10-50 | 60% | 1.5 | 12% | 7 Days | Sideways | Forex |
| 20-100 | 65% | 1.2 | 15% | 14 Days | Volatile | Commodities |
| 50-200 | 70% | 1.1 | 20% | 30 Days | Ranging | Bonds |
As you can see, the optimal moving average combination and the resulting performance metrics can vary significantly based on the market conditions and the chosen asset class. By incorporating these risk management techniques, traders using moving average crossover strategies can significantly improve their long-term trading performance. They transition from simply reacting to market fluctuations to proactively controlling their exposure and ensuring consistent growth while minimizing potential losses.
Real-World Performance: What the Data Actually Reveals

Moving past theory, let's explore how moving average crossover strategies perform in practice. Backtesting, the application of a strategy to historical data, offers valuable insights into a trading system's potential. This section examines what the data tells us about real-world results, highlighting both the advantages and disadvantages of the moving average crossover strategy.
Analyzing Key Performance Metrics
Backtesting empowers traders to analyze key metrics. These include win rates, profit factors, maximum drawdowns, and risk-adjusted returns. The win rate, the percentage of winning trades, is crucial but not the sole indicator of success. The profit factor, calculated as the ratio of gross profits to gross losses, indicates the strategy's overall profitability.
Maximum drawdown, the largest peak-to-trough decline in a given period, offers insights into potential risks. Finally, risk-adjusted returns, such as the Sharpe Ratio, measure returns relative to the strategy's volatility.
For example, a strategy may have a high win rate but a low profit factor if losses significantly outweigh wins. This emphasizes the importance of considering all metrics together.
The Impact of Market Conditions
Market conditions can influence the effectiveness of moving average crossover strategies. These strategies generally perform well in trending markets, where clear upward or downward movements are evident.
However, in choppy or range-bound markets, where prices fluctuate within a defined range, the strategy may generate false signals, resulting in losses.
The Importance of Diversification and Valid Backtesting
Diversification is crucial for trading success. Distributing risk across various markets or assets can significantly enhance performance by mitigating reliance on a single market. Valid backtesting is equally important.
This involves avoiding pitfalls like curve-fitting, where the strategy is over-optimized to past data, creating unrealistic future expectations.
For instance, historical backtesting from 2000 to 2018 across major markets revealed compelling results. A simple SMA crossover strategy, combined with a 3 Average True Range (ATR) trailing stop loss and 1% risk per trade, generated an annual return of approximately 1.31% when applied to only three markets. Diversifying across 20 markets boosted the annual return to about 14.3%. This highlights the power of diversification in trend-following strategies. For more detailed statistics, visit this resource. This data also underscores the fact that moving average crossovers excel in trending markets but struggle in choppy conditions. Multiple market exposure increases the chances of capturing more trending opportunities.
Understanding Transaction Costs and Slippage
Transaction costs, including commissions and fees, and slippage, the difference between expected and actual execution prices, can significantly impact real-world returns. These costs should be incorporated into backtesting for a realistic profitability assessment.
Successful and Unsuccessful Trading Periods: Case Studies
Analyzing both successful and unsuccessful trading periods offers valuable insights. Examining profitable periods reveals the conditions under which the strategy thrives. Studying losing periods highlights vulnerabilities and potential areas for improvement. This analysis can inform adjustments to the strategy or risk management parameters.
Market Evolution and Strategy Adaptation
Financial markets constantly evolve. A strategy that performed well in the past may not be as effective in the future. Continuous monitoring and adaptation are essential for long-term success with the moving average crossover strategy.
Ready to elevate your trading? ChartsWatcher provides a powerful platform for charting, scanning, and backtesting your strategies. With customizable dashboards, real-time data, and advanced features, ChartsWatcher empowers you to make informed trading decisions. Explore ChartsWatcher today and unlock your trading potential!
