Master How to Track Investment Portfolio Like a Pro
To really get a handle on your investment portfolio, you need to do more than just glance at your account balance. True portfolio tracking is about systematically reviewing your asset allocation, measuring performance against key benchmarks, and making sure everything is still aligned with your long-term financial goals. The right tools give you a clear, complete picture of your wealth.
Why Portfolio Tracking Is Your Strategic Edge
Moving beyond simple balance checks is a complete game-changer for any serious investor. Think of dedicated portfolio tracking less as a chore and more as your personal command center for managing your wealth. It's the only way to see past the day-to-day market noise and make informed, proactive decisions.
Without it, your portfolio can slowly drift away from its original purpose. An asset mix that was perfectly balanced a year ago might now be dangerously overexposed to a single, volatile sector simply because of market movements. This is a hidden risk many investors only discover after it’s too late.
Navigate Volatility With Confidence
Proactive tracking helps you navigate market swings with a clear head instead of reacting emotionally. We saw a great example of this in recent global asset allocation trends. Despite a sharp 11% drop in global equities one month due to geopolitical events, the market bounced back, with stocks rising over 9% for the full quarter.
Investors who were closely tracking their portfolios could see the bigger picture. Instead of panic selling, they were able to identify resilience in credit markets and specific tech sectors. You can dig into these kinds of dynamic shifts in a recent J.P. Morgan asset allocation report.
This data-driven approach is what separates guessing from strategy. Before we dive deeper, let's look at the core benefits of this approach.
| Benefit | Strategic Impact |
|---|---|
| Identify Hidden Risks | Uncover over-concentration in a stock or sector before it becomes a major liability. |
| Spot Emerging Opportunities | Recognize which asset classes are outperforming and decide if it's time to rebalance. |
| Maintain Goal Alignment | Ensure your investment mix continues to match your risk tolerance and long-term goals. |
| Disciplined Rebalancing | Use hard data, not emotion, to trim profits and reinvest in undervalued areas. |
Consistent tracking gives you the clarity needed to make smarter, more strategic decisions, keeping your portfolio healthy and on track.
A portfolio that isn't regularly monitored is like a ship without a rudder. It might stay afloat for a while, but it's not heading toward its intended destination and is vulnerable to the first major storm.
Ultimately, the goal is to use this information to make smarter rebalancing decisions. Instead of guessing, you’ll have concrete data showing you exactly when to trim profits from a high-flying asset and reinvest in one that’s underperforming. This disciplined process is fundamental to keeping your assets perfectly aligned with your financial plan and avoiding costly, emotion-driven mistakes. It transforms you from a passive observer into the active manager of your own financial future.
Building Your Centralized Tracking Dashboard
Okay, let's move from theory to action. This is where you get to build the command center for your entire financial world—a single, unified dashboard that gives you an immediate, comprehensive overview of everything you own. We'll use a platform like ChartsWatcher as our primary example to bring all your scattered financial data into one coherent view.
The first move is to connect your various brokerage accounts. Modern platforms use secure, read-only APIs to link with major players like Fidelity, Charles Schwab, and Vanguard. This connection is a game-changer because it automatically syncs your holdings, transactions, and balances. It completely eliminates the tedious and error-prone chore of manually entering every stock or ETF you buy.
The image below really captures what this looks like in practice. An investor can instantly see their entire portfolio consolidated, tracking gains and performance over time.
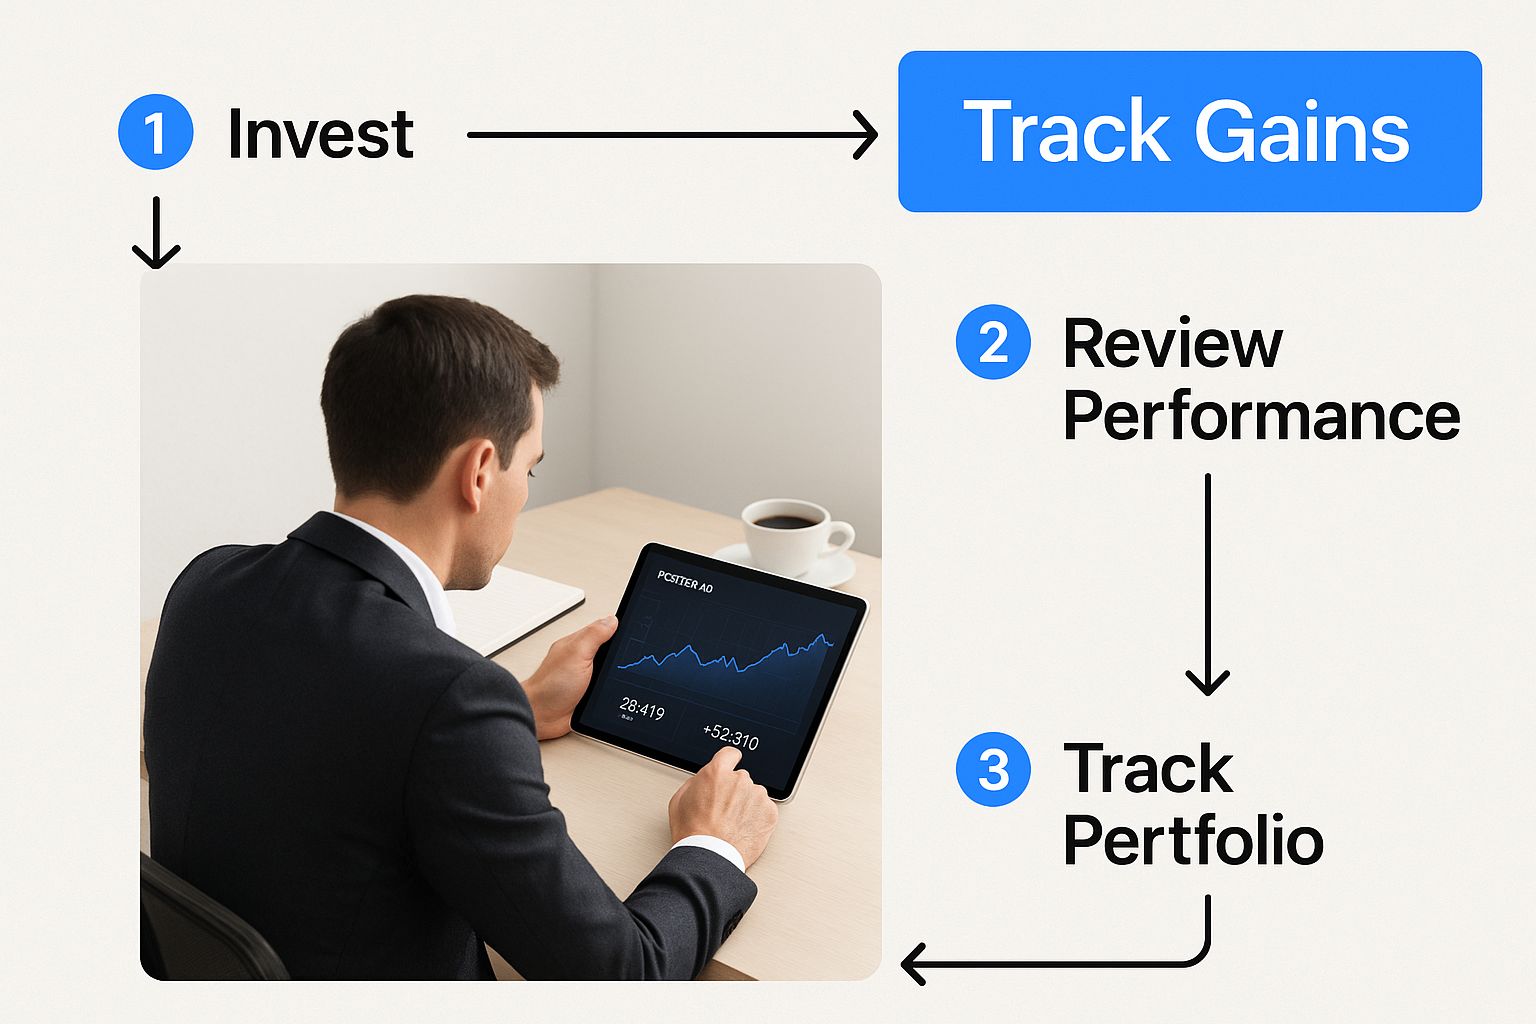
This is the core benefit right here: seeing the big picture at a glance. Performance charts, overall asset growth, individual holdings—it's all in one place.
Adding Alternative and Manual Assets
Of course, not all investments live on a public exchange. A truly modern portfolio often includes assets like real estate, cryptocurrency, private equity, or even collectibles. A solid tracking tool has to let you manually input these holdings to get a true picture of your total net worth.
For instance, you might add your primary residence by keying in its estimated market value and any outstanding mortgage. For cryptocurrencies held in a cold wallet, you can add the coin and quantity, and a good platform will often track its real-time market value for you.
The goal here is comprehensiveness. A dashboard that only shows 50% of your assets provides a dangerously incomplete picture. To make truly strategic decisions, you have to see how every piece of your financial puzzle fits together.
This step ensures your dashboard reflects your complete financial reality, not just the easily tracked public market stuff. It allows you to see how less-liquid assets contribute to your overall allocation and risk profile.
Customizing Your Portfolio View
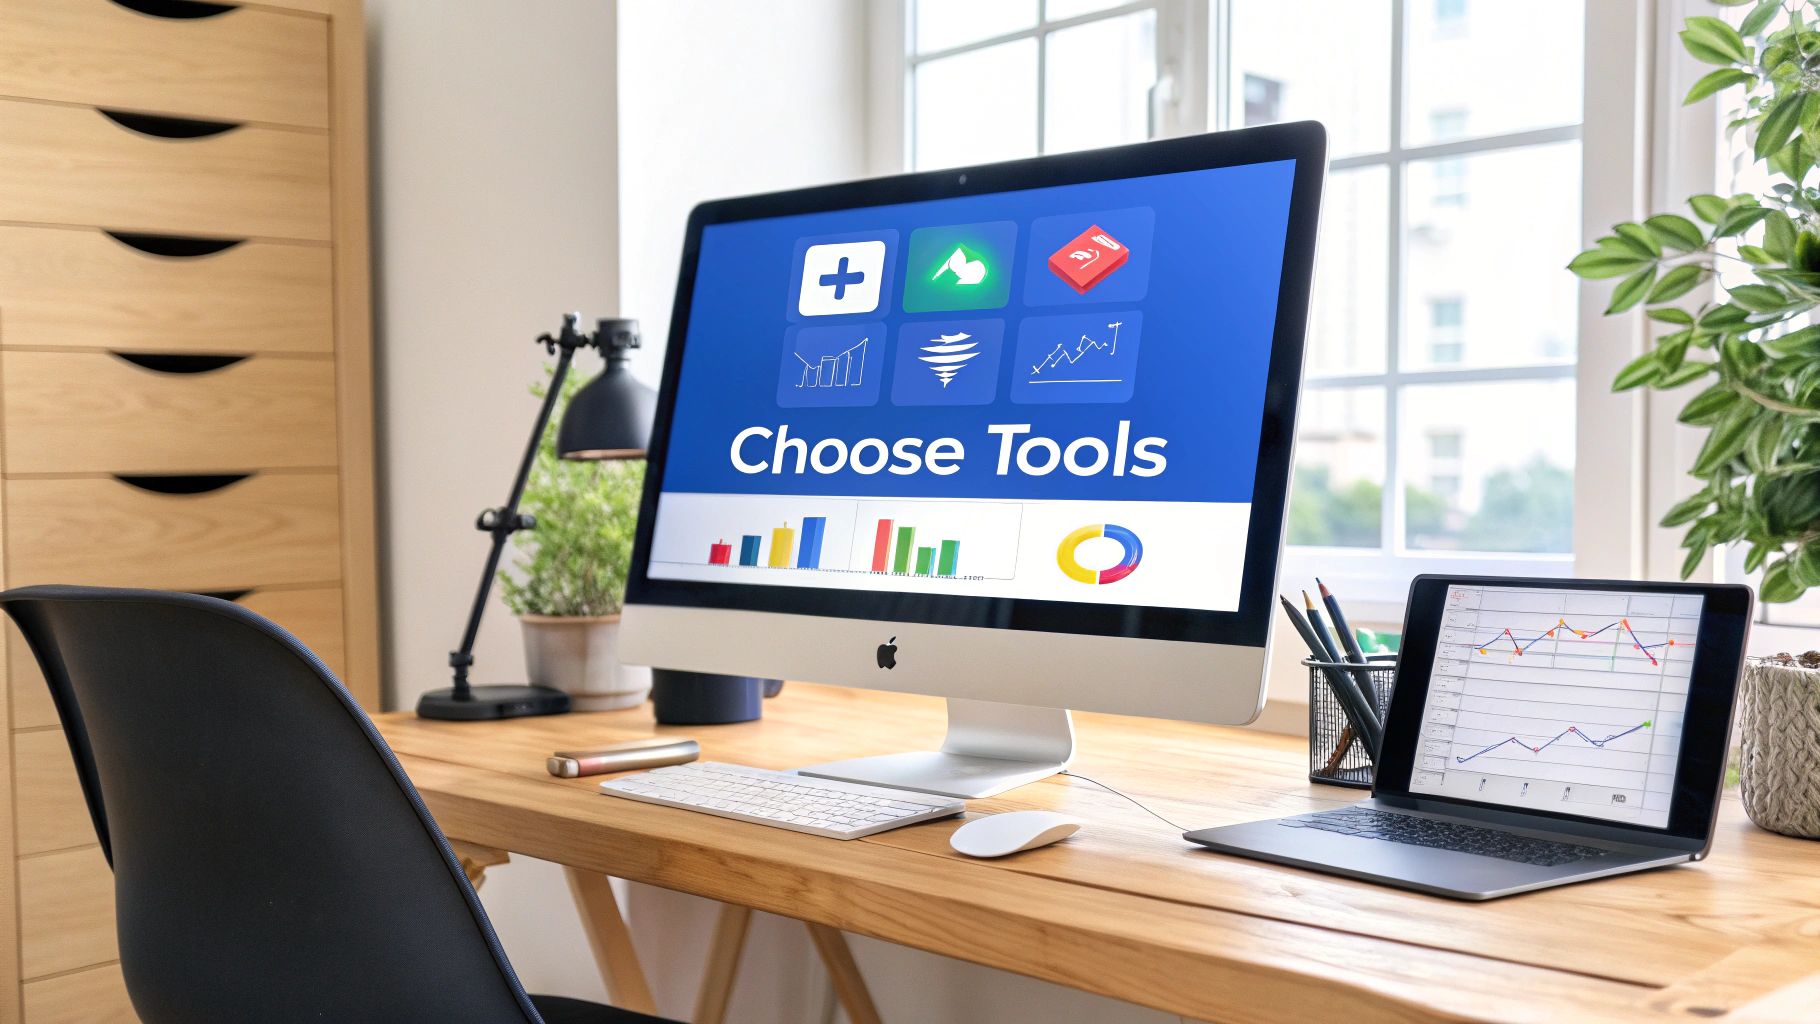
Once all your data is aggregated, the fun part begins: customization. No two investors have the same goals, so your dashboard should reflect what matters most to you. This is where platforms like ChartsWatcher really shine, allowing you to build views focused on specific metrics.
Here’s what a typical customizable interface might look like.
As you can see, the modular layout gives you the power to arrange charts, news feeds, and watchlists to perfectly suit your personal workflow.
You can tailor your main view to prioritize whatever data points you care about. Here are a few examples of custom views you could create:
- Income-Focused View: This dashboard would highlight dividend income, interest payments, and rental cash flow, giving you a clear, real-time picture of your portfolio's cash generation.
- Growth-Oriented View: Here, you might feature your top-performing assets, percentage gains over various timeframes, and performance benchmarks against an index like the S&P 500.
- Risk Management View: This could focus on asset allocation percentages, sector concentration, and volatility metrics to make sure your portfolio isn't overly exposed to any single risk factor.
Building a powerful, personalized dashboard is a foundational skill for any serious investor. For more detailed guidance, you can master your stock market dashboard in simple steps with our in-depth guide. By creating this single source of truth, you equip yourself with the clarity needed to make smarter, more confident financial decisions.
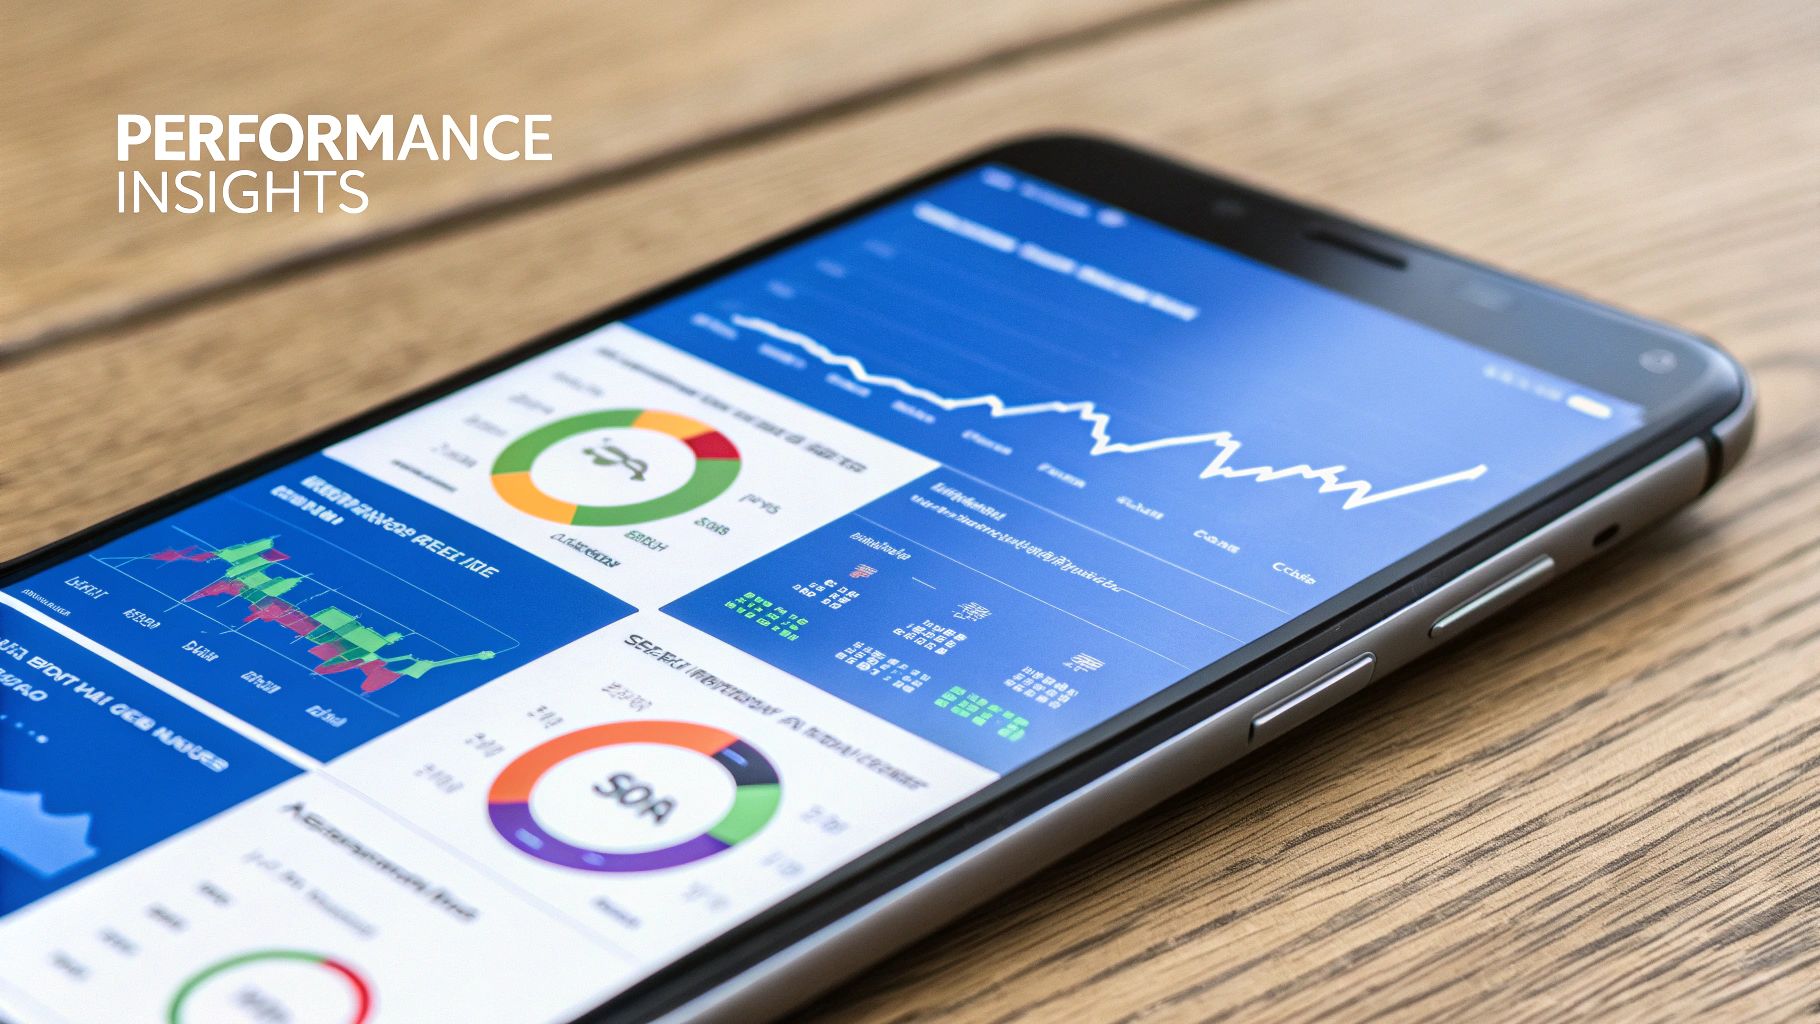
Unlocking Deeper Portfolio Insights
Okay, you’ve built your centralized dashboard. The basic accounting is done. Now, we get to the good stuff—moving beyond simply monitoring your balance to conducting a sophisticated analysis of your investments.
This is where you truly start to track investment portfolio performance in a way that gives you real, actionable intelligence. It’s about understanding not just what you own, but how it's actually performing for you.
Seeing your total portfolio value go up is a nice feeling, but it’s a pretty hollow victory without context. Are you outperforming the market, or are you just riding a wave that’s lifting all boats? To answer that, you need a benchmark. Comparing your returns against a relevant index, like the S&P 500 for a portfolio heavy in U.S. stocks, gives you a clear yardstick to measure your success.
Measuring What Truly Matters
True analysis goes deeper than just the top-line number. It means digging into the specific metrics that paint a full picture of your portfolio's health and progress.
Dividend income is a perfect example. For a lot of us, tracking dividends is crucial for seeing how much passive cash flow our investments are generating. You can set up your ChartsWatcher dashboard to isolate and track these payments, showing you exactly what your portfolio is earning in income, separate from any stock price appreciation. This is non-negotiable for retirement planning or any strategy where income is a top priority.
Another critical metric I always keep a close eye on is asset allocation drift. As markets move, your portfolio's carefully planned balance will inevitably shift. A strong bull run in tech stocks, for instance, could easily push your equity exposure from a target of 60% to over 70%, quietly making your portfolio riskier than you intended.
Constant monitoring of allocation drift is your first line of defense against unintended risk. It's the mechanism that tells you when it’s time to rebalance and bring your portfolio back into alignment with your strategic goals.
This drift isn't necessarily bad—it's often a sign of growth—but letting it run wild is a classic mistake. Regular reviews give you the discipline to trim assets that have grown too large and reinvest in those that are lagging, a core practice for long-term success.
Assessing Risk and Setting Alerts
Big returns are only impressive if they justify the risk you took to get them. This brings us to risk-adjusted returns. Are your high-flying growth stocks actually delivering enough alpha to compensate for their wild swings, or could a less risky mix have given you similar results with fewer sleepless nights?
This is where historical data provides some much-needed perspective. For example, a deep analysis of 125 years of annual returns data consistently shows how powerful diversification is for managing risk. Studies prove that a strategic blend of stocks, bonds, and other assets has historically optimized risk-return profiles over the long haul.
To turn your dashboard from a passive report into an active watchdog, you need to set up custom alerts. You can create notifications for things like:
- Significant price swings in one of your key holdings.
- Asset allocation drifting by more than 5% from your target.
- Dividend announcements or any changes from your income-focused stocks.
These alerts transform your dashboard into an active risk management system. For an even deeper dive, you might explore using an AI-powered finance investment analyst to help automate some of this analysis and spot trends you might otherwise miss.
It’s no secret that a modern investment portfolio looks a whole lot different than it did a decade ago. We've moved beyond a simple mix of public stocks and bonds. Today, many savvy investors are adding alternative assets like private equity, venture capital, and real estate to the mix for better diversification and access to some pretty unique growth opportunities.
But here's the catch: these assets bring a new challenge to the table. How do you actually track investment portfolio performance when a big chunk of your holdings isn't flashing on a public stock exchange? The trick is to build a reliable system to value and monitor these illiquid investments right alongside everything else.
Valuing and Monitoring Illiquid Assets
The biggest hurdle with alternative investments is, without a doubt, valuation. Unlike a share of Apple with a price that updates every second, a stake in a startup or a piece of a real estate deal doesn't have a live market ticker. You’re often relying on periodic valuations—usually quarterly—from the fund manager.
When you add these to a platform like ChartsWatcher, you'll need to manually punch in these values and keep them updated as you get new reports. Yes, it's a more hands-on process, but it's absolutely crucial if you want a complete and accurate picture of your total net worth and asset allocation.
For instance, many investors explore different real estate investment strategies, and each one—whether it's a rental property or a syndication—needs its own method for tracking value and cash flow within your financial dashboard.
Key Takeaway: The goal isn't just to see a single net worth number. It’s to understand how these private assets are performing relative to your expectations and how they influence your overall portfolio risk and diversification.
Honestly, this hands-on approach is a blessing in disguise. It forces you to engage more deeply with your private market holdings, which is a fantastic discipline to build.
Manual vs. Automated Tracking for Alternative Assets
Deciding how to track these less-common assets often comes down to a trade-off between convenience and control. While automated tools are great for stocks, alternative assets often require a more manual touch. Here’s a quick breakdown of the two approaches.
| Tracking Method | Pros | Cons | Best For |
|---|---|---|---|
| Manual Tracking | • Complete control over valuation inputs • Forces deeper engagement with each asset • No reliance on third-party data feeds | • Time-consuming and requires discipline • Prone to human error if not careful • Valuations are only as current as your last update | Investors with a handful of high-value private assets who want maximum accuracy and understanding of their holdings. |
| Automated Tracking | • Effortless updates for public assets • Reduces manual data entry • Can provide real-time public market data | • Often fails to support non-standard assets • Can lead to inaccurate portfolio views if private assets are missing • May not handle capital calls/distributions properly | Investors whose portfolios are predominantly in public markets and who use a platform that allows for manual overrides for their few alternative assets. |
Ultimately, a hybrid approach is often the most practical. Use automation where you can, but don't shy away from the manual work needed to get a true 360-degree view of your wealth.
Handling Capital Calls and Distributions
Private equity and venture capital funds don't play by the same rules as the public markets. Instead of buying all your shares upfront, you commit a certain amount of capital, which the fund manager then "calls" over time as they find deals to invest in. Later on, when those investments mature and get sold, the fund sends distributions back to you.
Tracking these cash flows properly is non-negotiable. A capital call should be logged as an addition to your investment's cost basis. A distribution is either a return of your original capital or a realized gain. Getting this right is the only way to ensure your performance metrics, like your Internal Rate of Return (IRR), are actually accurate.
This level of detail is becoming more important than ever. Global investor surveys show a massive trend: 88% of limited partners are looking to put up to 20% of their portfolios into co-investments. A huge driver behind this is the perceived impact of AI, which is a dominant theme in venture capital right now. You can check out more on private market investment trends on Adams Street Partners.
Monitoring Geographic and Sector Exposure
Finally, a powerful move is to use your tracking system to keep an eye on your geographic and sector exposure across all assets, public and private.
Let's say you have private investments in European tech startups and public stocks in Asian consumer markets. A good dashboard can visualize this global diversification for you. This allows you to spot if you're becoming too concentrated in one region or industry, helping you stay aligned with shifting macroeconomic trends and opportunities around the world.
By properly integrating these specialized assets, you transform your tracking system from a simple stock-watcher into a true command center for your entire wealth strategy.
Common Tracking Mistakes That Hurt Returns
Having a powerful tool to track investment portfolio performance is a huge advantage, but even the best dashboard can’t save you from yourself. Your tracking habits can either support your long-term strategy or completely sabotage it with emotional, short-sighted decisions.
It's funny—the most common errors aren't about complex financial models or picking the wrong indicator. They're about human nature.
One of the most destructive habits I see is obsessive checking. Refreshing your portfolio every hour—or every ten minutes—is a recipe for anxiety. It trains you to react to every little blip, treating meaningless market noise as a signal for action.
A 2% drop on a Tuesday isn't a sign to dump everything; it’s just the market being the market. This constant monitoring almost always leads to over-trading, which racks up transaction fees and taxes that steadily chip away at your returns.
Focusing on Returns While Ignoring Risk
Another classic mistake is getting blinded by high returns without any thought for the risk involved. It’s easy to get excited about a stock that jumped 30% last month, but was that gain from a solid business development or just wild speculation? If you aren't tracking volatility and risk-adjusted returns, you’re flying blind.
A portfolio that looks great on the surface might actually be taking on way too much risk. Think about it: if your entire portfolio is concentrated in a few high-flying tech stocks, you're incredibly exposed. A single bad earnings report or regulatory change could wipe out your gains overnight.
True performance analysis has to balance both sides of the coin.
"The essence of investment management is the management of risks, not the management of returns." - Benjamin Graham
This principle is timeless for a reason. A robust tracking strategy forces you to confront your risk exposure head-on by keeping an eye on your asset allocation and concentration. It helps you see when you’ve accidentally drifted into a risk profile that doesn't match your long-term goals.
The Costly Error of Forgetting to Rebalance
Perhaps the most common—and most costly—mistake is simply failing to rebalance. It happens passively. Your winning assets grow, and they naturally become a larger slice of your portfolio pie. Suddenly, that "success" has quietly shifted your intended 60/40 stock-to-bond allocation into a much hairier 75/25 mix without you even noticing.
When you don't trim those winners and reinvest in your underperforming assets, you're essentially letting the market dictate your risk exposure. That's a passive form of market timing, and it rarely ends well.
A disciplined rebalancing strategy, prompted by the data from your tracking dashboard, is fundamental to long-term success. It systematically forces you to sell high and buy low—the very core of smart investing.
This disciplined approach is similar to how traders test their strategies before putting real money on the line. Understanding how your ideal allocation would have performed historically can give you the confidence to stick with your plan when emotions run high. To dig deeper into this, you can explore our guide on how to backtest a trading strategy at https://chartswatcher.com/pages/blog/how-to-backtest-trading-strategy-the-complete-playbook-for-modern-traders. A solid, tested plan is your best defense against making emotional portfolio decisions.
Got Questions About Tracking Your Portfolio?
Once you get serious about watching your investments, a whole new set of questions inevitably pops up. It happens to everyone. Let's walk through some of the most common ones I hear, so you can build a tracking routine that feels solid and doesn't drive you nuts.
The idea here is to get you past the uncertainty and into a rhythm that works for the long haul.
How Often Should I Actually Check My Portfolio?
This is a big one, and let me be clear: the answer is not "every single day." For most of us with a long-term strategy, obsessively checking your portfolio is a recipe for disaster. It turns normal market bumps into emotional rollercoasters, tempting you to make terrible decisions like panic selling during a dip or FOMO-buying a hot stock at its peak.
A much healthier, more disciplined approach is to put yourself on a schedule.
- Weekly Glance: A quick, 5-minute peek to see what’s what. You’re just observing, not acting.
- Monthly Review: Set aside maybe 30 minutes to dig a little deeper. Look at your performance, any dividend income, and see if your allocations are drifting.
- Quarterly Rebalancing Session: This is your main event—the time for action. Here's where you rebalance your portfolio back to its target and take a hard look at your overall strategy to make sure it still makes sense.
Sticking to a rhythm like this kills the anxiety and keeps your eyes on the long-term prize, not the daily market noise.
Over-monitoring your portfolio is like weighing yourself every hour when you're on a diet. The constant fluctuations will drive you crazy and won't reflect your actual progress. Stick to a schedule.
Is It Safe to Link My Brokerage Accounts to a Tracker?
A totally valid concern. Security should always be top of mind. The key thing to know is that reputable platforms like ChartsWatcher use read-only access when connecting to your brokerage accounts. This is a critical distinction.
"Read-only" means the platform can see your holdings and transaction history to build out your dashboard, but it has zero permission to execute trades, move money, or change anything in your accounts. Think of it like giving someone a bank statement to look at, not your debit card and PIN.
Before you connect anything, always double-check that the service uses secure, encrypted, and strictly read-only API connections.
What’s the Best Way to Really Track My Performance?
Just looking at your account balance go up or down doesn't tell you the whole story. To get a true sense of how you're doing, you need context. The single best way to do this is to benchmark your portfolio against a relevant index.
If your portfolio is mostly large U.S. companies, your benchmark is the S&P 500. If you're invested globally, something like the MSCI World index is a much better yardstick.
This simple comparison immediately tells you if your investment choices are actually adding value (what pros call "alpha") or if you're just floating along with the market tide. Any good tracking dashboard will plot your performance right against your chosen benchmark, making it dead simple to see how you stack up over time.
Ready to stop guessing and start making decisions based on your own data? ChartsWatcher gives you all the tools you need to build a professional-grade tracking dashboard, analyze your performance, and keep your strategy on course.
