Master Fibonacci Retracement and Extension Levels
Fibonacci retracement and extension levels are some of the most reliable tools in a technical trader's arsenal, used to map out potential support and resistance zones on a price chart. Think of it this way: retracements help you pinpoint where a temporary pullback in a trend might stall out, while extensions project where the price could be headed if the trend fires back up.
How Fibonacci Levels Help You Read the Market
It’s tempting to see market action as pure chaos, but seasoned traders know better. Price movement is really just a conversation between buyers and sellers, and Fibonacci retracement and extension levels act as a secret decoder ring, showing you where the market is likely to pause, reverse, or blast off with new momentum.
The Bouncing Ball Analogy
To really get a feel for this, picture a bouncing ball. When you drop it, the ball doesn’t just thud on the floor and die. It bounces back up, retracing a portion of its fall before gravity takes over again. The market moves in a very similar rhythm.
An asset screaming upwards in a strong trend will inevitably have pullbacks. Likewise, a stock in a downtrend will experience short-lived rallies. Fibonacci levels are what allow us to measure these natural “bounces” in the market, giving us a framework to anticipate the ebb and flow of price.
This leads us to the key difference between the two tools:
- Fibonacci Retracement: This tool is all about finding potential entry points within an existing trend. It answers the question, "Okay, the price is pulling back—how far down might it go before it turns around and continues the original trend?"
- Fibonacci Extension: This one is for setting profit targets. It projects price levels beyond the most recent high or low, helping you answer, "If this trend keeps going, where's a logical place to take my profits?"
In short, these tools give you a trading roadmap. Retracements signal where to potentially get in during a trend’s natural pause, while extensions suggest where to get out when the trend resumes.
Fibonacci levels are a cornerstone of technical analysis in trading because they tap directly into market psychology. Since countless traders are watching and acting on these exact same levels, they often become self-fulfilling prophecies.
Key ratios derived from the golden ratio, like 38.2% and 61.8%, frequently act as magnets for price action where you'll see consolidation or outright reversals. This widespread adoption makes them a must-have for anyone serious about making more informed trading decisions. For a deeper dive into the specific levels, check out the key Fibonacci trading levels on mindmathmoney.com.
Finding Entry Points with Fibonacci Retracement
So, you've spotted a market that's clearly trending, but you're kicking yourself for missing the initial move. What now? This is where Fibonacci retracement becomes one of the most powerful tools in a trader's arsenal. It helps you pinpoint exactly where a temporary pullback might end, giving you a second chance to jump in.
Think of a trend like a rubber band. As it stretches in one direction, it builds up tension. Eventually, it has to snap back a little before it can continue stretching further. Fibonacci levels show us the most likely places for that snap-back to pause.
These levels—23.6%, 38.2%, 50%, 61.8%, and 78.6%—act as potential support or resistance zones. In a strong uptrend, for instance, the price will often pull back to one of these levels, gather steam, and then resume its climb.
Drawing Retracement Levels Correctly
Getting these levels on your chart is straightforward, but precision is key. First, you need to identify a clear, recent price move. We call this the "swing." You're looking for a significant low point (the swing low) and a significant high point (the swing high).
Once you've found them, you'll anchor the Fibonacci tool. In an uptrend, you click on the swing low first and drag your cursor up to the swing high. For a downtrend, you do the opposite: click the swing high and drag down to the swing low. The tool in ChartsWatcher does the rest, automatically plotting the key retracement levels on your chart.
A few quick tips for accuracy:
- Make sure you're using the absolute highest and lowest points of the price move, including the wicks of the candles.
- If the price makes a new high or low, you'll need to redraw your levels to reflect the new swing.
- The best retracement zones often line up with previous areas of support or resistance, giving you an extra layer of confirmation.
For a deeper dive, check out our complete guide on Fibonacci retracements key trading levels explained.
Interpreting Retracement Zones
So, what do all these lines mean? In an uptrend, these levels are potential floors where buyers are likely to step back in. In a downtrend, they act as ceilings where sellers might regain control and push the price back down.
Each level tells a slightly different story about the strength of the trend and the depth of the pullback.
Here’s a quick breakdown of the most common Fibonacci retracement levels and what they often signal to traders during an uptrend.
Key Fibonacci Retracement Levels and Their Significance
| Level | Percentage | Common Interpretation in an Uptrend |
|---|---|---|
| 23.6% | 23.6% | A very shallow pullback, often seen in extremely strong, fast-moving trends. |
| 38.2% | 38.2% | A common and healthy retracement level. Many traders look for entries here. |
| 50% | 50% | A balanced, halfway pullback. Not technically a Fibonacci ratio, but widely used. |
| 61.8% | 61.8% | The "Golden Ratio." This is a critical level that often provides strong support. |
| 78.6% | 78.6% | A very deep retracement. If price reaches this far, the original trend may be weakening. |
This table serves as a solid starting point for understanding how to react as the price approaches each zone.
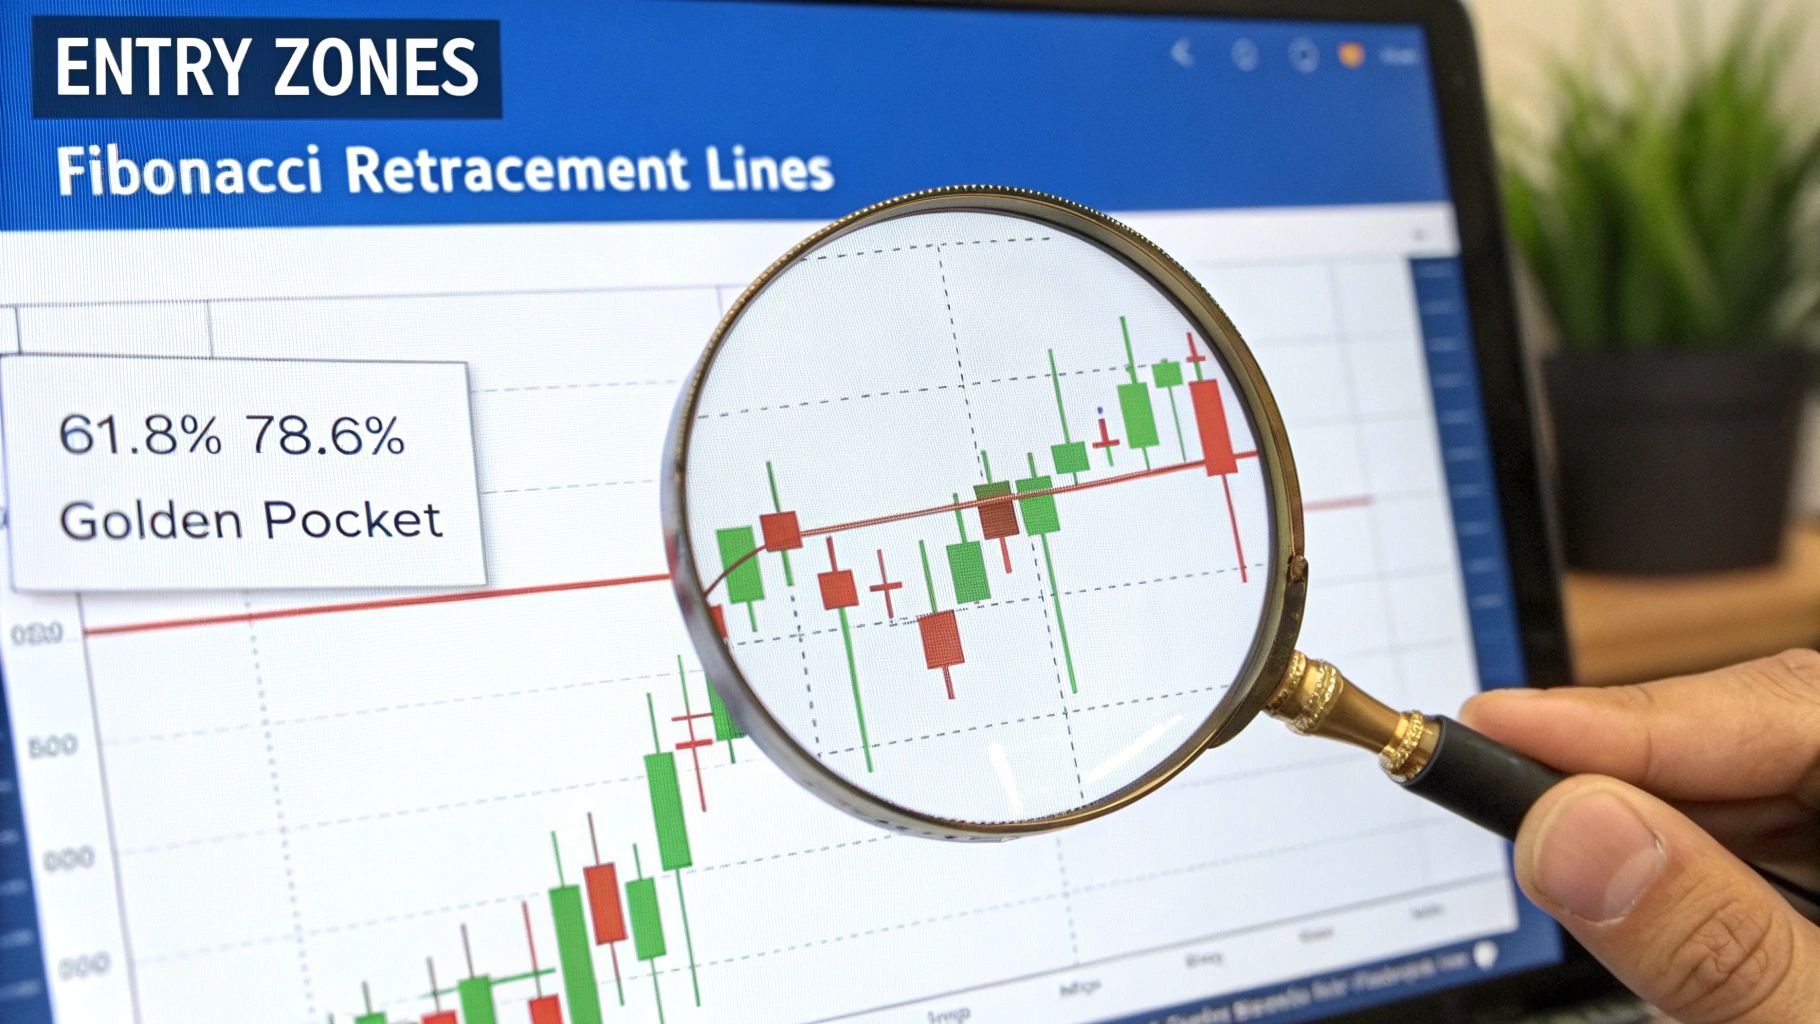
One of the most watched areas is what traders call the "Golden Pocket." This is the zone between the 61.8% and 78.6% levels. Why is it so popular? Because it often represents the last line of defense for a trend. A decisive bounce from this area can lead to a powerful and explosive move back in the direction of the original trend.
The psychology here is simple: traders all over the world are watching these exact same mathematical ratios. When enough people place buy orders at a key level like 61.8%, their collective action creates a self-fulfilling prophecy, reinforcing the level's strength.
Combining Retracement With Other Tools
Fibonacci levels are powerful, but they shouldn't be used in a vacuum. The best traders layer them with other indicators to build a stronger case for a trade.
Think of it like being a detective. One clue is interesting, but three clues pointing to the same suspect? Now you've got a case.
- Look for Confluence: Does a key Fibonacci level line up with another technical indicator, like a 50-period moving average or a major trendline? This "confluence" significantly boosts the probability of the level holding.
- Wait for Price Action: Don't just place an order because the price touches a line. Wait for a confirmation signal, like a bullish candlestick pattern (e.g., a hammer or engulfing candle) forming right on the support level.
- Manage Your Risk: Always have a plan for when you're wrong. A good rule of thumb is to place your stop-loss order just beyond the next Fibonacci level. This gives your trade room to breathe without exposing you to excessive risk.
By layering trend indicators and price action signals, you can dramatically improve your entry timing and filter out a lot of the market noise. With ChartsWatcher, you can easily overlay moving averages and other indicators on your chart to spot these high-probability confluence zones.
Setting Profit Targets with Fibonacci Extensions
So you’ve used Fibonacci retracements to find a great entry on a pullback. Awesome. But that's only half the battle. Now comes the big question: where do you take your profits?
This is where Fibonacci extension levels come into play. If retracements are for finding your way in, extensions are your roadmap for getting out with your gains intact. They help you set realistic, data-driven profit targets once the original trend kicks back into gear.
When a stock or asset breaks its previous high in an uptrend, you’re flying in uncharted territory. How far can it run? Extensions project logical stopping points where the momentum might fade, helping you avoid the classic mistakes of closing a trade too early or greedily holding on until it reverses.
The key extension levels that traders have on their radar are 127.2%, 161.8%, and 261.8%. These aren't just random numbers; they're derived from the same Golden Ratio math as retracements and act like powerful price magnets.
How to Apply the Fibonacci Extension Tool
Drawing extensions is a bit different from retracements. Instead of connecting two dots, you’ll be using three reference points to get a much more accurate projection. It’s a simple three-click process.
Here’s how you do it, which is incredibly easy with the tools in ChartsWatcher:
- Identify the Initial Move: First, find the main trend wave. This is the exact same "swing low" to "swing high" you’d use for a retracement.
- Locate the Pullback: Next, spot the end of the correction—the point where the price stopped dipping and started moving back in the direction of the trend.
- Plot the Three Points: In your charting tool, you’ll click three spots in this order:
- Point 1: The start of the trend (the swing low in an uptrend).
- Point 2: The peak of the trend (the swing high).
- Point 3: The bottom of the pullback (the retracement low).
Once you plot these three points, the tool automatically draws the extension levels on your chart. Just like that, you have a crystal-clear visual of potential profit zones.
Interpreting the Key Extension Levels
Each level gives you a clue about the trend's potential strength. Think of them as logical spots where traders who bought the dip might start selling to lock in profits, which naturally creates resistance.
Key Takeaway: Fibonacci extensions are all about looking forward. They project future resistance areas (in an uptrend) or support areas (in a downtrend) based on the psychology of the previous price swings.
Here’s a quick breakdown of what the most common levels tell you:
- 127.2% Extension: This is often the first stop. It's a conservative target and a very common place for the price to take a breather or pull back slightly.
- 161.8% Extension: This one is the "Golden Extension" for a reason—it’s arguably the most important level of all. A clean move to the 161.8% level tells you the trend is healthy and strong. It's a massively popular target for taking the bulk of your profits off the table.
- 261.8% Extension: Hitting this level means you're in an extremely powerful, high-momentum trend. While it's a less common target, you'll definitely see it in markets that are going parabolic.
Fibonacci extensions are all about projecting where price might go after breaking through a prior high or low. They're your go-to for setting profit targets, with common levels like 127.2%, 161.8%, 200%, and 261.8% being incredibly useful for traders riding strong trends. In volatile markets like crypto, these levels have been famously used to forecast price targets for assets like Bitcoin. The 161.8% extension, in particular, has a strong historical track record for predicting where price will react. You can learn more about these powerful targets over at thetradinganalyst.com.
By setting your take-profit orders around these key levels, you create a structured exit plan. It takes the emotion out of the game and helps you systematically capture your profits when the odds are stacked in your favor.
Building a Complete Fibonacci Trading Strategy
Fibonacci levels are fantastic for spotting potential turning points, but they're just one piece of the puzzle. Think of them as a map of the market's hidden structure. A map is useful, but it doesn't guarantee a successful journey. The real magic happens when you start combining that map with other tools. This is where the concept of confluence becomes your best friend.
Confluence is just a fancy word for seeing multiple, independent clues all pointing to the same conclusion. It's like a detective building a case—one clue is interesting, but three clues pointing to the same spot? That's where you focus your attention. By layering Fibonacci levels with other indicators, you turn a simple line on a chart into a high-probability zone for a trade.
Combining Fibonacci with Moving Averages for Trend Confirmation
Moving averages are the lifeblood of trend analysis. They smooth out the noise and give you a clean look at the market's underlying momentum. When a key Fibonacci level lines up perfectly with a major moving average, you've found a powerful point of interest.
Let's say a stock is in a solid uptrend, consistently bouncing off its 50-day moving average (50 DMA). After a nice run-up, the price starts to pull back. You draw your Fibonacci retracement levels and see the 61.8% level sitting right on top of that 50 DMA.
This is a textbook confluence setup. The moving average tells you the primary trend is still healthy, and the Fibonacci level signals a common area where pullbacks run out of steam. A trader seeing this would feel far more confident going long than if they saw either signal on its own.
Confluence is the art of seeing multiple, independent indicators all pointing to the same outcome. When your Fibonacci level, a key moving average, and a historical support zone all intersect at the same price, you have found a high-probability trading setup.
Using RSI to Spot Divergence and Exhaustion
The Relative Strength Index (RSI) is my go-to for gauging momentum. It tells me how fast and how far prices are moving, and it’s brilliant for spotting when a trend is getting tired and might be ready to reverse.
Pairing RSI with Fibonacci is a classic way to time your entries. Imagine a stock has been tanking hard and then starts a corrective rally. You draw your Fibs and notice the price is crawling up toward the 50% retracement level, a very common resistance point.
At the same time, you glance at your RSI and see it creeping above 70—the overbought zone. Even better, you might spot bearish divergence: the price makes a new high in the rally, but the RSI makes a lower high. That’s a massive red flag that the buying pressure is fading. A rejection at the 50% Fib level, confirmed by an overbought RSI and divergence, is a powerful signal to consider a short position.
Integrating Classic Support and Resistance Zones
The market has a long memory. Old support and resistance levels are psychological battlegrounds that traders watch like hawks. When a Fibonacci level aligns with one of these historic zones, its power is magnified.
For instance, a stock finally breaks through a stubborn resistance level at $100 and shoots up to $120. Then, it starts to pull back. When you draw your retracement levels from the breakout point, you see the 38.2% level lands right at the old $100 resistance. This is a classic "old resistance becomes new support" scenario.
The combination of a calculated Fib level and a proven historical price zone creates an incredibly strong floor to look for a bounce. This kind of multi-layered confirmation is a cornerstone of professional trading plans. If you want to dive deeper, you can find more advanced applications in these 8 powerful Fibonacci trading strategies for 2025.
Putting it all together, a complete strategy needs clear, non-negotiable rules. Here’s a simple framework to get you started:
- Identify the Trend: Is the market going up, down, or sideways? Use moving averages or simple price action.
- Draw Your Levels: Apply the Fibonacci tool to the last major price swing.
- Look for Confluence: Find at least one other reason to take the trade. Is there a moving average, RSI signal, or support/resistance zone nearby?
- Wait for a Signal: Don't jump in just because the price touches a level. Wait for confirmation, like a bullish or bearish candlestick pattern.
- Define Your Risk: Know where you're wrong. Set your stop-loss just on the other side of the confluence zone.
- Set Your Target: Use Fibonacci extension levels to map out logical profit targets.
Following a process like this helps you move from just drawing lines on a chart to executing a thoughtful, complete trading plan based on Fibonacci retracement and extension levels.
Putting Fibonacci Tools to Work on Real Charts
Theory is one thing, but making money happens on live charts. The real confidence comes when you move from simply understanding a concept to actually applying it in the heat of the moment. Think of this section as a hands-on workshop where we’ll walk through a few practical scenarios to see how Fibonacci retracement and extension levels perform in different market conditions.
We're going to break down the process step-by-step. This isn't about abstract ideas; it’s about building a repeatable process you can use to find solid trade setups and manage them like a pro.
A Step-by-Step Trading Example in an Uptrend
Let's start with a classic bullish scenario. Imagine a stock has been in a strong, obvious uptrend, consistently printing higher highs and higher lows. You missed the first big push, but you’re itching to find a safe entry on the next dip.
This is the perfect time to pull out your Fibonacci playbook. Here’s how you’d tackle it:
- Identify the Primary Trend: First things first, confirm the market's direction. The chart is clearly climbing, so we’re only looking for buy signals. No shorting allowed here.
- Draw the Retracement Levels: Find the most recent major price move. Pinpoint the "swing low" (where the move started) and the "swing high" (its peak). Using the Fibonacci tool in ChartsWatcher, you just click on that swing low and drag your cursor up to the swing high.
- Wait for a Confirmation Signal: Now, you play the waiting game. Watch as the price pulls back from its high. It drifts down, touches the 50% retracement level, and suddenly stalls out. Right at that key level, a bullish engulfing candlestick pattern forms. That’s your green light—a clear sign that buyers are jumping back in.
- Set Your Entry and Stop-Loss: With that confirmation signal, you enter a long position. To keep your risk in check, you place a stop-loss order just below the next key level—the 61.8% retracement. This gives the trade some breathing room without exposing you to a massive loss if things go south.
- Map Out Profit Targets: Finally, where do you get out? You switch to the Fibonacci extension tool to project potential exit points. By clicking the swing low, then the swing high, and finally the bottom of the pullback (your 50% entry point), you can map out your profit targets. The 127.2% and 161.8% extension levels become your primary and secondary take-profit zones.
This structured approach takes the emotion and guesswork out of the equation. You're left with a clear, logical plan based on observable market behavior.
The infographic below really hammers home this simple, yet powerful, three-step process for a standard Fibonacci trading strategy.
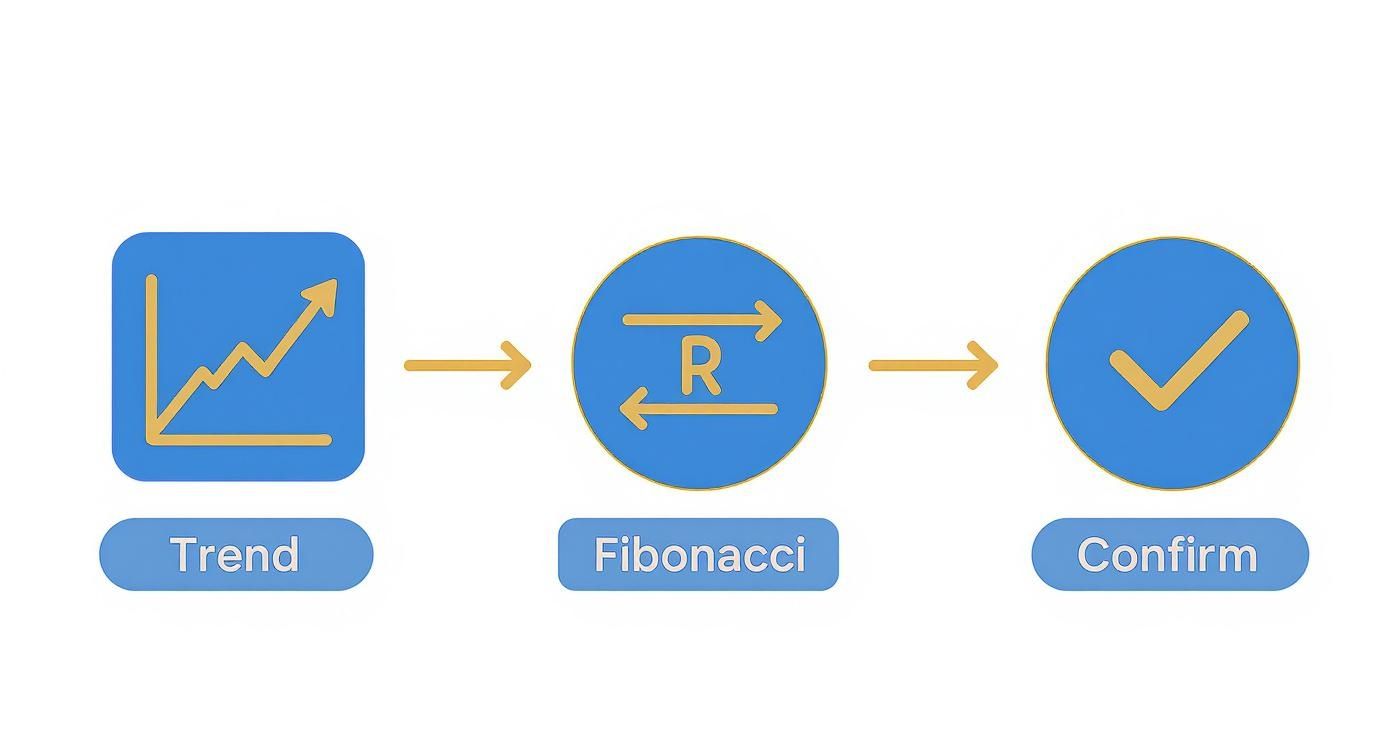
This visual guide reinforces the core workflow: find a trend, use the Fibonacci tool to pinpoint an entry, and wait for a clear confirmation signal before you pull the trigger.
Fibonacci Retracement vs Extension: A Strategic Comparison
It's easy to get these two tools mixed up, but they serve very different purposes in a trader's toolkit. Retracements are all about finding entry points within a trend, while extensions are about setting profit targets beyond the previous high or low. Understanding the difference is crucial for building a complete trading plan.
Here's a table to make the distinction crystal clear:
| Feature | Fibonacci Retracement | Fibonacci Extension |
|---|---|---|
| Primary Goal | Identify potential support/resistance levels for a pullback. Find a good entry point. | Project where the price might go next after a pullback. Set profit targets. |
| How to Draw | Connect a swing low to a swing high (uptrend) or a swing high to a swing low (downtrend). | Requires three points: swing low, swing high, and the end of the pullback. |
| Direction | Looks inside the initial price move. | Looks outside the initial price move. |
| Key Levels | 38.2%, 50%, 61.8% | 127.2%, 161.8%, 261.8% |
| Trader Question | "Where might this pullback stop so I can get in?" | "If my entry is good, where should I think about taking profits?" |
Think of them as two sides of the same coin. The retracement tool helps you get into the trade, and the extension tool helps you get out with a profit. You need both to execute a trade from start to finish.
Analyzing a Downtrend Scenario
Don't worry, the same logic works perfectly for downtrends—you just flip everything upside down. In a bearish market, you’re hunting for opportunities to sell short when the price temporarily rallies. The Fibonacci levels now act as potential resistance ceilings where sellers might regain control.
Let's say a stock is in a clear downtrend. You'd draw your Fibonacci tool from the most recent swing high down to the new swing low. As the price bounces back up, you’d watch for it to hit a key level like the 61.8% retracement and form a bearish candlestick pattern (like a shooting star or bearish engulfing).
That's your signal to enter a short position, with a stop-loss just above the swing high and profit targets set using the extension tool at the 127.2% and 161.8% levels below the recent low.
Key Insight: Whether the market is raging bull or growling bear, the psychology behind Fibonacci is the same. These levels represent probable areas of support or resistance where traders are likely to make decisions, often creating self-fulfilling reactions.
Navigating Choppy or Sideways Markets
So, what happens when the market isn't trending at all? In choppy or range-bound conditions, Fibonacci tools can still be useful, but you have to be much more careful. Instead of looking for trend continuation, you use them to map out the internal structure of the range.
- Define the Range: First, find the clear high and low that are boxing the price in.
- Draw the Retracements: Apply the Fibonacci tool from the range high down to the range low.
- Look for Reversals: The 38.2%, 50%, and 61.8% levels inside the range can often act as minor turning points. These can be good spots for quick, short-term scalps if you see price action confirming a reversal.
A word of caution, though: the highest-probability setups will always be in trending markets. When things are moving sideways, it’s often smarter to sit on your hands and wait for a clean breakout before deploying your main Fibonacci strategy.
By practicing these applications across different market conditions, you'll start to develop a sixth sense for how prices react to these key levels. That hands-on experience is what turns textbook knowledge into a real trading edge.
Common Questions About Using Fibonacci Levels
As traders start weaving Fibonacci retracement and extension levels into their analysis, a few questions pop up time and time again. This tool is incredibly powerful, but getting the hang of its nuances definitely takes some screen time. Let's tackle these common sticking points to help flatten that learning curve and build your confidence.
My goal here is to clear up the most frequent uncertainties traders run into, reinforcing the core concepts with practical answers you can take straight to your charts.
Do Fibonacci Levels Work on All Timeframes?
Yes, absolutely. One of the best things about Fibonacci analysis is that it works on any timeframe you throw at it, whether you're scalping on a 1-minute chart or planning long-term investments on a weekly. The market psychology behind trends and pullbacks is fractal, which is just a fancy way of saying the same patterns repeat on different scales.
That said, the significance of a level often grows with the timeframe. A bounce off the 61.8% retracement on a daily chart, for example, usually carries more weight and signals a bigger move than the same setup on a 5-minute chart. The principles don't change, but the magnitude of the reaction certainly can.
Which Fibonacci Level Is the Most Important?
While they all have their place, the 61.8% retracement level is widely seen as the big one. It's often called the "Golden Ratio" for a reason—it frequently acts as a make-or-break area of support or resistance. A strong, decisive reaction at the 61.8% level is often a high-probability sign that the original trend is about to kick back into gear.
After that, the 50% level (which isn't an official Fibonacci ratio but is critical nonetheless) and the 38.2% level are also extremely common zones where you'll see price react.
Trader's Insight: Pay close attention to the area between the 61.8% and 78.6% levels. Many traders call this the "Golden Pocket." It's a high-conviction zone where a lot of reversal signals pop up, as it often represents the last real line of defense for the existing trend.
What if the Price Ignores a Fibonacci Level?
This happens all the time, and it's just as important as a bounce. When the price slices right through a key Fibonacci level without even pausing for breath, it’s shouting something important about the market's strength. For instance, in an uptrend, if the price plummets through the 61.8% support level, that’s a huge red flag that the trend is in trouble and a full reversal might be on the table.
Think of Fibonacci levels not as brick walls, but as zones of high probability. A failure at a key level is a signal in itself. It tells you when to stay out of a trade or, just as importantly, when to cut a losing position and move on.
Are Fibonacci Retracements a Self-Fulfilling Prophecy?
You know what? To a large extent, they are. The sheer popularity of Fibonacci tools is a huge part of why they work so well. Millions of traders, from retail folks like us to the big institutional funds, are all watching the exact same levels on their charts.
When a massive wave of buy orders gets placed at a key retracement level like 50% or 61.8%, that collective action creates its own support. This shared psychology is what turns these mathematical ratios into practical, actionable zones where the market is likely to turn, reinforcing the tool’s validity.
Ready to put these powerful concepts to work on your own charts? ChartsWatcher provides an advanced suite of drawing tools, including perfectly calibrated Fibonacci retracement and extension indicators. Stop guessing and start mapping the market's hidden structure with precision. Explore the powerful features of ChartsWatcher today.
