8 Powerful Fibonacci Trading Strategies for 2025
The financial markets, often perceived as chaotic, are governed by hidden patterns and mathematical principles. At the heart of this market geometry lies the Fibonacci sequence, a series of numbers that appears throughout nature and, surprisingly, in the price charts of stocks, forex, and crypto. For traders, this isn't just a mathematical curiosity; it's a powerful and practical toolkit for decoding market sentiment and structure.
This comprehensive guide moves beyond basic theory to explore 8 proven Fibonacci trading strategies. We will provide actionable steps, real-world chart examples, and specific implementation instructions for each technique. Our focus is on turning these timeless ratios into a concrete trading edge, helping you identify high-probability entry points, set logical profit targets, and manage risk with greater precision.
You will learn to apply a diverse range of Fibonacci tools, from classic retracements and extensions to more advanced methods like harmonic patterns and confluence zones. We'll also highlight how modern platforms such as ChartsWatcher can streamline the application of these complex strategies, making sophisticated market analysis accessible to traders at every level. This article is your direct path to integrating one of technical analysis's most enduring concepts into your daily trading routine.
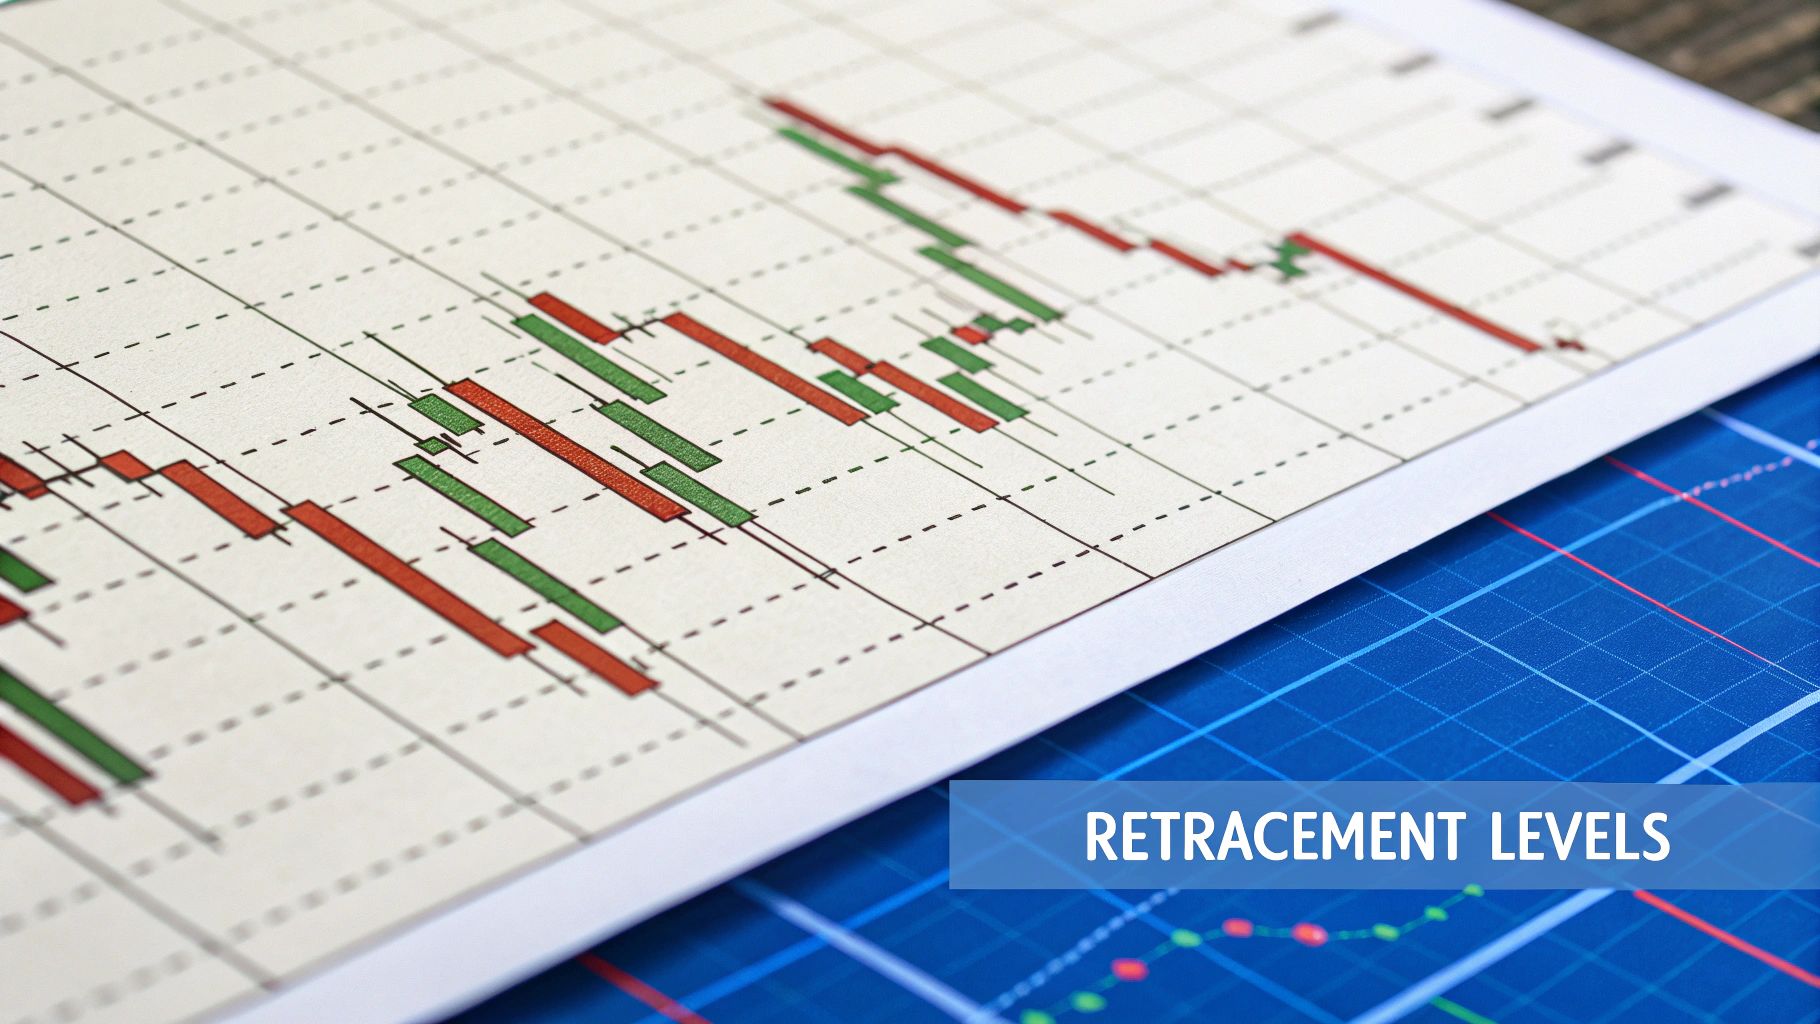
1. Fibonacci Retracement Trading
Fibonacci Retracement Trading is arguably the most fundamental and widely used of all Fibonacci trading strategies. It operates on the principle that after a significant price move in one direction, the market will "retrace" or pull back a predictable portion of that move before continuing in the original direction. This strategy uses horizontal lines plotted at key Fibonacci ratios to identify these potential reversal zones.
The core of this technique involves identifying a recent significant swing high and swing low on a chart. The Fibonacci retracement tool is then drawn between these two points, creating a grid of potential support or resistance levels at 23.6%, 38.2%, 50%, 61.8%, and 78.6%. Traders watch for the price to pull back to one of these levels, anticipating a bounce or rejection that signals a continuation of the primary trend.
How It Works in Practice
Imagine the price of EUR/USD has been in a strong uptrend, moving from 1.0500 to 1.1000. A trader would draw the Fibonacci tool from the 1.0500 swing low to the 1.1000 swing high. They would then watch for the price to pull back to levels like 1.0809 (38.2%) or 1.0750 (50%). An entry for a long position would be considered if the price shows signs of bouncing off one of these levels, such as forming a bullish candlestick pattern.
Actionable Tips for Implementation
- Focus on Key Levels: While all levels are relevant, the 38.2% and 61.8% retracements are often considered the most significant and reliable for finding high-probability entries.
- Seek Confirmation: Never enter a trade just because the price touches a Fibonacci level. Wait for confirmation from a candlestick pattern (like a hammer or engulfing candle) or a momentum indicator like the RSI showing an oversold condition.
- Combine with Market Structure: Fibonacci retracements are most powerful when they align with other technical elements, such as a previous support/resistance zone or a key moving average.
This foundational strategy is a crucial starting point for anyone exploring Fibonacci analysis. To explore this topic in greater detail, you can learn more about key Fibonacci retracement trading levels on chartswatcher.com.
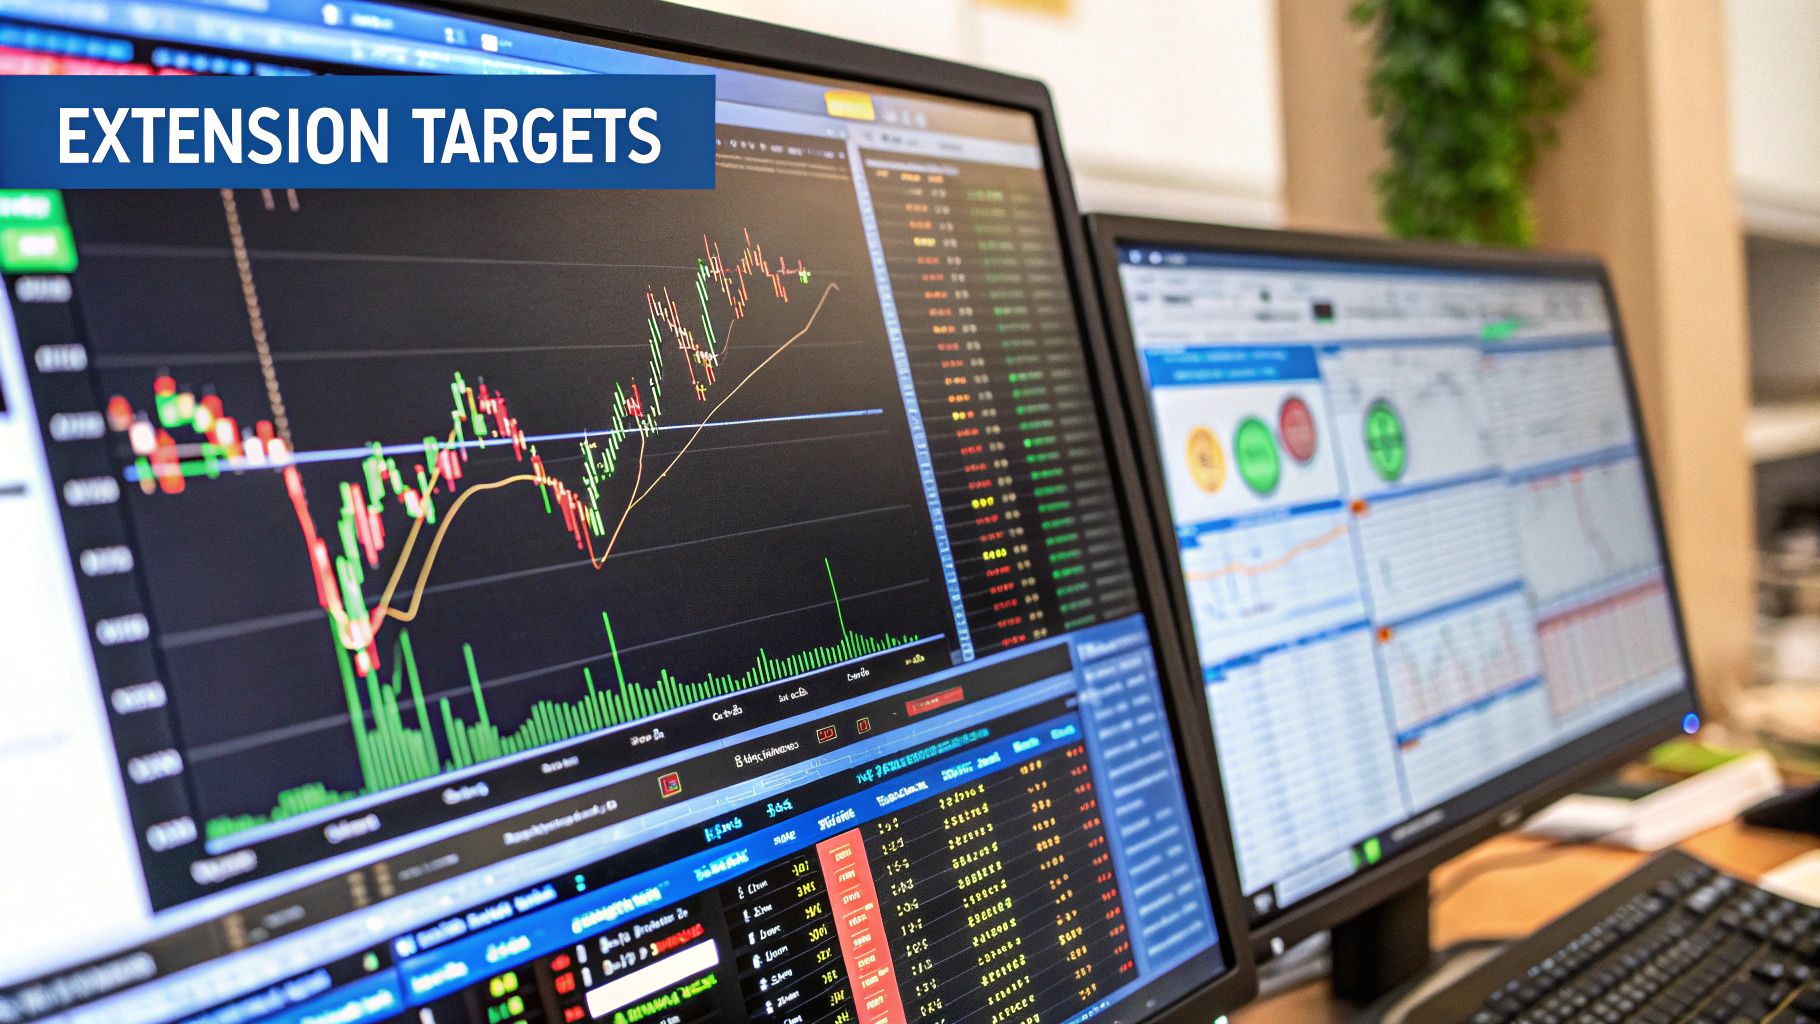
2. Fibonacci Extension Trading
Fibonacci Extension Trading is a proactive strategy used not to find entry points, but to project where the price might go next. While retracements identify potential pullbacks, extensions are used to set profit targets or gauge how far a price wave might travel after a retracement is complete. This technique is indispensable for managing trades and defining exit strategies in trending markets.
The strategy involves three key price points: the start of a trend move (Point A), the end of that move (Point B), and the end of the subsequent retracement (Point C). The Fibonacci extension tool then projects potential resistance or target levels based on this A-B-C structure, plotting key ratios like 127.2%, 161.8%, 200%, and 261.8% beyond the initial price swing. Traders use these projected levels to decide where to take profits.
How It Works in Practice
Consider GBP/JPY in an uptrend that moves from 180.00 to 184.00, then pulls back to 182.00. A trader would plot the extension from the 180.00 low (A), to the 184.00 high (B), and then from the 182.00 retracement low (C). This would project profit targets, with a common objective being the 161.8% extension level at 188.47. A trader in a long position would place a take-profit order near this level, anticipating the trend's momentum will stall there.
Actionable Tips for Implementation
- Combine with Retracements: Use Fibonacci retracements to identify your trade entry and Fibonacci extensions to define your exit. This creates a complete plan from start to finish.
- Scale Out Profits: Instead of closing an entire position at one level, consider taking partial profits at each key extension (e.g., 127.2%, 161.8%, and 200%). This approach locks in gains while allowing for the possibility of a larger trend move.
- Look for Confluence: Extension levels become significantly more powerful when they align with other forms of resistance, such as a major psychological round number, a pivot point, or a previous structural high.
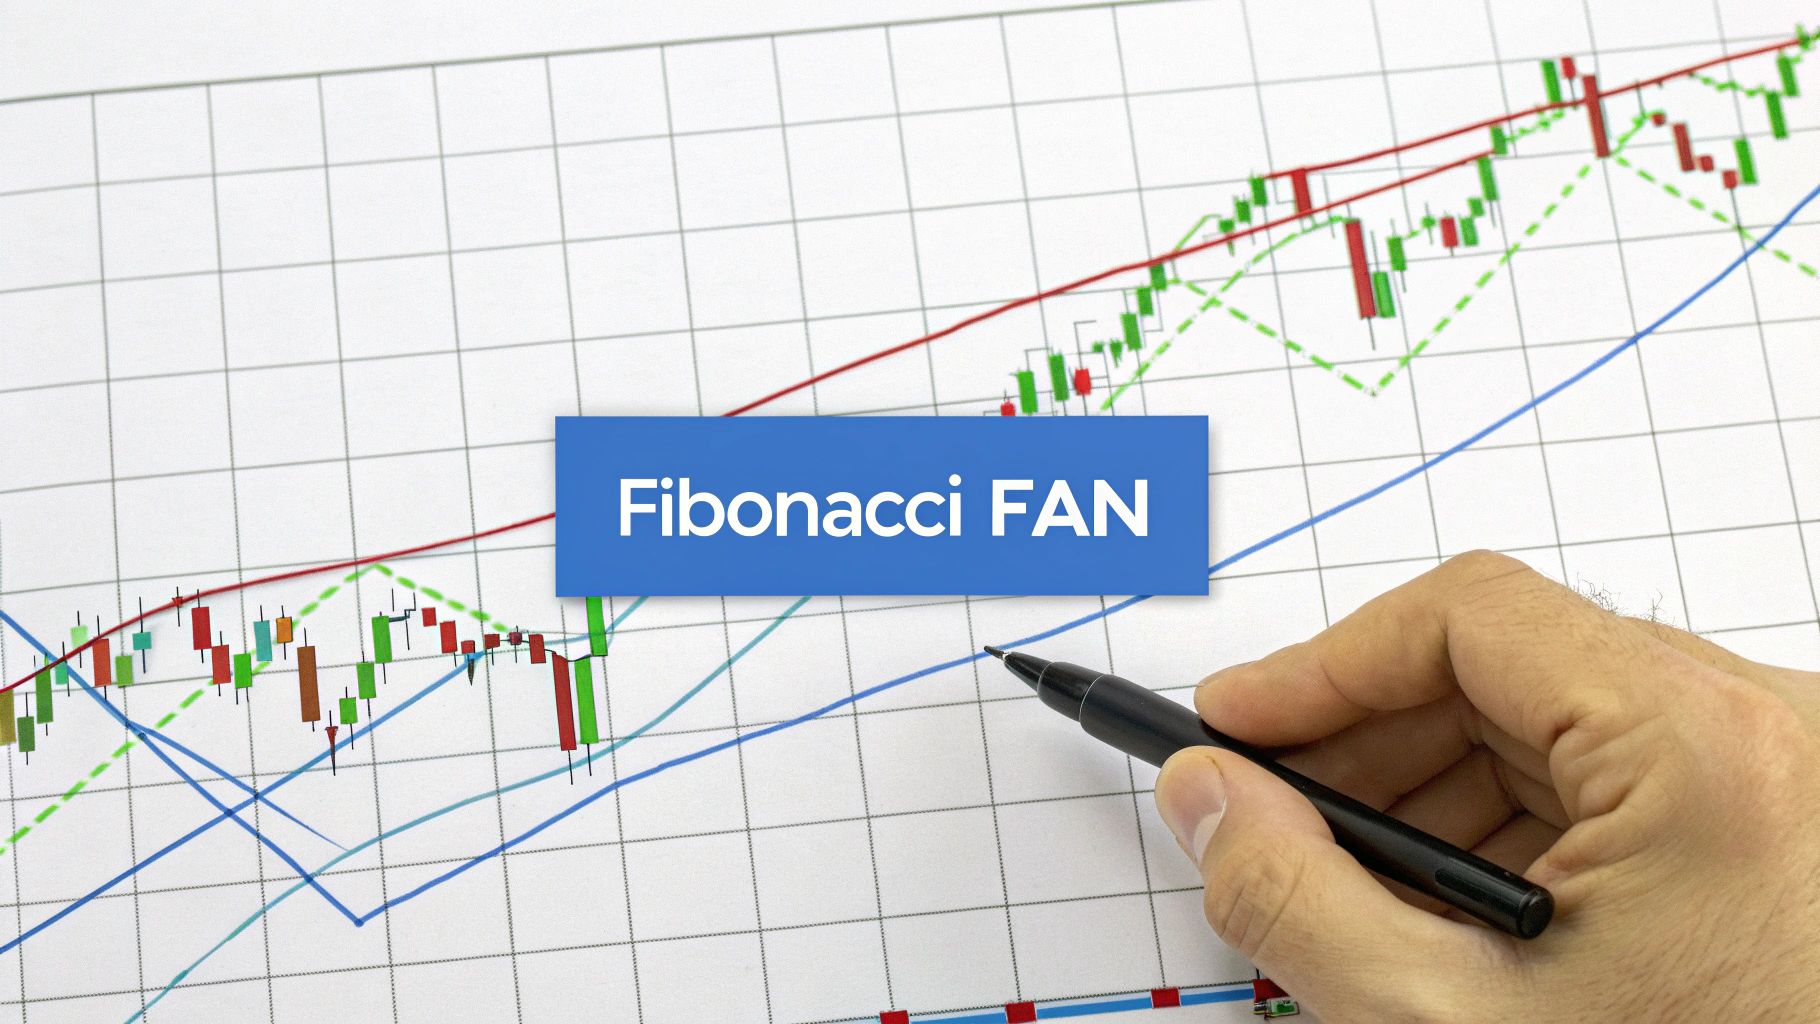
3. Fibonacci Fan Trading
Fibonacci Fan Trading offers a more dynamic approach compared to the static horizontal lines of retracement. This technical analysis tool uses diagonal lines drawn from a significant low or high point through key Fibonacci retracement levels (typically 38.2%, 50%, and 61.8%). The result is a series of "fan" lines that slope upwards or downwards, providing dynamic support and resistance levels that evolve with the market's price action over time.
The core principle is that these angled lines will act as potential support in an uptrend or resistance in a downtrend. Unlike horizontal levels, the fan lines adjust to the trend's momentum, offering relevant price targets and reversal zones as the market continues to move. This makes it a powerful tool for traders looking to identify entry and exit points within an established trend.
How It Works in Practice
Consider a stock like Amazon that has just made a major swing high and begins to correct downwards. A trader would identify the preceding swing low and the recent swing high, then draw the Fibonacci retracement levels between these points. From the swing low, they would then draw three trendlines that pass through the 38.2%, 50%, and 61.8% retracement levels. As the price pulls back, these diagonal fan lines serve as potential support. A bounce off the 50% fan line, for example, could signal an excellent opportunity to enter a long position.
Actionable Tips for Implementation
- Draw from Significant Swings: The accuracy of the fan depends heavily on the anchor points. Always draw from a major, confirmed swing high or swing low to create the most relevant support and resistance lines.
- Focus on the Middle Line: The 50% fan line is often considered the most significant. A price holding above it suggests a strong trend, while a break below it can signal a potential trend reversal.
- Wait for Confirmation: A price touching a fan line is not a signal by itself. Look for confirmation from a clear bounce or rejection, often accompanied by a bullish or bearish candlestick pattern and increased volume.
- Combine with Trend Analysis: This is one of the Fibonacci trading strategies that works best when used to complement broader trend analysis. Use it in markets with a clear directional bias rather than in sideways or ranging markets.
4. Fibonacci Time Zones Trading
Fibonacci Time Zones Trading shifts the focus from price to the horizontal axis of time. This unique approach applies the Fibonacci sequence to time intervals, creating a series of vertical lines on the chart that project potential future dates for significant market events, such as reversals, trend changes, or periods of high volatility. Unlike price-based tools, this strategy helps traders anticipate when a major move might occur.
The strategy involves selecting a significant starting point, like a major swing high or low, and then plotting vertical lines at future time intervals corresponding to the Fibonacci sequence: 1, 2, 3, 5, 8, 13, 21, 34, 55, and so on. These lines act as time-based markers, highlighting periods where the market is statistically more likely to experience a shift in momentum or direction. It is a powerful concept within the broader world of Fibonacci trading strategies.
How It Works in Practice
Suppose a major market bottom for a stock was established on a specific date. A trader would apply the Fibonacci Time Zones tool starting from that date. Vertical lines would then appear on the chart at 5, 8, 13, 21, and 34 trading days (or weeks, depending on the timeframe) after that initial low. The trader would then pay close attention to the price action as it approaches these future time zones, watching for signs of a potential trend reversal or a significant price acceleration.
Actionable Tips for Implementation
- Start from Major Events: The accuracy of this tool heavily depends on the starting point. Always begin your count from a significant, undeniable market event like a major peak, trough, or a high-impact news release.
- Use Higher Timeframes: Fibonacci time analysis tends to be more reliable on daily, weekly, and monthly charts. Short-term noise on intraday charts can make the zones less effective.
- Combine with Price Analysis: Time zones are most powerful when they align with a key price-based Fibonacci level (retracement or extension) or a major support/resistance zone. This confluence of time and price creates a high-probability setup.
- Patience is Paramount: This is not a high-frequency trading strategy. It requires discipline and patience, as you may be waiting for days or weeks for the price to reach a projected time zone.
5. ABC Fibonacci Correction Trading
ABC Fibonacci Correction Trading is a sophisticated strategy that merges Elliott Wave Theory with Fibonacci ratios to pinpoint the end of a market correction. It operates on the principle that corrective phases within a larger trend unfold in a predictable three-wave pattern, labeled A-B-C. This method uses Fibonacci relationships to project the termination point of the final wave (Wave C), offering a high-probability entry for resuming the primary trend.
The core of this technique lies in identifying a three-wave pullback against the prevailing trend. Traders measure the initial corrective leg (Wave A), then look for Wave B to retrace a Fibonacci percentage of Wave A (often 50% or 61.8%). Finally, they project the length of Wave C using a Fibonacci extension of Wave A, with common targets being 100%, 127.2%, or 161.8%. This provides a specific price zone where the correction is likely to end.
How It Works in Practice
Imagine Gold is in a major uptrend but begins a pullback. The first leg down (Wave A) moves $50. The price then rallies in a corrective Wave B, retracing to the 61.8% level of Wave A. A trader would then project from the end of Wave B to find the target for Wave C. A common projection is 100% of Wave A, meaning Wave C would also be a $50 move down. The trader anticipates the correction to complete around this calculated level and prepares to enter a long position.
Actionable Tips for Implementation
- Confirm Wave B: Patiently wait for Wave B to complete its retracement before projecting targets for Wave C. A premature projection can lead to inaccurate entry zones.
- Look for Momentum Divergence: As price approaches a projected Wave C completion zone, look for bullish momentum divergence on an oscillator like the RSI or MACD. This confirms that the downward momentum is weakening and a reversal is imminent.
- Combine with Trend Analysis: This strategy is most effective when used to trade with the dominant trend on a higher timeframe. Use it to find entry points within established uptrends or downtrends, not to pick major market tops or bottoms.
This pattern-based approach is one of the more advanced Fibonacci trading strategies, offering a structured way to navigate market corrections. To delve deeper into similar harmonic patterns, you can explore this expert guide to trading the ABCD pattern on chartswatcher.com.
6. Fibonacci Confluence Trading
Fibonacci Confluence Trading is a powerful, advanced strategy that elevates the reliability of standard Fibonacci analysis. The technique focuses on identifying price zones where multiple Fibonacci levels, derived from different price swings and tools, converge. This convergence creates a powerful "confluence zone," a high-probability area where the price is likely to react, acting as exceptionally strong support or resistance.
This approach combines various Fibonacci tools, such as retracements, extensions, and projections, often across multiple timeframes. The core idea is that if a single Fibonacci level can provide a potential trade signal, a cluster of several levels in a tight price range significantly strengthens that signal. It's one of the most robust fibonacci trading strategies because it relies on the alignment of multiple, independent technical factors.
The following infographic illustrates the core components that combine to form a high-probability confluence zone.
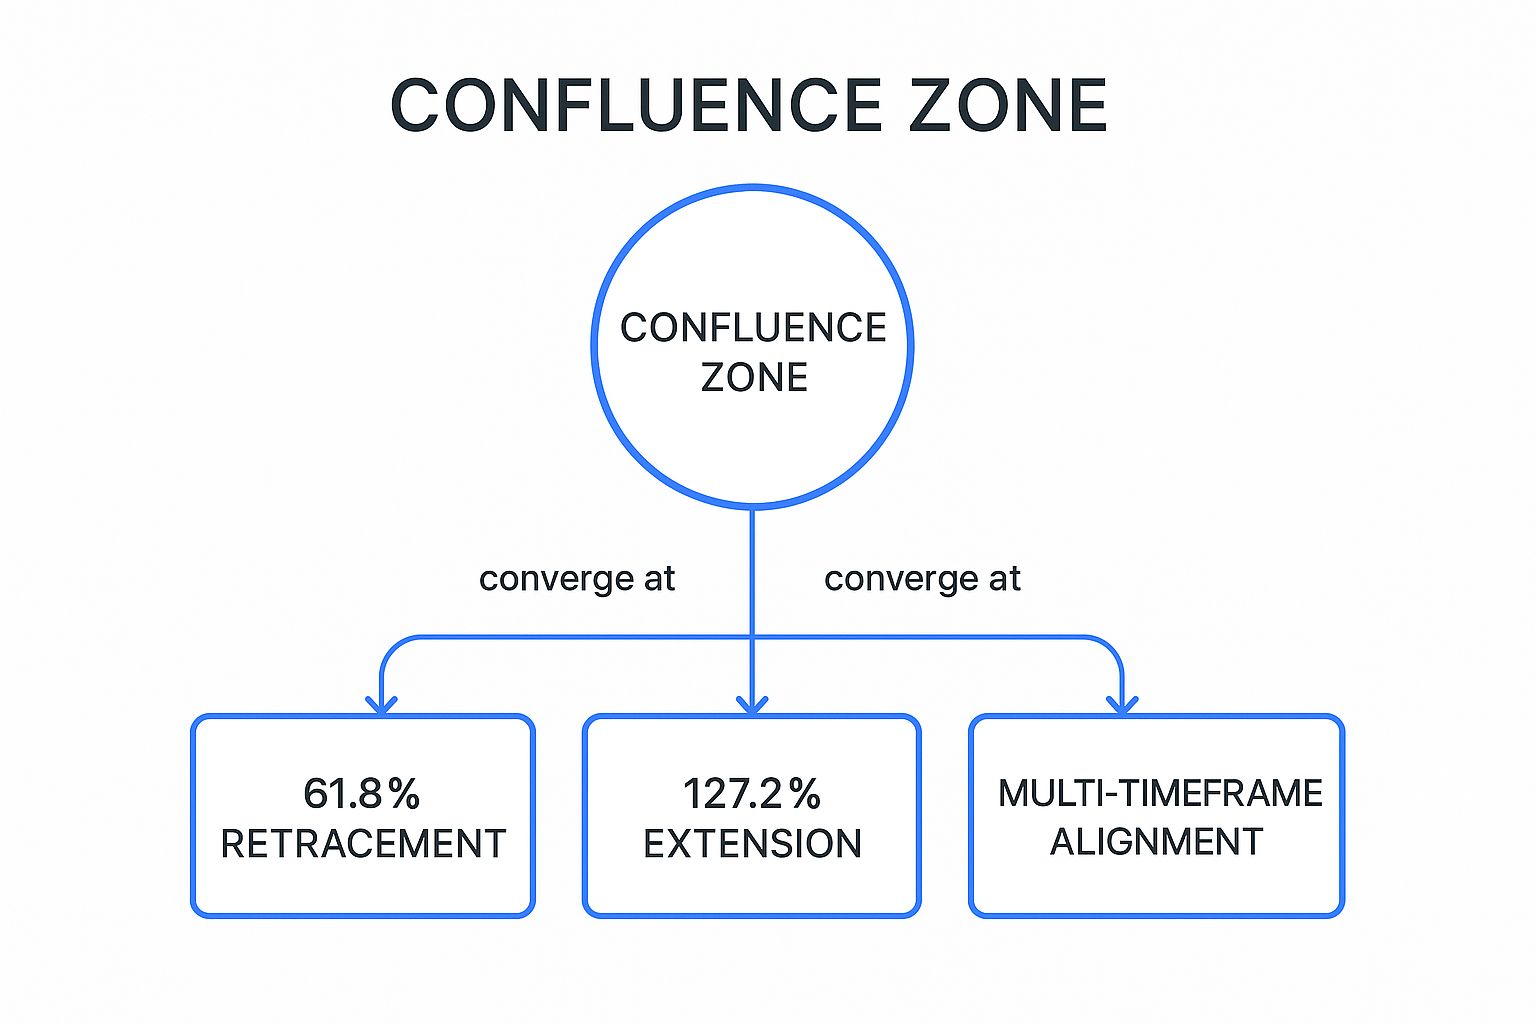
This concept map highlights how the convergence of a key retracement level, a price extension, and multi-timeframe alignment creates a reinforced trading area.
How It Works in Practice
Imagine the S&P 500 has completed a major rally and begins to pull back. A trader might identify a 61.8% retracement level from the most recent swing. Simultaneously, by analyzing a previous, smaller price swing, they might find a 127.2% extension level that lands in the exact same area. If this zone also aligns with the 38.2% retracement on a weekly chart, this "triple confluence" becomes a prime area to look for a bullish reversal.
Actionable Tips for Implementation
- Seek Triple Confirmation: For the highest probability setups, look for at least three distinct Fibonacci levels converging within a tight price range, ideally 10-20 pips for forex or a small percentage for stocks.
- Combine with Market Structure: Confluence zones that align with significant market structure, such as a major round number (e.g., 1.3000 on GBP/USD) or a previous support/resistance level, are exponentially more powerful.
- Use Multiple Timeframes: Identify key Fibonacci levels on daily and weekly charts first. Then, look for confluence with levels on shorter timeframes like the 4-hour or 1-hour chart to pinpoint precise entry zones.
- Wait for Price Action: Never enter a trade just because the price enters a confluence zone. Always wait for a clear price action signal, like a strong engulfing candle or pin bar, to confirm the market's reaction.
7. Fibonacci Channel Trading
Fibonacci Channel Trading is a dynamic trend-following strategy that adapts Fibonacci ratios to a channel format. Unlike static horizontal levels, this technique uses parallel lines drawn at key Fibonacci percentages from a base trend line to create a channel system. This provides a framework for identifying support and resistance levels within the context of a moving, trending market.
The core of this method involves drawing a base trend line connecting at least two significant swing highs or swing lows. The Fibonacci channel tool then projects parallel lines at ratios like 38.2%, 61.8%, 100%, and 161.8% from this base. These channels act as potential price boundaries, offering multiple entry points for trend-following trades and helping traders gauge the strength and potential acceleration of a trend.
How It Works in Practice
Consider the NASDAQ in a strong uptrend. A trader would draw the base trend line connecting two key swing lows. The Fibonacci channel tool would then project ascending parallel lines above it. The trader would look to enter long positions as the price pulls back and bounces off the 38.2% or 61.8% channel lines, treating them as dynamic support. A break above the 100% or 161.8% channel line could signal a powerful acceleration in the trend.
Actionable Tips for Implementation
- Establish a Valid Base: The initial trend line is critical. Ensure it connects at least two, preferably three, significant swing points to establish a valid directional bias.
- Trade with the Trend: Use the channel lines to enter trades in the direction of the overall trend. For an ascending channel, buy at support (lower lines); for a descending channel, sell at resistance (upper lines).
- Monitor for Channel Breaks: A decisive break outside the channel can be a powerful signal. A break above the upper boundary in an uptrend suggests acceleration, while a break below the lower boundary can indicate a potential trend reversal.
- Combine with Momentum: Use a momentum indicator like the MACD or RSI to confirm the strength of a bounce off a channel line. For example, a bullish divergence on the RSI as price tests a lower channel line adds confidence to a long entry.
8. Harmonic Fibonacci Patterns Trading
Harmonic Fibonacci Patterns Trading is one of the more advanced and visually intricate Fibonacci trading strategies, popularized by authors like Scott Carney. This method identifies geometric price patterns that adhere to specific Fibonacci ratio alignments, which are believed to signal potential price reversals with a high degree of accuracy. These patterns, such as the Gartley, Butterfly, Bat, and Crab, provide precise entry points, stop-loss levels, and profit targets.
The core of this strategy involves identifying specific swing points on a chart (labeled X, A, B, C, and D) and measuring the price legs between them. For a pattern to be valid, the ratios between these price swings must conform to the strict Fibonacci rules defined for that specific harmonic pattern. When a pattern completes at point D, it identifies a "Potential Reversal Zone" (PRZ) where traders anticipate the price direction to change.
How It Works in Practice
Imagine a trader identifies a potential Bullish Gartley pattern forming on the EUR/USD chart. They would first identify the initial impulse leg (XA). The first retracement (AB) should be near the 61.8% level of XA. The next leg (BC) should retrace between 38.2% and 88.6% of the AB leg. The final and most critical leg (CD) completes the pattern when it reaches the 78.6% retracement of the initial XA leg. A trader would look to enter a long position near this completion point (D), expecting a bullish reversal.
Actionable Tips for Implementation
- Focus on One or Two Patterns: To avoid confusion, start by mastering the recognition and rules for just one or two patterns, such as the Gartley or the Bat, before moving on to more complex variations.
- Validate Every Ratio: Do not assume a pattern is valid just because it looks right. Use Fibonacci tools to measure each leg and confirm that all ratio requirements are met. Invalid ratios often lead to failed patterns.
- Wait for Price Action Confirmation: A harmonic pattern only identifies a potential reversal zone. Wait for a confirmation signal within the PRZ, like a bullish engulfing candle or a doji, before entering a trade to improve your win rate.
Fibonacci Trading Strategies: Key Feature Comparison
| Strategy | Implementation Complexity 🔄 | Resource Requirements 💡 | Expected Outcomes ⭐📊 | Ideal Use Cases 💡 | Key Advantages ⭐⚡ |
|---|---|---|---|---|---|
| Fibonacci Retracement Trading | Low - Easy to understand and apply | Basic charting tools; works on all timeframes | Identifies support/resistance and entry points 📊 | Trending markets across forex, stocks, crypto, commodities | Clear risk levels; widely used - self-fulfilling; simple and reliable |
| Fibonacci Extension Trading | Moderate - Requires accurate swing points | Charting software with extension plotting | Provides objective profit targets ⭐ | Setting profit targets in trending up/down markets | Maximizes profits; reduces emotional decisions; complements retracements |
| Fibonacci Fan Trading | Moderate to High - Diagonal lines require skill 🔄 | More experience needed; trend/time analysis | Dynamic support/resistance adapting over time | Trend continuation, breakout strategies on 4H to weekly charts | Adapts to market shifts; combines trend and Fibonacci ratios |
| Fibonacci Time Zones Trading | High - Unique time-based application 🔄 | Patience and longer-term perspective needed | Timing of reversals and trend changes ⚡ | Swing & position trading; market cycle & event timing | Adds time dimension; identifies cyclical behavior; complements price tools |
| ABC Fibonacci Correction Trading | Moderate - Pattern recognition required 🔄 | Understanding Elliott Wave & Fibonacci patterns | High probability counter-trend corrections ⭐ | Trading corrective waves for trend continuation in major markets | Clear entry/exit with risk-reward; combines multiple analysis forms |
| Fibonacci Confluence Trading | High - Complex multi-level analysis 🔄 | Advanced charting with multi-timeframe capability | High-probability zones with reduced false signals ⭐📊 | Advanced traders targeting "sweet spot" zones | Strong confirmation; reduces whipsaws; adaptable strategy |
| Fibonacci Channel Trading | Moderate - Drawing parallel channels 🔄 | Trend line identification and channel drawing tools | Identifies trend strength and exhaustion ⚡ | Trend-following in currencies, commodities, growth stocks | Multiple entries; clear trend signals; position management aid |
| Harmonic Fibonacci Patterns Trading | Very High - Complex geometric pattern detection 🔄 | Specialized harmonic pattern software/tools | Highly precise reversal points with strong risk-reward ⭐ | Advanced traders in all markets and timeframes | Extremely accurate entries/exits; high win rate when identified correctly |
Integrating Fibonacci Strategies into Your Trading System
The journey through the world of Fibonacci trading strategies reveals a powerful truth: the market, while often appearing chaotic, frequently moves in patterns that align with these natural mathematical ratios. From the fundamental entry and exit points identified by Fibonacci Retracements and Extensions to the more complex predictive models of Harmonic Patterns, each strategy offers a unique lens through which to analyze price action. We've explored how tools like the Fibonacci Fan and Fibonacci Channel can define dynamic support and resistance, while Time Zones add a crucial temporal dimension to your analysis.
The true mastery of these techniques, however, does not lie in using any single one in isolation. The most robust and reliable trading systems are built on the principle of confluence, a concept we directly addressed with the Fibonacci Confluence Trading strategy. Imagine a scenario where a 61.8% retracement level perfectly aligns with a key support level from a Fibonacci Channel and a 1.618 extension target from a previous move. This convergence of signals provides a much higher probability setup than any single indicator could on its own.
Key Takeaways for Practical Application
To transform these concepts from theory into a cornerstone of your trading plan, focus on these critical action points:
- Start Small and Specialize: Do not try to master all eight Fibonacci trading strategies at once. Select one or two that resonate with your trading style, perhaps starting with retracements and extensions, and learn their nuances inside and out.
- Context is Everything: Remember that Fibonacci tools are most effective in trending markets. Applying a retracement strategy in a sideways, range-bound market is a recipe for false signals and frustration. Always confirm the broader market trend before plotting your levels.
- Confirmation is Non-Negotiable: A Fibonacci level is merely an area of interest, not an automatic buy or sell signal. Always wait for price action confirmation. This could be a bullish engulfing candle at a support level or a bearish pin bar at a resistance level. Combine this with other indicators like the Relative Strength Index (RSI) or moving averages to validate your thesis.
Building a Cohesive Fibonacci System
Your goal should be to weave these powerful mathematical tools into a holistic trading system grounded in discipline and rigorous risk management. This involves more than just drawing lines on a chart; it requires a structured approach. Define your entry rules, establish clear profit targets (often using Fibonacci extension levels), and, most importantly, determine your stop-loss placement before ever entering a trade.
Backtesting is your most valuable ally in this process. Use historical data to test how your chosen Fibonacci strategy would have performed under various market conditions. This practice builds confidence and helps you refine your rules, turning a reactive approach into a proactive, data-driven methodology. By consistently applying these principles, you elevate Fibonacci from a simple indicator to a comprehensive framework for identifying, executing, and managing high-probability trades.
Ready to stop manually searching for these powerful setups and start automating your analysis? ChartsWatcher provides an advanced suite of scanning and screening tools designed to instantly identify the Fibonacci trading strategies discussed in this guide across thousands of stocks. Sign up for ChartsWatcher today and let our technology find the perfect Fibonacci confluence opportunities for you.
