Master ABCD Pattern Trading Strategies | Boost Your Profits
Understanding The ABCD Pattern Trading Foundation
The ABCD pattern is a popular tool in trading, prized for its relative simplicity and potential to identify high-probability trades. Grounded in natural market movements, this pattern offers valuable insights for traders of all skill levels. But what makes it so effective? The key lies in understanding its components and their interplay.
Deconstructing the ABCD Pattern
The ABCD pattern is defined by four points: A, B, C, and D. These represent swing highs and lows in price action, creating a distinct pattern that can signal potential reversals or continuations. Point A initiates the pattern, leading to a move to point B. The following retracement to point C sets up the final move to point D, completing the pattern.
Each point is critical, contributing to the pattern's predictive ability. The relationship between points B and C, for example, often hints at the potential depth of the retracement.
Why Natural Market Movements Matter
The ABCD pattern's strength lies in its reflection of organic market rhythms. Markets rarely move linearly. Instead, they fluctuate between impulsive moves and corrective pullbacks. The ABCD pattern captures these swings, offering a framework for understanding potential turning points.
This ability to identify possible reversals lets traders anticipate momentum shifts and position themselves strategically. These patterns appear across various timeframes, making them adaptable tools for both short-term and long-term traders. Learn more in our article about How to analyze stock charts.
Spotting Genuine ABCD Patterns
While the ABCD pattern's basic structure is straightforward, differentiating real patterns from false signals demands careful observation and analysis. Successful traders often combine the ABCD pattern with other technical indicators, like TradingView for charting, to confirm its validity. This might involve analyzing volume patterns, momentum indicators, and price action across multiple timeframes.
Understanding the overall market trend context is also vital. An ABCD pattern within a strong uptrend may have different implications than one during consolidation. The ABCD pattern is a recognized harmonic pattern, especially useful in day trading for spotting intraday chart patterns. Discover more insights about ABCD Pattern trading.
Applying the ABCD Pattern in Practice
The ABCD pattern is a versatile tool applicable across various markets and timeframes. By recognizing market swings and retracements, traders can use the ABCD pattern to pinpoint potential entry and exit points. Combining this pattern with other technical analysis tools enhances its predictive power, leading to more informed decisions. You might be interested in: How to master technical analysis patterns.
Mastering the ABCD pattern isn't just about identifying the four points. It's about understanding the market dynamics they represent, using that knowledge to navigate the complexities of trading.
The Fibonacci Connection In ABCD Pattern Trading
ABCD pattern trading relies heavily on Fibonacci ratios to pinpoint precise entry and exit points. These ratios, derived from the Fibonacci sequence, help traders distinguish genuine ABCD patterns from random market fluctuations.
This mathematical precision is what elevates ABCD pattern trading from guesswork to a potentially profitable strategy.
Understanding Fibonacci Retracement Levels
Fibonacci retracement levels represent specific percentages derived from the Fibonacci sequence. These levels, commonly 38.2%, 50%, and 61.8%, often act as support and resistance zones where price reversals occur. In ABCD pattern trading, these levels are crucial for validating pattern formations and predicting potential price movements.
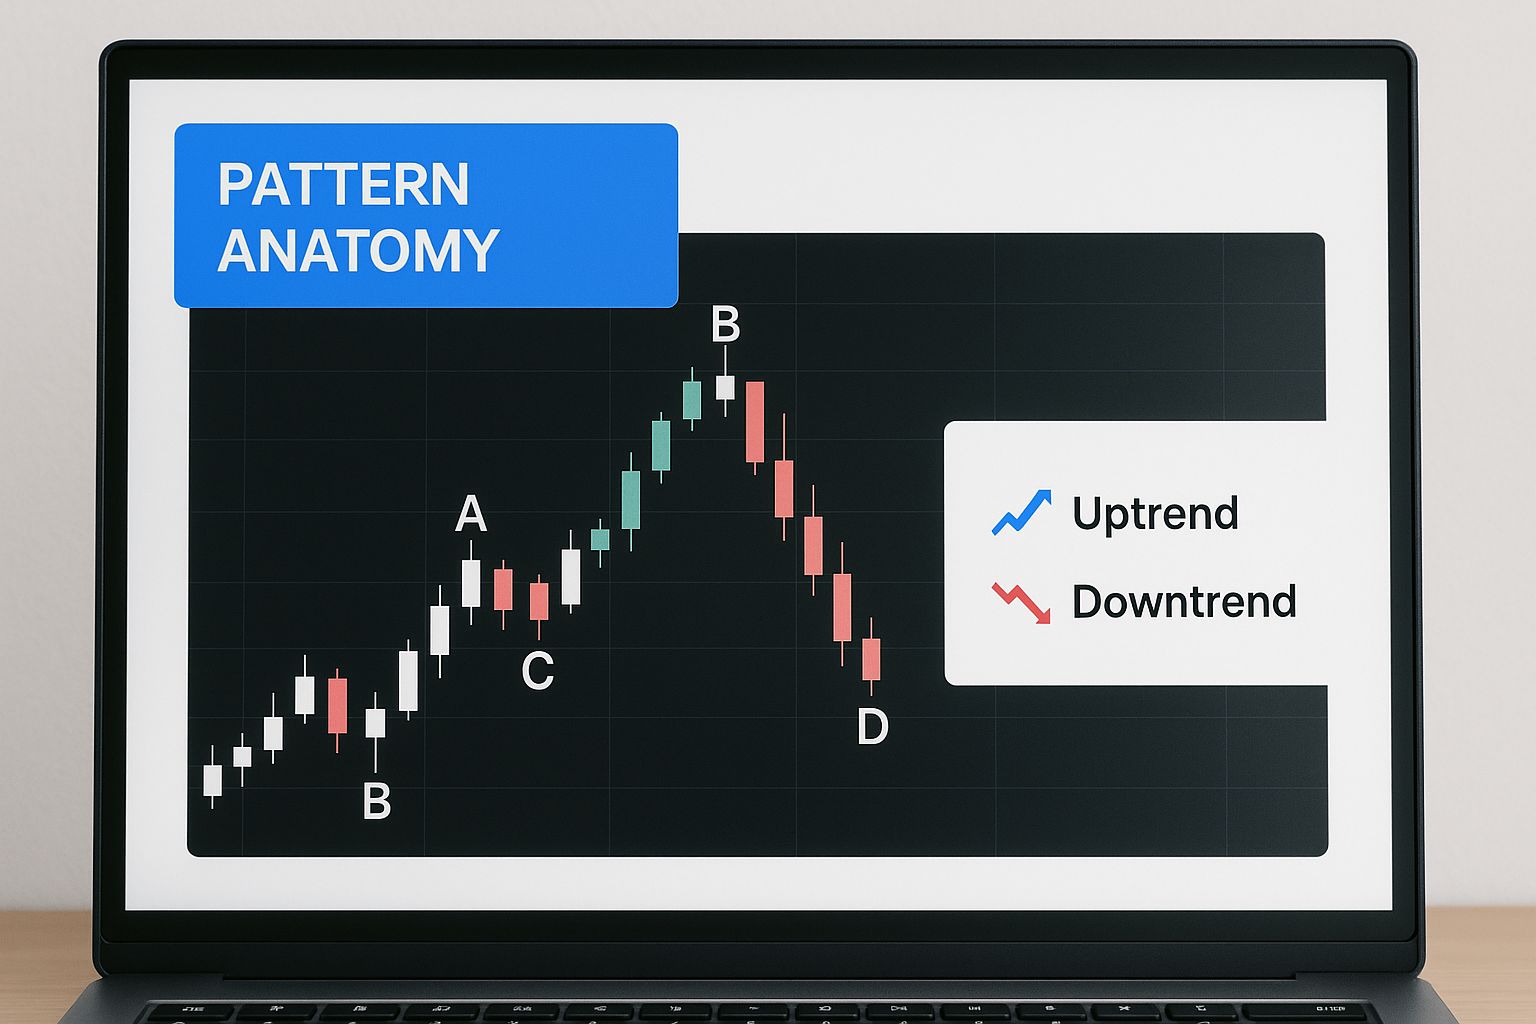
This infographic illustrates an ABCD pattern on a candlestick chart, labeling points A, B, C, and D. The visualization shows how these points correspond to swing highs and lows, creating the ABCD structure. Accurate identification of these points is essential for proper pattern recognition.
Applying Fibonacci Ratios to ABCD Patterns
In a bullish ABCD pattern, the retracement from point B to point C ideally aligns with the 61.8% Fibonacci retracement level of the initial AB leg. The CD leg should be an extension of the BC leg, typically measuring 1.272 or 1.618 times the length of BC.
These specific ratios suggest a high probability of the pattern completing at point D. For a bearish ABCD pattern, these principles apply inversely. The time it takes for the CD leg to form should also roughly equal the time taken for the AB leg, further confirming the pattern's validity.
To understand how these ratios work in practice, let's look at a table summarizing the key Fibonacci levels used in ABCD pattern validation.
Key Fibonacci Ratios for ABCD Pattern Validation
| Fibonacci Level | Pattern Segment | Validation Strength | Typical Success Rate |
|---|---|---|---|
| 61.8% | B to C Retracement (Bullish) / A to B Retracement (Bearish) | Strong | 70-80% |
| 38.2% | B to C Retracement (Bullish) / A to B Retracement (Bearish) | Moderate | 50-60% |
| 127.2% | C to D Extension (Bullish) / B to A Extension (Bearish) | Strong | 70-80% |
| 161.8% | C to D Extension (Bullish) / B to A Extension (Bearish) | Moderate | 60-70% |
This table highlights the importance of the 61.8% and 127.2% Fibonacci levels in confirming the validity and strength of ABCD patterns. While not foolproof, aligning with these levels historically increases the pattern's success rate. The success rates presented are estimates and can vary based on market conditions and other factors. Learn more about ABCD patterns and Fibonacci ratios.
Using Multiple Fibonacci Tools
Advanced ABCD pattern traders often combine multiple Fibonacci tools, such as Fibonacci fans and arcs, with their analysis. These tools add further confirmation and help fine-tune entry and exit points. The convergence of a Fibonacci fan line with a key retracement level, for example, can pinpoint a strong potential reversal zone.
This combined approach enhances the trader's ability to identify high-probability opportunities.
Practical Application in Live Trading
Applying Fibonacci ratios in live trading becomes more efficient with practice. ChartsWatcher’s customizable dashboards allow traders to quickly measure and analyze Fibonacci relationships within ABCD patterns. This rapid application enhances decision-making in fast-moving markets.
By integrating Fibonacci tools into your workflow, you can potentially improve your pattern recognition and profitability with ABCD pattern trading. This technique can be effectively applied using tools like ChartsWatcher.
ABCD Pattern Trading Across Different Markets
The effectiveness of ABCD pattern trading varies across different markets. Each market has unique characteristics that influence how these patterns develop and their reliability. A successful strategy for stocks might not work well in forex, commodities, or cryptocurrencies.
ABCD Patterns in Stock Markets
Stock markets are known for their diverse instruments and varying volatility. While ABCD patterns occur, their reliability depends on the specific stock and overall market conditions. Blue-chip stocks, known for stability, tend to show clearer ABCD patterns than volatile growth stocks. This allows traders to identify potential entry and exit points with greater confidence in established companies. Trading hours and news events also significantly impact stock market patterns.
ABCD Patterns in Forex
The forex market operates 24 hours a day, 5 days a week, creating continuous price action. This constant activity presents both opportunities and challenges. The high liquidity and volatility can generate numerous ABCD setups, but also increase false signals. Experienced traders can capitalize on rapid price movements by focusing on major currency pairs and combining ABCD patterns with other technical indicators, like those found in TradingView. This helps filter out noise and identify stronger trading signals.
ABCD Patterns in Commodities
Commodity markets are influenced by supply and demand, geopolitical events, and seasonality. These external factors can create unique price patterns. Agricultural commodities, for example, might exhibit distinct ABCD patterns during harvest seasons due to supply shifts. Understanding these market-specific dynamics is crucial for successful commodity trading using ABCD patterns. The ABCD pattern helps identify trend reversals, which is crucial for capitalizing on market sentiment shifts. Learn more about the ABCD pattern.
ABCD Patterns in Cryptocurrency
The cryptocurrency market is known for extreme volatility and 24/7 trading activity. ABCD patterns can form quickly but also become invalidated rapidly. The lack of regulation and the influence of social media can lead to unpredictable price swings. Traders should exercise caution and combine ABCD analysis with other indicators like volume and momentum.
Market-Specific Optimization Techniques
Professional traders often adapt their ABCD strategies to the specific market. This might involve adjusting Fibonacci ratios, using different confirmation indicators, or incorporating timeframe analysis. For instance, a trader might use tighter stop-loss orders in the volatile cryptocurrency market compared to the relatively stable stock market. This tailored approach improves the effectiveness of ABCD pattern trading.

This image shows how a trader might visualize and analyze an ABCD pattern on a chart. Using tools like ChartsWatcher, traders can customize dashboards to display relevant indicators alongside the price chart, aiding in pattern identification and validation. The platform's features, such as multiple screen configurations and real-time data updates, further enhance a trader's ability to implement ABCD pattern trading strategies effectively across different markets. By understanding the nuances of each market and applying tailored strategies, traders can increase their chances of success with ABCD pattern trading.
Advanced Entry And Exit Strategies For ABCD Patterns

Identifying an ABCD pattern is just the first step. Precise entry and exit strategies are essential for maximizing profits and minimizing losses when trading these patterns. This is where skillful execution becomes critical for consistent success.
Aggressive Vs. Conservative Entry Strategies
Aggressive entries involve entering a trade as soon as a potential D point appears, often before complete confirmation. This approach maximizes potential profits but comes with increased risk. Experienced traders may use this tactic when other indicators strongly suggest confirmation. Using machine learning to analyze market data can enhance the timing of your entries and exits.
Conservative entries prioritize confirmation. Traders wait for the D point to be fully formed and validated by other indicators or price action. This approach reduces risk but may limit profit potential due to a less optimal entry point.
Advanced Validation Techniques
Professional traders often use advanced validation techniques to fine-tune their entries.
- Volume Confirmation: Strong volume during the CD leg adds further conviction to the move, increasing confidence in the pattern.
- Momentum Indicators: Tools such as the Relative Strength Index (RSI) and the Moving Average Convergence Divergence (MACD) can help identify overbought or oversold conditions, potentially confirming reversal points.
- Multiple Timeframe Analysis: Examining the ABCD pattern on longer timeframes can provide valuable context and confirm the pattern's validity on your chosen trading timeframe.
Sophisticated Exit Strategies
Exit strategies are as critical as entries, significantly impacting overall profitability. Several effective techniques help traders secure profits while managing risk:
- Trailing Stops: These dynamic stop-loss orders move with the price as it moves favorably, locking in profits and allowing the trade to continue.
- Target Pyramiding: This method involves taking partial profits at predetermined price targets, reducing risk and securing gains as the price progresses toward the final target.
- Partial Profit Taking: Similar to target pyramiding, this technique secures profits at specified technical levels or Fibonacci extension levels.
Optimizing Risk-Reward Ratios
Successful ABCD pattern trading hinges on optimizing the risk-reward ratio. This involves targeting trades where the potential profit significantly outweighs the potential loss. Combining sophisticated entry and exit strategies allows traders to achieve better risk-reward ratios, leading to increased long-term profitability. Adapting to shifting market conditions is key, and professional traders constantly refine their methods.
Combining ABCD Patterns With Technical Indicators
The ABCD pattern, a versatile tool in technical analysis, becomes even stronger when combined with other indicators. These added indicators act as a filter for false signals, providing extra validation to enhance your trading choices. Let's delve into how these tools work together to refine ABCD pattern trading.
Choosing the Right Indicators
Several technical indicators work well with ABCD patterns. For example, moving averages help traders confirm the current trend direction and spot potential support and resistance areas. The Relative Strength Index (RSI) is useful for measuring momentum and identifying overbought or oversold conditions. This can help pinpoint reversal points within the ABCD pattern. The Moving Average Convergence Divergence (MACD) provides a deeper look into momentum and possible trend shifts, offering further confirmation. Finally, volume indicators confirm the strength of price movements within the pattern. For example, high volume during the CD leg often signals strong conviction in the move.
Avoiding Analysis Paralysis
While using multiple indicators can be helpful, it's important to avoid analysis paralysis. Overloading your charts with too many indicators can lead to conflicting signals and complicate your decision-making process. It's generally better to focus on a few key indicators that work well together and suit your specific trading style. A combination of a moving average, RSI, and volume can give you a balanced perspective of price action, momentum, and trend confirmation.
Practical Applications of Indicators With ABCD Patterns
Here’s how you can apply these indicators to your ABCD pattern trading:
-
Moving Averages: A 200-day moving average helps to confirm the overall trend. Price action above the 200-day MA suggests a bullish environment, which favors bullish ABCD patterns.
-
RSI: Watch for RSI divergences. If the price reaches a higher high while the RSI forms a lower high, it might signal a weakening trend and a possible reversal, especially near the D point of a bearish ABCD pattern.
-
MACD: A MACD crossover above the signal line during the CD leg formation can confirm bullish momentum in a bullish ABCD pattern.
-
Volume: Look for rising volume during the CD leg to validate the strength of the price movement. Falling volume might mean weakening momentum and a possible false signal.
To better understand how these indicators strengthen ABCD pattern identification, let’s take a look at the following table:
Best Technical Indicators for ABCD Pattern Confirmation Comparison of popular technical indicators and their effectiveness when combined with ABCD patterns
| Indicator | Confirmation Type | Best Timeframe | Success Rate Improvement (Estimated) |
|---|---|---|---|
| Moving Averages | Trend Confirmation | All | 10-15% |
| RSI | Overbought/Oversold | All | 15-20% |
| MACD | Momentum Confirmation | All | 10-15% |
| Volume Indicator | Strength of Move | All | 5-10% |
The table above shows the benefits of using these indicators alongside ABCD patterns. Note that the "Success Rate Improvement" is an estimated range based on general observations. The real impact varies based on market conditions and your personal trading strategy. Using platforms like ChartsWatcher can improve your analysis by providing real-time data and customizable dashboards.
Advanced Multi-Indicator Setups
Experienced traders often use a combination of indicators to improve their ABCD pattern trading accuracy. They might look for patterns where the D point aligns with a 61.8% Fibonacci retracement level, accompanied by an oversold RSI and a MACD crossover above the signal line. This confluence of factors significantly boosts the probability of a winning trade.
For more detailed strategies, you can check out our guide on How to master technical analysis patterns. ChartsWatcher’s customizable dashboards make it easy to visualize these indicators alongside ABCD patterns, simplifying your analysis and trade execution.
Indicator Confluence and Trading Opportunities
The real strength of combining indicators with ABCD patterns comes from indicator confluence. When several indicators point to the same conclusion, it creates high-probability trading opportunities. This confluence takes already strong ABCD setups and makes them exceptional, allowing traders to execute with greater confidence.
Key Takeaways For ABCD Pattern Trading Success
Mastering ABCD pattern trading involves more than just connecting four points on a chart. It requires a blend of technical analysis, strategic thinking, and disciplined execution. This section distills key insights from professional traders, offering a practical roadmap to successful ABCD pattern trading.
Understanding the ABCD Pattern's Power
The ABCD pattern, in its simplicity, mirrors the natural market rhythms of impulse waves and corrective waves. It provides a powerful framework for identifying potential trend reversals or continuations. However, distinguishing genuine ABCD patterns from market noise requires careful observation and confirmation. For example, incorporating volume analysis and momentum indicators, like the Relative Strength Index (RSI), alongside Fibonacci ratios improves pattern validation and increases the likelihood of finding high-probability setups. Understanding the broader market context, such as the prevailing trend, is also essential for accurate interpretation.
Fibonacci Ratios: The Key to Precision
Fibonacci ratios form the foundation of ABCD pattern trading. These mathematical relationships, commonly 61.8% and 127.2%, enhance the pattern's predictive power. Mastering these ratios helps pinpoint optimal entry and exit points, improving the chances of capturing profitable price swings. For instance, a 61.8% retracement for the BC leg often signals a potential reversal zone. Combining multiple Fibonacci tools, like fans and arcs, can further refine entry and exit points.
Market Specificity: Adapting Your Approach
The effectiveness of ABCD patterns can vary across different markets. Stock markets, with their inherent diversity and volatility, present unique challenges and opportunities. Forex, with its 24/5 operation and high liquidity, demands specific strategies. Similarly, commodities and cryptocurrencies possess distinct dynamics that influence pattern formation. Therefore, adapting your ABCD strategy to the specific market—adjusting Fibonacci ratios or incorporating market-specific indicators—is critical for consistent success. To further enhance your strategies, exploring different attribution models can offer valuable insights into how various factors contribute to market outcomes.
Advanced Techniques for Consistent Results
Entry and exit strategies are just as crucial as pattern recognition. Aggressive entries, suitable for experienced traders, maximize profit potential but carry increased risk. Conservative entries prioritize confirmation, offering greater safety but potentially limiting profits. Advanced validation techniques, using volume, momentum indicators, and multiple timeframe analysis, strengthen pattern confirmation. Sophisticated exit strategies like trailing stops and partial profit-taking enhance risk management and maximize profit potential.
Checklists, Frameworks, and Tracking Methods
Professional ABCD pattern traders use structured processes to improve their performance.
- Develop a checklist for validating patterns, including confirmation from Fibonacci ratios, volume, and momentum indicators.
- Implement a robust risk management framework with clear stop-loss orders and profit targets.
- Diligently track your trading performance, analyzing your win rate, average profit, and loss to identify areas for improvement.
This disciplined approach builds confidence and optimizes your trading strategy over time.
Ready to enhance your trading analysis? Explore the advanced charting features of ChartsWatcher!
