Master Technical Analysis Patterns for Better Trading
Decoding the Charts: Essential Technical Analysis Patterns
This listicle provides eight essential technical analysis patterns for traders of all levels. Learn to identify these formations on stock charts to anticipate price movements and improve your trading strategies. Understanding technical analysis patterns provides a framework for interpreting market behavior and developing informed decisions, whether you're a day trader or long-term investor. We'll cover Head and Shoulders, Double Tops and Bottoms, Cup and Handle, Bullish and Bearish Flags, Ascending, Descending, and Symmetrical Triangles, and Rounding Bottoms and Tops. Mastering these core technical analysis patterns offers a significant edge in the markets.
1. Head and Shoulders Pattern
The Head and Shoulders pattern is a prominent technical analysis pattern known for its reliability in predicting trend reversals. It earns its place at the top of this list due to its clear structure, measurable price targets, and applicability across various markets and timeframes. This pattern signals a bearish reversal in an uptrend and consists of three peaks, resembling a head and two shoulders. The middle peak, the "head," is the highest, while the two flanking peaks, the "shoulders," are lower and roughly equal in height. A "neckline" is drawn by connecting the lowest points of the two troughs formed between the head and shoulders. The pattern is completed when the price decisively breaks below this neckline after the formation of the right shoulder. Conversely, an inverse Head and Shoulders pattern, formed in a downtrend, signals a bullish reversal.
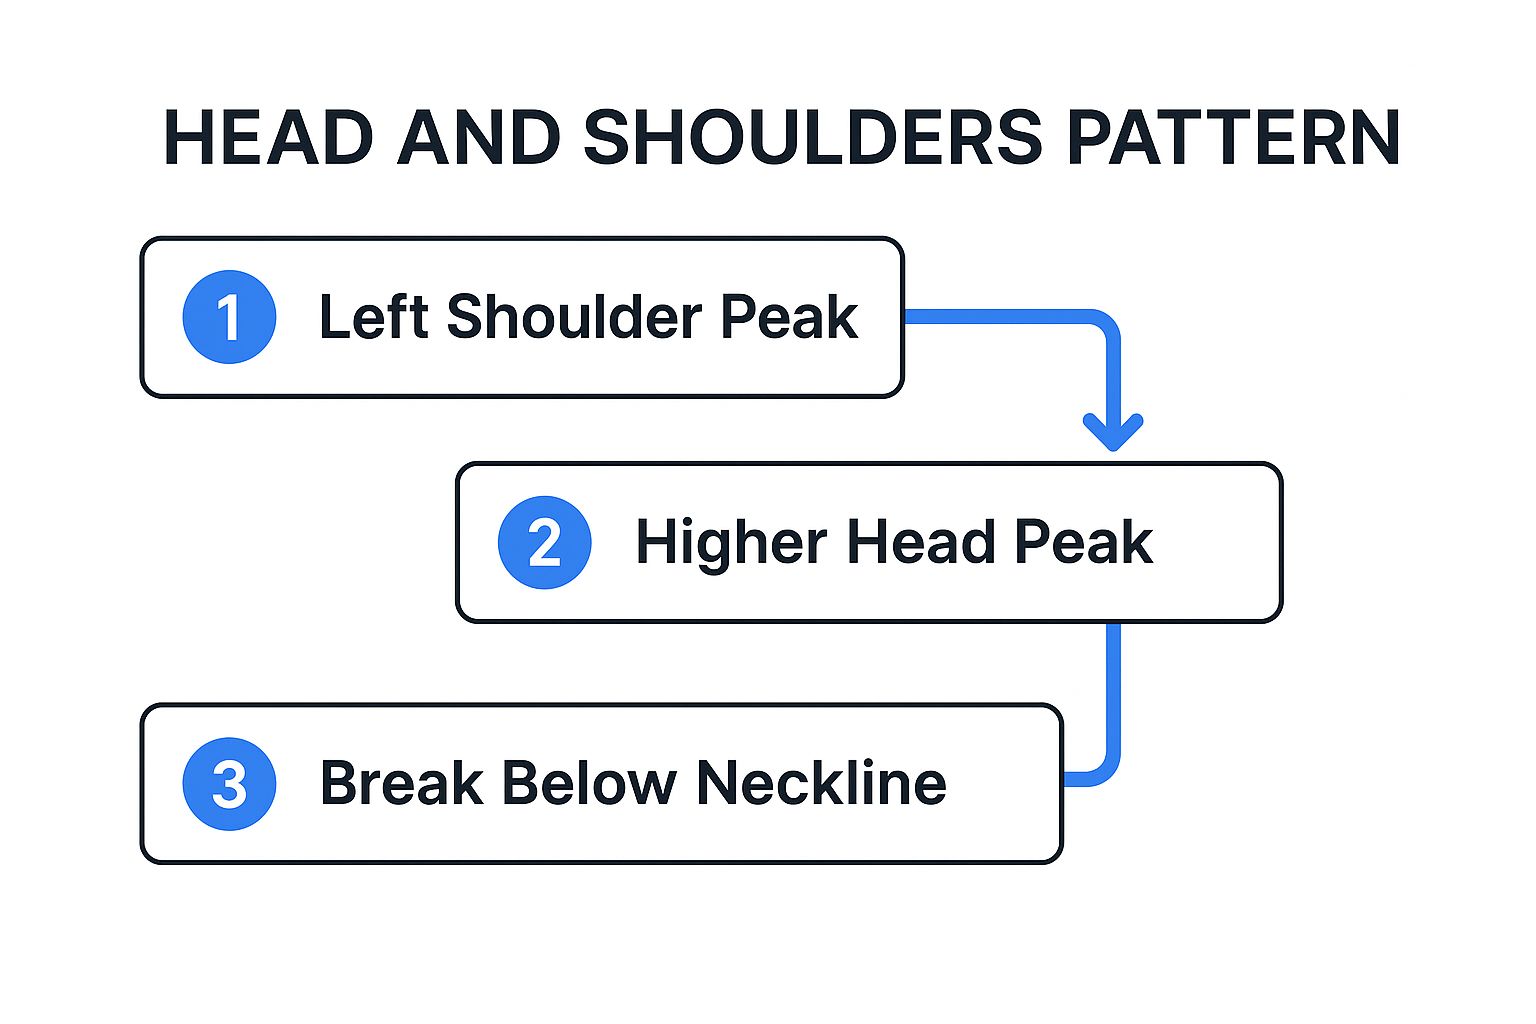
The infographic visualizes the step-by-step formation of a Head and Shoulders pattern, starting with the left shoulder's ascent, followed by a decline to the neckline, the formation of the head, another decline, the rise of the right shoulder, and finally the crucial breakdown below the neckline, confirming the bearish reversal. This sequence highlights the importance of waiting for the neckline break before acting on the pattern. The measured move, projecting the distance from the head to the neckline downwards from the breakout point, provides a potential price target for the ensuing decline.
The Head and Shoulders pattern is further characterized by diminishing trading volume during the formation of the head and shoulders, often followed by a surge in volume on the breakout below the neckline. This volume confirmation strengthens the signal's validity.
Identifying and Trading the Head and Shoulders Pattern:
The following process outlines how to identify and trade a Head and Shoulders pattern:
- Identify the Left Shoulder: Look for a peak in an uptrend, followed by a retracement.
- Identify the Head: The price rallies to a new high (higher than the left shoulder) and then declines again.
- Identify the Right Shoulder: The price rallies once more, but fails to reach the head's high, forming the right shoulder.
- Draw the Neckline: Connect the lows formed between the left shoulder and head, and the head and right shoulder.
- Confirmation: Wait for the price to break below the neckline with increased volume. This confirms the pattern and signals a potential entry point for a short position.
- Price Target: Project the distance from the head to the neckline downwards from the breakout point to estimate the potential price target.
- Stop-Loss: Place a stop-loss order above the high of the right shoulder to limit potential losses.
Examples of the Head and Shoulders Pattern in Action:
Several historical examples demonstrate the pattern's effectiveness. Bitcoin's major Head and Shoulders top in 2021 preceded a significant correction. Conversely, Apple formed an inverse Head and Shoulders pattern in March 2020, signaling the beginning of a major bull run. The S&P 500 also displayed a Head and Shoulders formation before the 2008 financial crisis. These examples highlight the pattern's relevance across diverse asset classes.
Pros:
- High reliability: When properly identified, it offers a high probability of a successful trade.
- Clear entry and exit points: The neckline breakout provides a clear entry point, while the measured move offers a potential price target. Stop-loss placement is also well-defined.
- Versatile application: The pattern works across multiple timeframes and various markets.
Cons:
- Time-consuming formation: Can take weeks or even months to form fully, especially on larger timeframes.
- False breakouts: Volatile markets can lead to false breakouts, triggering premature entries.
- Subjectivity: Identifying the pattern can be subjective, leading to interpretation errors.
Tips for Using the Head and Shoulders Pattern:
- Confirmation is key: Always wait for a confirmed neckline break with increased volume before entering a trade.
- Volume analysis: Use volume analysis to confirm the validity of the pattern.
- Stop-loss orders: Place stop-loss orders above the right shoulder high for short positions (or below the right shoulder low for inverse Head and Shoulders patterns).
- Combine with other indicators: Look for divergence in oscillators like RSI or MACD to strengthen the signal.
The Head and Shoulders pattern’s enduring popularity stems from the work of Edwards and Magee, who featured it in their seminal book "Technical Analysis of Stock Trends." Thomas Bulkowski further cemented its status through statistical analysis in his "Encyclopedia of Chart Patterns." This pattern remains a staple in the technical analyst's toolkit, offering valuable insights into potential market reversals.
2. Double Top and Double Bottom
Double Top and Double Bottom patterns are highly effective technical analysis patterns used to predict potential trend reversals in various financial markets. These patterns are valuable tools for professional traders, stock market analysts, financial institutions, independent investors, stock trading educators, and anyone utilizing stock scanners or screeners for day trading or long-term investing. Their relative simplicity and clear signals make them a staple in technical analysis. They deserve a prominent place in any list of technical analysis patterns due to their prevalence, ease of identification, and potential for profitable trading opportunities.
How They Work:
These patterns are visually striking and represent shifts in supply and demand. A Double Top, resembling the letter "M," forms after an extended uptrend. The price reaches a peak, retraces slightly, then rallies to a second peak approximately at the same level as the first. This indicates that buying pressure is weakening as the price fails to break through the previous high. The inability to create a new high suggests increased selling pressure, potentially leading to a downtrend.
Conversely, a Double Bottom, resembling the letter "W," occurs after a downtrend. The price falls to a low, rallies moderately, then declines to a second low roughly equal to the first. This shows increasing buying pressure as the price refuses to fall further. The inability to create a new low suggests increased buying pressure, signaling a potential uptrend reversal.
Key Features:
- Two Peaks/Troughs: Two comparable peaks (Double Top) or troughs (Double Bottom) at roughly the same price level.
- Intermediate Reaction: A moderate decline (Double Top) or rally (Double Bottom) between the two extremes.
- Neckline: A confirmation line drawn horizontally connecting the reaction high (Double Top) or low (Double Bottom) between the two peaks/troughs.
- Breakout: The pattern completes and is confirmed when the price breaks decisively through the neckline.
Pros:
- Easy Identification: Relatively easy to spot compared to more complex patterns.
- Clear Entry and Exit Points: Provides clear entry points upon neckline breakout and stop-loss levels just above/below the neckline.
- Versatile Applicability: Works effectively across different timeframes (intraday, daily, weekly) and various markets (stocks, forex, commodities).
- Measurable Price Targets: Price targets can be projected by measuring the distance between the peaks/troughs and the neckline and extending that distance from the breakout point.
Cons:
- False Signals: Can generate false signals in ranging or highly volatile markets where price fluctuations may create the appearance of a Double Top/Bottom without a true trend reversal.
- Imperfect Peaks/Troughs: The second peak/trough might not reach precisely the same level as the first, leading to ambiguity.
- Confirmation Delay: Requires patience to wait for the neckline break before entering a position.
- Statistical Reliability: Some studies suggest lower reliability compared to Head and Shoulders patterns.
Examples:
- Facebook (Meta): Formed a Double Bottom in late 2018 before a significant rally in 2019.
- Gold: Formed a Double Top in August 2020 before a downward correction.
- EUR/USD: Formed a Double Bottom in 2017, preceding a major uptrend.
Actionable Tips:
- Volume Confirmation: Look for decreasing volume on the second peak of a Double Top and increasing volume on the second trough of a Double Bottom for stronger confirmation.
- Neckline Break: Wait for a decisive price break through the neckline before entering a trade.
- Price Targets: Set profit targets by projecting the height of the pattern from the breakout point.
- Oscillator Divergence: Use oscillators like RSI or MACD to identify potential divergence between price and momentum, which can strengthen the signal.
Popularized By:
The concept of Double Tops and Bottoms can be traced back to early market theory writings by Charles Dow. John Murphy's "Technical Analysis of the Financial Markets" further solidified their understanding and application. Steve Nison also incorporated these patterns into candlestick analysis, expanding their use within technical trading strategies.
3. Cup and Handle Pattern
The Cup and Handle pattern is a bullish continuation technical analysis pattern that suggests a pause in an upward trend before the trend resumes with renewed vigor. It earns its name from its resemblance to a teacup with a handle. This pattern, a favorite among technical traders, signals a period of consolidation (the cup) followed by a slight pullback (the handle) before a potential breakout. This consolidation allows the stock to gather strength before making its next upward move. The pattern typically unfolds over 1-6 months for the cup and 1-4 weeks for the handle, offering a compelling setup for traders seeking well-defined entry and exit points.

The Cup and Handle pattern holds a prominent place amongst technical analysis patterns due to its strong reliability, especially in bull markets. It offers traders clear entry points, defined risk parameters (using the handle's low as a stop-loss), and the potential for significant price appreciation upon breakout confirmation. This pattern is especially effective when analyzing stocks, but its applications extend to other financial instruments as well. The Cup and Handle's efficacy on both daily and weekly charts makes it versatile for both short-term and long-term traders.
Specifically, the cup should ideally form a "U" shape, with relatively equal highs on both sides of the rounded bottom. The handle, a smaller downward drift, should retrace approximately 1/3 to 1/2 of the cup's right-hand side and should ideally form in the upper half of the cup. The pattern is deemed complete when the price decisively breaks above the handle's resistance, signaling a potential entry point.
While the Cup and Handle can be a powerful predictor of upward price movements, it does have limitations. The pattern takes time to fully develop, which can sometimes be a drawback for traders seeking quicker entries. Identifying the pattern in its early stages can be challenging, and there's always a risk of the pattern failing if broader market conditions deteriorate during its formation. Furthermore, the handle can occasionally evolve into a more complex correction, potentially confusing the pattern.
Despite these challenges, the Cup and Handle remains a favored tool for professional traders, stock market analysts, and individual investors alike. Examples of successful implementations include Amazon's cup and handle formation in 2016 preceding a significant breakout, Bitcoin's weekly chart formation between 2018-2020 before its bull run, and Tesla’s multiple cup and handle patterns during its 2020 rally.
To effectively utilize the Cup and Handle pattern, seasoned traders recommend watching for decreasing volume during the cup formation and a surge in volume during the breakout. An ideal cup depth falls between 12% and 33% from peak to bottom. Entering the trade when the price breaks above the handle's resistance with increased volume is considered optimal. Price targets can be estimated by measuring the distance from the cup's bottom to the breakout level and projecting that distance upwards from the breakout point. For a more in-depth analysis and trading tips, you can Learn more about Cup and Handle Pattern.
Popularized by William O'Neil, founder of Investor's Business Daily, and detailed in his book 'How to Make Money in Stocks,' the Cup and Handle pattern gained widespread recognition through the CAN SLIM investment strategy. This pattern continues to be a valuable tool for technical analysts and traders aiming to capitalize on upward trending markets.
4. Bullish and Bearish Flags
Bullish and bearish flags are valuable technical analysis patterns that signal potential continuation of an existing trend. They are considered momentum patterns, relying on the premise that a strong initial price movement (the "pole") will be followed by a period of consolidation (the "flag") before the original trend resumes. These patterns are favored among traders due to their relatively quick formation and clear entry and exit signals, making them an essential tool in any technical analyst's arsenal. This pattern's straightforward identification and potential for quick profits earn it a prominent place on the list of important technical analysis patterns.

A bullish flag forms during an uptrend and is characterized by a near-vertical price surge (the pole) followed by a downward-sloping channel (the flag). Conversely, a bearish flag occurs in a downtrend, with the pole moving sharply downwards and the flag forming an upward-sloping channel. The flag represents a period of consolidation where the market pauses before resuming the previous trend. The flag's channel lines are drawn connecting the highs and lows of the consolidating price action. A breakout from the flag, in the direction of the original trend, confirms the pattern and signals a potential entry point. The price target for a flag pattern is often projected by measuring the length of the pole and adding it to the breakout point.
For example, during the gold price rally of 2019-2020, multiple bullish flag patterns emerged, offering traders opportunities to capitalize on the upward momentum. Similarly, Tesla stock displayed several bullish flags during its remarkable 2020 uptrend. On the other hand, USD/JPY formed a bearish flag before continuing its downtrend in early 2021, presenting short-selling opportunities. These examples highlight the pattern's effectiveness across various markets and assets.
Pros:
- Quick Formation: Flags typically develop within 1-3 weeks, allowing for relatively rapid trading opportunities.
- Clear Entry and Exit Points: Breakout from the flag provides a clear entry point, while the opposite side of the flag channel offers a defined stop-loss level.
- Versatile Applicability: Effective across various markets (stocks, forex, commodities) and timeframes.
- Precise Price Targets: The pole's length provides a measurable price target projection.
Cons:
- Potential for Confusion: Can be mistaken for other patterns during formation.
- Limited Reliability with Extended Flags: Flags lasting longer than 3-4 weeks become less reliable.
- False Breakouts: Susceptible to false breakouts, especially in range-bound markets.
- Difficulty in Differentiating from Reversals: Sometimes challenging to distinguish from reversal patterns.
Tips for Trading with Bullish and Bearish Flags:
- Ideal Duration: Focus on flags that form within 1-3 weeks. Be wary of prolonged consolidations.
- Volume Confirmation: Look for diminishing volume during flag formation and a surge in volume upon breakout.
- Entry Point: Enter trades when the price decisively breaks through the flag's resistance (bullish) or support (bearish) line.
- Stop-Loss Placement: Set stop-loss orders just beyond the opposite side of the flag channel.
The bullish and bearish flags are powerful tools for identifying potential trend continuations. By understanding their characteristics and applying appropriate risk management strategies, traders can leverage these patterns to enhance their technical analysis and improve trading decisions. These patterns' value for professional traders, stock market analysts, financial institutions, and independent investors alike solidifies their position as a core technical analysis pattern. They are useful for any stock scanner or stock screener and crucial information for daytrading.
5. Ascending and Descending Triangles
Ascending and descending triangles are essential technical analysis patterns belonging to the broader category of continuation patterns. This means they typically signal a pause in the prevailing trend – a period of consolidation – before the original trend resumes. Their inclusion in any list of important technical analysis patterns is justified by their relatively high reliability and the clear trading opportunities they present when correctly identified. These patterns appear across multiple timeframes and markets, making them valuable tools for various traders, from day traders focusing on short-term price movements to long-term investors analyzing broader market trends.
These patterns are formed by two converging trendlines. An ascending triangle is characterized by a flat, horizontal upper trendline (resistance) and a rising lower trendline (support). This typically suggests accumulating buying pressure, hinting at a potential upward breakout. Conversely, a descending triangle is formed by a flat, horizontal lower trendline (support) and a declining upper trendline (resistance). This usually implies increasing selling pressure and forecasts a likely downward breakout. Both patterns represent a battle between buyers and sellers, with the eventual breakout signaling which side has won. Crucially, the breakout often occurs before the triangle reaches its apex (the point where the two trendlines converge).
Trading volume plays a key role in confirming the validity of triangle patterns. Volume typically decreases as the triangle forms, reflecting the indecision and consolidation phase. However, a significant increase in volume accompanying the breakout is a strong confirmation signal, increasing the likelihood of a successful trade. For instance, Microsoft’s stock price formed an ascending triangle in Q4 2020, with a subsequent breakout accompanied by higher volume leading to a sustained upward move. Conversely, the S&P 500 showcased a descending triangle before the March 2020 market crash, with the breakout on heavy volume accelerating the downward momentum. The cryptocurrency Bitcoin also formed multiple ascending triangles during its 2017 bull run, demonstrating the pattern's relevance across different asset classes.
Features of Triangle Patterns:
- Two converging trendlines creating a triangle shape.
- Ascending triangles: horizontal resistance and rising support.
- Descending triangles: horizontal support and falling resistance.
- Decreasing trading volume during formation, increasing on breakout.
Pros:
- High reliability when confirmed by volume and other indicators.
- Clear entry points upon breakout.
- Effective across various timeframes (intraday to long-term) and markets (stocks, forex, cryptocurrencies).
- Measurable price targets: project the height of the triangle's widest part from the breakout point.
Cons:
- Potential for false breakouts, particularly near the apex.
- Formation can take time, potentially impacting short-term trading strategies.
- Can occasionally break in the opposite direction of the anticipated move.
- Confirmation with other technical indicators is recommended.
Tips for Trading Triangles:
- Optimal entry points occur when the price convincingly breaks through the support or resistance line, ideally with increased volume.
- The most reliable breakouts happen between 1/2 and 3/4 of the way to the apex.
- Project the height of the triangle at its widest point from the breakout point to estimate price targets.
- Place stop-loss orders just below the support line (for ascending triangles) or above the resistance line (for descending triangles) to manage risk.
Triangle patterns, as popularized by Charles Dow and later refined by analysts like Thomas Bulkowski and John Murphy (author of "Technical Analysis of the Financial Markets"), remain a valuable tool for technical analysis. They offer professional traders, analysts, and investors a robust method to identify potential continuation points in market trends, providing clear entry and exit points and measurable price targets. Utilizing these patterns in conjunction with other technical indicators and sound risk management practices can significantly enhance trading decisions and improve market analysis.
6. Symmetrical Triangles: A Neutral Pattern with Breakout Potential
Symmetrical triangles are a crucial element within the broader study of technical analysis patterns. They represent a period of consolidation and indecision in the market, offering traders the potential for substantial profits if the breakout direction is correctly anticipated. Unlike other triangle patterns, symmetrical triangles are neutral, meaning they can precede both upward and downward breakouts. This characteristic makes them a versatile tool for traders across various markets and timeframes.
This pattern forms when price action is confined by two converging trendlines, one acting as resistance (connecting lower highs) and the other as support (connecting higher lows). This creates a distinctive triangular shape, visually representing the ongoing battle between buyers and sellers. The converging trendlines indicate decreasing volatility as the price range narrows, often foreshadowing a significant price movement.
How Symmetrical Triangles Work:
Symmetrical triangles work by highlighting periods of market indecision. As the price oscillates within the converging trendlines, the market effectively compresses, like a coiled spring building potential energy. This compression eventually leads to a breakout, where the price decisively moves beyond one of the trendlines, often accompanied by a surge in volume. This breakout signals the end of the consolidation phase and the beginning of a new trend.
Examples of Successful Implementation:
- EUR/USD (Early 2021): The EUR/USD currency pair formed a symmetrical triangle in early 2021, ultimately breaking to the upside and leading to a significant rally.
- S&P 500 (Post-2020 Recovery): Following the sharp recovery in 2020, the S&P 500 consolidated within a symmetrical triangle before continuing its upward trajectory.
- Gold: Gold frequently forms symmetrical triangles during periods of market uncertainty, reflecting investors' conflicting views on the precious metal's future direction.
Actionable Tips for Traders:
- Confirmation is Key: Avoid anticipating the breakout. Wait for a confirmed break, meaning the price closes beyond one of the trendlines, ideally accompanied by increased volume.
- Volume as Validation: A surge in volume on the breakout adds validity to the move and increases the likelihood of a sustained trend.
- Price Targets: Project the widest part of the triangle's height from the breakout point to estimate potential price targets.
- Prior Trend Bias: While neutral, symmetrical triangles often break out in the direction of the prior trend. Consider this when assessing the probability of an upward or downward breakout.
- Apex Caution: Be wary of breakouts occurring very close to the apex of the triangle. These late breakouts are often less reliable and can be prone to false signals.
When and Why to Use Symmetrical Triangles:
Symmetrical triangles are valuable tools for both trend continuation and trend reversal trading strategies. They are effective in all market conditions (bull, bear, and sideways) and across different timeframes. Use this pattern to identify potential breakout points, set clear entry and exit levels, and manage risk effectively.
Pros:
- Works across various markets and timeframes.
- Provides well-defined entry and stop-loss levels.
- Offers measurable price targets.
Cons:
- Directionally neutral, requiring confirmation.
- Susceptible to false breakouts.
- Can take considerable time to form.
Popularized By:
The study of symmetrical triangles has been significantly influenced by prominent figures in technical analysis, including Edwards and Magee in their seminal work "Technical Analysis of Stock Trends," Jack Schwager in "Technical Analysis," and Thomas Bulkowski, whose statistical studies in "Encyclopedia of Chart Patterns" provide valuable insights into the pattern's reliability.
Symmetrical triangles deserve a prominent place in any trader's toolkit due to their versatility and potential for identifying significant price moves. By understanding the dynamics of this pattern and implementing the tips provided, traders can enhance their ability to navigate market uncertainty and capitalize on emerging trends.
7. Falling and Rising Wedges: Powerful Reversal and Continuation Signals within Technical Analysis Patterns
Falling and rising wedges are potent tools in the arsenal of technical analysis patterns, offering traders valuable insights into potential trend reversals and continuations across various markets and timeframes. These patterns are characterized by converging trendlines that slope in the same direction, creating a wedge-like shape on price charts. Understanding their nuances can significantly enhance a trader's ability to identify high-probability trading opportunities.
Mechanics of Wedges:
The key characteristic of a wedge is the converging trendlines, which represent contracting price action. In a falling wedge, both the support and resistance lines slope downwards, but the resistance line descends at a steeper angle. Counterintuitively, this pattern often foreshadows a bullish breakout, suggesting an impending upward price reversal. Conversely, a rising wedge features upward-sloping support and resistance lines, with the support line rising more steeply. This pattern typically precedes a bearish breakout, indicating a potential downward reversal.
Why Use Wedges in Technical Analysis?
Wedges earn their place among crucial technical analysis patterns due to their versatility and predictive capabilities. They can function as both reversal and continuation patterns. For instance, a falling wedge appearing at the bottom of a downtrend suggests a bullish reversal, while a falling wedge within an uptrend signals a brief pause before the uptrend continues. Similarly, a rising wedge at the top of an uptrend signals a bearish reversal, whereas a rising wedge during a downtrend suggests a temporary pause before the downtrend resumes.
Pros and Cons:
Pros:
- High Probability: Wedges, particularly when confirmed by increasing volume on breakout, boast a high success rate.
- Dual Functionality: They effectively serve as both reversal and continuation patterns.
- Clear Trading Signals: They provide well-defined entry, stop-loss, and target levels.
- Wide Applicability: They work across various timeframes (from minutes to months) and markets (stocks, forex, cryptocurrencies, etc.).
Cons:
- Identification Challenges: During formation, they can be mistaken for triangles or channels.
- False Breakouts: Choppy market conditions can lead to false breakouts, triggering premature entries or exits.
- Development Time: Wedges can take considerable time to fully develop, especially on higher timeframes.
- Volume Dependence: The pattern's reliability diminishes if volume doesn't conform to the expected behavior (decreasing during formation and increasing on breakout).
Actionable Tips for Trading Wedges:
- Confirmation is Key: Enter a trade only after a confirmed breakout, accompanied by a surge in volume.
- Strategic Stop-Loss Placement: Place stop-loss orders just beyond the opposite side of the wedge to minimize potential losses.
- Profit Targets: Target projections should be at least equal to the height of the wedge's widest part.
- Cautionary Approach: Treat rising wedges in uptrends and falling wedges in downtrends with extra caution, as these can sometimes be tricky.
- Momentum Divergence: Look for momentum divergence (e.g., RSI or MACD) to strengthen the potential reversal signal.
Examples of Wedge Patterns in Action:
- The S&P 500 formed a rising wedge before the February 2020 market crash, demonstrating its bearish reversal potential.
- Bitcoin displayed a falling wedge in early 2019 before embarking on a significant rally, showcasing its bullish reversal capabilities.
- Tesla stock has historically shown multiple rising wedges during price corrections within its broader uptrend, highlighting the pattern's continuation characteristics.
Historical Context and Popularity:
The concept of wedges has been popularized by influential figures in technical analysis, including Edwards and Magee in their classic literature, Thomas Bulkowski's statistical analysis in "Trading Classic Chart Patterns," and John Murphy's detailed coverage in his technical analysis publications.
By understanding and effectively utilizing falling and rising wedge patterns, traders can enhance their ability to identify potential trend changes and capitalize on profitable trading opportunities within the dynamic landscape of financial markets. These technical analysis patterns provide a robust framework for making informed trading decisions based on price action and market dynamics.
8. Rounding Bottoms and Tops
Rounding Bottoms and Tops are essential technical analysis patterns that belong in any trader's toolkit. These patterns, signifying gradual trend reversals, offer valuable insights into shifting market sentiment and provide opportunities for both long-term and swing traders. They fall under the broader category of technical analysis patterns and are especially relevant for those analyzing commodities, indices, and individual stocks.
Rounding patterns, also known as saucer bottoms (for bottoms) and inverted saucers (for tops), are characterized by their smooth, U-shaped or inverted U-shaped price action. Unlike sharp V-shaped reversals, these formations develop over extended periods, sometimes spanning months or even years on larger timeframes. This gradual curvature represents a slow but significant shift in the balance between buyers and sellers.
How They Work:
A Rounding Bottom forms during a downtrend. Initially, selling pressure dominates, pushing prices lower. As the selling gradually subsides, the price decline slows, and the curve begins to flatten. Accumulation begins as astute investors recognize the potential for a reversal. As buying pressure builds, the price starts to curve upwards, completing the 'U' shape and confirming the trend change. Volume typically mirrors this price action, decreasing during the downtrend and increasing as the uptrend emerges.
Conversely, a Rounding Top forms during an uptrend. Initial strong buying pressure drives prices higher. As buying interest wanes, the price rise slows, and the curve flattens. Distribution occurs as investors begin to lock in profits. Selling pressure gradually intensifies, pushing the price down and forming the inverted 'U'. Volume typically decreases during the uptrend's peak and increases as the downtrend begins.
Examples of Successful Implementation:
- Gold (2013-2019): Gold formed a multi-year rounding bottom between 2013 and 2019, offering a significant buying opportunity for patient investors.
- US Dollar Index (2016-2017): A rounding top formation in the US Dollar Index during 2016-2017 foreshadowed a subsequent decline.
- Apple (Early 2019): Apple stock displayed a rounding bottom in early 2019 before embarking on a substantial rally.
Pros:
- Strong Reversal Signals: Once completed, rounding patterns provide reliable reversal signals with potential for sustained follow-through.
- Reduced False Signals: Compared to more angular patterns, rounding formations are less susceptible to whipsaws and false breakouts.
- Versatile Applicability: These patterns work effectively across various markets, including commodities, indices, and individual stocks.
- Gradual Entry Opportunities: The extended formation period allows for multiple entry points as the pattern develops.
Cons:
- Time-Consuming Formation: The lengthy formation period requires patience and can tie up capital for extended durations.
- Difficult Early Identification: Recognizing these patterns can be challenging until they are nearly complete.
- Entry Timing Challenges: Pinpointing optimal entry and exit points can be tricky without clear breakout confirmations.
- Less Defined Price Targets: Unlike some other patterns, rounding formations offer less precise price targets.
Actionable Tips:
- Confirm with Volume: Pay close attention to volume patterns, which should ideally mirror the price curve – decreasing into the bottom/top and increasing during the rise/decline.
- Utilize Moving Averages: Moving averages can assist in identifying the curve's progression and potential breakout points.
- Entry Points (Rounding Bottoms): Consider entering a long position when the price closes decisively above the pattern's right rim (resistance).
- Entry Points (Rounding Tops): Consider entering a short position when the price breaks decisively below the pattern's right rim (support).
- Momentum Confirmation: Employ momentum indicators like RSI or MACD to validate the reversal and filter out false signals.
Why Rounding Bottoms and Tops Deserve Their Place:
Rounding Bottoms and Tops offer valuable insights into long-term market sentiment shifts. While requiring patience, these technical analysis patterns can provide significant trading opportunities with a higher probability of success compared to more volatile, short-term patterns. Their ability to forecast major trend reversals makes them an indispensable tool for professional traders, analysts, and long-term investors alike. By understanding the nuances of these patterns and applying the tips provided, traders can effectively leverage rounding formations to identify high-probability entries and exits.
8 Key Technical Patterns Comparison
| Pattern | Implementation Complexity 🔄 | Resource Requirements ⚡ | Expected Outcomes 📊 | Ideal Use Cases 💡 | Key Advantages ⭐ |
|---|---|---|---|---|---|
| Head and Shoulders | Medium - requires pattern recognition and confirmation signals | Moderate - volume analysis and other indicators | Reliable bearish/bullish reversal with measurable price targets | Trend reversals on multiple timeframes | High reliability, clear entries & targets |
| Double Top / Double Bottom | Low - simple two-peak/ trough identification | Low - minimal indicator support needed | Reversal signals with clear entry and stop-loss points | Trend reversals in all markets and timeframes | Easy to identify, clear targets |
| Cup and Handle | High - requires spotting rounded bottom and handle | Moderate - volume tracking and breakout confirmation | Bullish continuation with strong breakout potential | Bull markets and stock breakouts | Strong reliability in bull markets, defined risk |
| Bullish / Bearish Flags | Low to Medium - quick formation but careful identification needed | Low - volume and breakout monitoring sufficient | Quick continuation after brief consolidation | Short-term trend continuation | Fast formation, precise targets |
| Ascending / Descending Triangles | Medium - identification of converging trendlines necessary | Moderate - volume and breakout confirmation | Continuation with clear entry and measurable targets | Trend continuation patterns | High reliability, measurable price targets |
| Symmetrical Triangles | Medium to High - neutral pattern requiring breakout confirmation | Moderate - volume and breakout validation needed | Neutral breakout, possible continuation or reversal | Consolidation phases in any market | Works in all conditions, defined risk management |
| Falling / Rising Wedges | Medium - identifying slope direction and confirmation | Moderate - volume and breakout confirmation | Reversal or continuation with high probability | End of trends or continuation setups | Applicable as reversal/continuation, clear levels |
| Rounding Bottoms / Tops | High - long formation period and curve recognition | High - requires extended time and volume tracking | Gradual, sustained reversals with less false signals | Long-term reversal identification | Strong reversal signals, gradual entry opportunities |
Mastering Technical Analysis for Trading Success
From head and shoulders to rounding bottoms, the eight technical analysis patterns discussed in this article provide a robust framework for interpreting market movements. Mastering these patterns—including double tops and bottoms, cup and handle formations, bullish and bearish flags, ascending and descending triangles, symmetrical triangles, and falling and rising wedges—empowers traders of all levels, from day traders to institutional investors, to identify potential entry and exit points with greater precision. These patterns, when combined with other indicators and fundamental analysis, offer valuable insights into market sentiment and potential future price action.
By understanding the nuances of these technical analysis patterns, you can significantly enhance your trading strategies. Remember, consistent practice and diligent observation are key to effectively applying these patterns in real-world market scenarios. For those looking to take their technical analysis to the next level, consider exploring dynamic image generation. This cutting-edge technology can create personalized visuals based on real-time market data, providing traders with unique insights and a more engaging way to interpret complex patterns, as highlighted by Dynamic Image Generation: Ignite Creativity from OKZest.
Technical analysis is a powerful tool, and a deep understanding of these patterns is essential for navigating the complexities of the financial markets. Embrace continuous learning, refine your analytical skills, and watch your trading proficiency soar. Ready to put these powerful patterns into action? Explore ChartsWatcher, a platform designed to help you identify and track these technical analysis patterns with advanced charting and analysis capabilities, ultimately optimizing your trading decisions.
