Bull Flag Pattern: Winning Trading Strategies
Decoding The Bull Flag Pattern: A Trader's Advantage
The bull flag pattern is a valuable tool for traders looking to identify potential continuation patterns in the stock market. This pattern suggests that an existing upward trend is likely to continue after a period of consolidation. Understanding this pattern can offer a significant advantage in finding profitable trades.
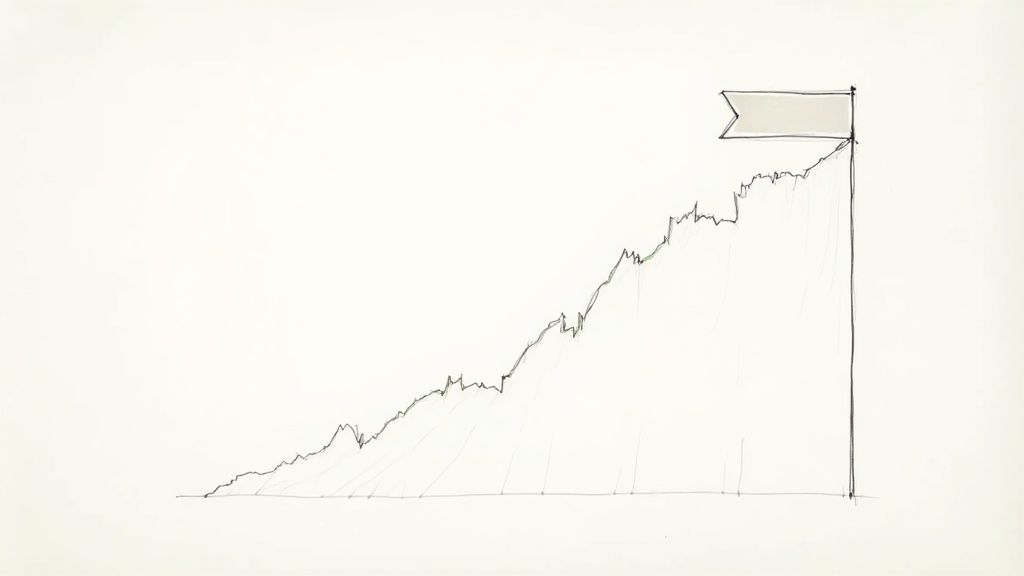
The bull flag pattern consists of two main components: the flagpole and the flag.
The flagpole is a sharp, nearly vertical price increase characterized by high trading volume. This surge typically indicates strong buying pressure and upward momentum. After this rapid climb, the price enters a period of consolidation, forming the flag. The flag is a sideways price movement that often resembles a parallelogram or rectangle.
This pause in the uptrend can be misleading. Less experienced traders might mistake it for a reversal and sell their positions prematurely. However, within a continuing uptrend, the bull flag pattern usually signals a brief pause before the price continues its upward movement. This makes the bull flag a reliable continuation pattern in technical analysis. Learn more about bull flag patterns.
Understanding Market Psychology And The Bull Flag
The bull flag pattern's formation is deeply rooted in market psychology. The initial flagpole surge attracts buyers hoping to capitalize on the upward momentum. As the price rapidly increases, some early buyers may choose to take profits.
This profit-taking initiates the flag's consolidation phase. Meanwhile, other traders who missed the initial price surge may see the consolidation as an opportunity to enter the market. This influx of new buyers prevents the price from dropping significantly.
The interaction between profit-takers and new buyers creates the distinctive flag shape. The lower trading volume during consolidation is a key characteristic, indicating a pause rather than a true reversal.
How Institutional Money Influences Bull Flag Patterns
Institutional investors, with their substantial capital, significantly influence the formation and validation of bull flag patterns. Their large buy orders can contribute to the initial flagpole surge. High volume during the flagpole's formation can be a sign of institutional accumulation.
During the consolidation phase, these institutional players may strategically pause their buying activity. This pause allows the price to consolidate and potentially removes less committed investors from the market.
After this consolidation, institutional investors may resume their buying, pushing the price higher. Recognizing this behavior can provide valuable insight into the potential for a breakout. Therefore, observing volume patterns along with price action is crucial for confirming the validity of a bull flag pattern.
Spotting Winning Bull Flag Patterns Like a Pro
Identifying a bull flag pattern correctly requires a nuanced understanding beyond simply spotting a flagpole and flag. This section will help you differentiate real bull flags from patterns that might appear similar but are actually quite different. Knowing these key characteristics will significantly improve your trading accuracy.
Key Characteristics of a Valid Bull Flag Pattern
A genuine bull flag pattern begins with a sharp, decisive price increase on high volume, known as the flagpole. This surge indicates strong buying pressure. The flagpole is followed by the flag, a period of consolidation where the price moves sideways, often resembling a parallelogram or rectangle. This flag typically slopes slightly downwards. Critically, volume should noticeably decrease during this consolidation phase.
Separating the Real from the Fake: Avoiding Bull Flag Traps
Many traders mistakenly identify bear flags or ascending triangles as bull flags. Bear flags, however, appear in downtrends and slope upwards. Ascending triangles, unlike bull flags, have a flat upper trendline and a rising lower trendline.
The duration of the flag is also an essential factor. Extended consolidation can signal weakening momentum. Ideally, a bull flag consolidates for one to three weeks, although this can vary depending on the timeframe being analyzed.
To further illustrate these differences, let's examine a comparison table:
This table outlines the key characteristics of a true Bull Flag pattern and contrasts them with common misinterpretations.
Bull Flag Pattern Characteristics
| Component | Ideal Characteristics | Warning Signs | Common Mistakes |
|---|---|---|---|
| Flagpole | Sharp, strong price increase with high volume | Weak price increase or low volume | Mistaking a minor price bounce for a flagpole |
| Flag | Short-term consolidation (1-3 weeks), slightly downward sloping, resembling a parallelogram or rectangle, decreasing volume | Consolidation lasting too long, upward sloping flag, increasing volume | Confusing with bear flags or ascending triangles |
| Breakout | Decisive price break above the upper trendline with a surge in volume | Weak breakout with low volume or false breakouts | Entering a trade before confirmation of a valid breakout |
| Angle | Between 0 and -45 degrees | Too steep or too flat of an angle | Not considering the angle of the flag |
This table highlights the key differences that will help you distinguish true bull flag patterns from similar, but ultimately different, formations. Accurate pattern recognition is crucial for successful trading.
Confirmation Through Volume and Price Action
Volume analysis provides further confirmation. Look for a surge in volume as the price breaks out above the upper trendline of the flag. This increased volume confirms renewed buyer interest and validates the pattern. For more information on price targets, see How to master price target calculations.
Mastering Pattern Recognition Through Practice
Consistent practice is key to identifying winning bull flag patterns. Studying charts across different asset classes and timeframes will sharpen your ability to spot subtle variations. How to master several day trading chart patterns is a great resource to help expand your knowledge. Pay particular attention to the angle of the flag, ensuring it's not too steep or too shallow. An excessively steep flag can indicate a weakening trend, while a flat flag might transform into a different pattern altogether.
By understanding these principles and practicing regularly, you can trade bull flag patterns with greater confidence and potentially improve your profitability. This informed approach helps you avoid false signals and capitalize on real breakout opportunities.
Volume Analysis: The Bull Flag Confirmation Secret
Price action is the foundation of the bull flag pattern. However, volume analysis provides essential confirmation, revealing the pattern's true strength.
Professional traders recognize that volume often precedes price movement. It offers a glimpse into the market's driving forces. By incorporating volume analysis into your bull flag strategy, you can significantly improve your trading accuracy.
Volume During the Flagpole: A Surge of Buying Pressure
The initial flagpole formation typically shows a significant increase in trading volume. This volume surge confirms strong buying interest, fueling the rapid price advance.
For example, imagine a stock's price increases by 30%, with its average daily trading volume doubling. This strong volume confirms the buying pressure's intensity, suggesting the move isn't a random fluctuation.
Volume During Consolidation: A Critical Contraction
As the price consolidates, forming the flag, volume should decrease. This contraction suggests the pause is due to profit-taking and a natural breather, not a trend reversal.
Low-volume consolidation signals minimal selling pressure. The bulls are simply pausing before the next upward move. Many retail traders misinterpret this pattern. Seeing the sideways movement and reduced volume, they mistake consolidation for a reversal and exit prematurely.
Volume On Breakout: The Confirmation Signal
The breakout is where volume analysis truly shines. A volume surge accompanying the price break above the flag's upper trendline is a powerful confirmation.
This volume expansion indicates renewed buying interest, validating the bullish continuation. A low-volume breakout, however, could be a false breakout, trapping unsuspecting traders. Waiting for volume confirmation is essential to filter out weak breakouts and improve success.
Volume analysis plays a vital role in validating the bull flag pattern. The initial flagpole usually has a significant volume increase. During consolidation, volume typically decreases. A successful breakout often sees increased volume. For example, a low-volume breakout might signal a false breakout. Learn more about volume and bull flag patterns. By analyzing volume behavior during each phase—flagpole, consolidation, and breakout—traders gain a decisive edge.
Bull Flag Performance: A Deeper Dive
Understanding the bull flag pattern is more than just recognizing it on a chart. True mastery comes from analyzing its performance across different markets and conditions. This knowledge is key for informed trading.
Bull Flag Success Rates and Profitability
A crucial performance metric is the success rate, the percentage of times a bull flag leads to a profitable breakout. Traders also consider the risk-reward ratio, which compares potential profit to potential loss. A 3:1 risk-reward ratio, for example, suggests a trader could potentially earn three dollars for every dollar risked.
Studies show the average bull flag success rate is around 63%. This means roughly two-thirds of bull flag patterns result in the uptrend continuing. The average return-to-risk ratio is about 3:1, suggesting a strong potential for profit. Bcapital provides more detailed statistics. These metrics are vital for assessing a pattern's profitability.
Influence of Consolidation Period
The consolidation phase, or "flag," has a big impact on a bull flag's success. Short consolidations often signal strong momentum. Longer periods, however, may suggest weakening buyer interest. Prolonged indecision can erode confidence in the uptrend.
Ideal Market Conditions
Bull flags perform best in trending markets. Existing momentum helps the uptrend continue after the brief consolidation. In volatile or uncertain markets, though, bull flags are less reliable.
Performance Across Assets and Timeframes
Performance varies across asset classes and timeframes. For instance, success rates might be higher in liquid markets like forex than in less liquid ones. Reliability can also differ between short-term charts (like 15-minute or hourly) and longer-term charts (daily or weekly).
To understand the specific risk-reward profiles for different assets and timeframes, traders analyze historical data and backtest strategies. This helps them choose setups that match their risk tolerance and style.
Let's look at some statistical data across different markets:
The table below presents a statistical overview of Bull Flag performance across various markets. It highlights the success rates, average returns, risk-reward ratios, and best timeframes for each market.
| Market | Success Rate | Avg. Return | Avg. Risk-Reward Ratio | Best Timeframes |
|---|---|---|---|---|
| Stocks | 63% | 10% | 3:1 | Daily, Weekly |
| Forex | 70% | 5% | 2:1 | Hourly, 4-Hour |
| Crypto | 55% | 15% | 4:1 | 4-Hour, Daily |
| Commodities | 60% | 8% | 2.5:1 | Daily, Weekly |
This data showcases the varied performance of the Bull Flag pattern. While stocks show a good balance of success rate and return, crypto, despite a lower success rate, offers a higher average return and risk-reward ratio. Forex demonstrates the highest success rate, while commodities offer a moderate risk-reward ratio.
Institutional Influence
This analysis often involves examining the role of institutional investors. Strong institutional buying during the "flagpole" formation can boost the chances of a successful breakout. Understanding these factors helps traders refine their bull flag strategies for maximum profitability.
High-Probability Bull Flag Trading Techniques
Building upon the ability to identify a promising bull flag pattern, this section explores advanced trading techniques used by seasoned professionals. These techniques include precise entry and exit strategies, coupled with effective position sizing and risk management.
Mastering Entry Techniques: Aggressive Vs. Conservative
Traders employ various entry techniques based on their individual risk tolerance and prevailing market conditions. Aggressive entries involve buying as soon as the price breaks above the upper trendline of the flag, confirmed by a surge in trading volume. This approach aims to capture the initial breakout momentum for maximum profit potential.
Conservative entries, conversely, prioritize confirmation. Traders may wait for a retest of the broken trendline as support before entering a position. This approach mitigates the risk of false breakouts but could mean missing out on some profit if the price moves rapidly after the initial breakout.
- Aggressive Entry Trigger: Breakout above the upper trendline with increasing volume.
- Conservative Entry Trigger: Retest of the broken trendline as support after the breakout.
Stop-Loss Placement: Protecting Capital and Allowing for Volatility
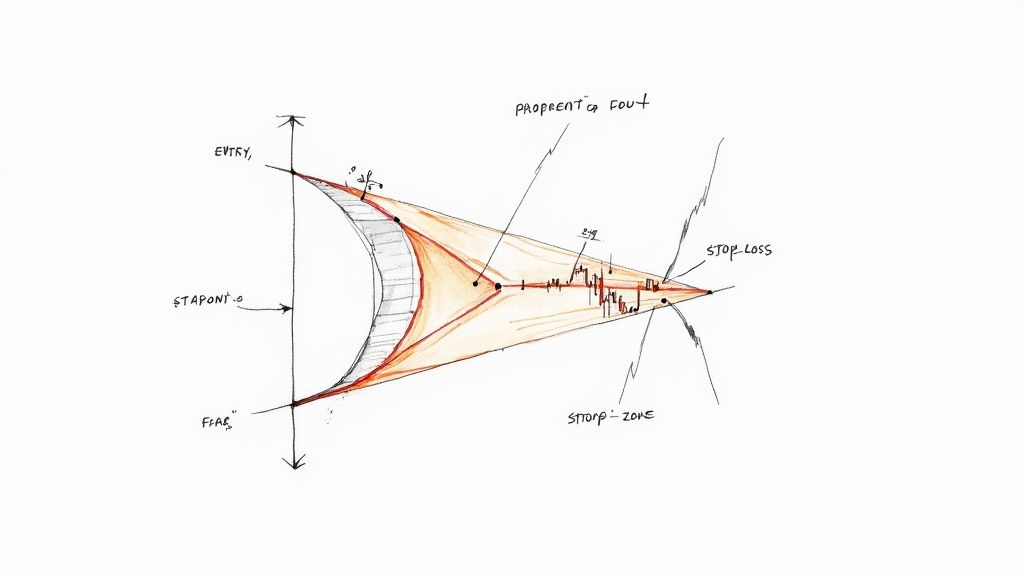
Strategic stop-loss placement is crucial for effective risk management. A common practice is setting the stop-loss just below the lower trendline of the flag, or slightly below a recent swing low within the flag formation. This allows for typical price fluctuations within the pattern without prematurely exiting the trade. It also limits potential losses should the breakout fail.
Take-Profit Strategies: Maximizing Gains and Preserving Profits
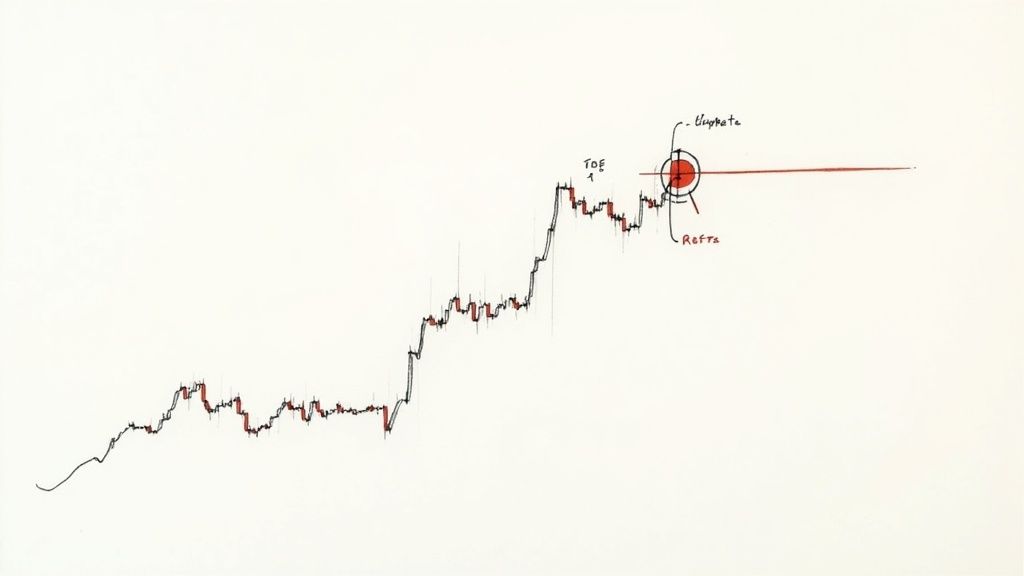
Take-profit strategies involve identifying price levels at which to exit a winning trade. One common method is projecting the height of the flagpole from the breakout point. This flagpole measurement offers a realistic target based on the initial momentum.
Partial exits allow traders to lock in some profit at the initial target while letting a portion of the position run in anticipation of an extended price move. Trailing stops are another valuable technique, adjusting the stop-loss upward as the price rises, securing profits as the trade progresses.
The bull flag pattern isn't just for identifying breakouts; it's also helpful for setting profit targets and managing risk. Traders often use the flagpole's height, projected from the breakout point, to estimate potential profit. Stop-loss orders placed below the flag's lowest point help manage risk. This approach balances profit maximization with risk mitigation. Learn more about bull flag trading here.
Position Sizing: Balancing Risk and Reward
Determining the appropriate position size involves balancing potential reward with acceptable risk. One technique involves calculating the capital risked based on the distance between the entry price and the stop-loss level. This risk amount is then used to determine the number of shares or contracts to purchase, ensuring potential losses remain within the trader’s risk tolerance. For example, a trader might risk 1% of their trading capital on any single trade.
By mastering these techniques and understanding the nuances of bull flag patterns, traders can significantly improve their chances of success. Consistent practice and careful analysis are essential for refining these skills and achieving long-term profitability. These techniques are also valuable when used with charting software and advanced scanning capabilities.
Avoiding Bull Flag Traps and Minimizing Losses
Even with a solid understanding of the bull flag pattern, it's important to remember that no trading strategy is foolproof. Knowing why these patterns sometimes fail is key to protecting your investment. This involves recognizing warning signs and implementing effective risk management.
Recognizing Early Warning Signs
Experienced traders analyze both price and volume for clues about a potential bull flag failure. One warning sign is a flag that consolidates for an extended period. A typical bull flag consolidates for one to three weeks. A longer consolidation can signal weakening momentum.
A flag sloping upwards, instead of downwards, resembles a bear flag. This can indicate a potential trend reversal. Increased volume during consolidation suggests continued distribution and potential selling pressure. This contradicts the ideal scenario of decreasing volume and minimal selling.
A weak breakout with low volume, or several false breakouts, can indicate a lack of genuine buyer interest. This increases the likelihood of failure.
Market Context and Broader Trend Strength
The reliability of a bull flag pattern depends heavily on the broader market. Bull flags are more likely to succeed in strong uptrends. In volatile markets, the pattern's predictive power decreases.
Sector rotation also plays a role. A bull flag might fail even if the individual stock looks promising if its sector is underperforming. Assessing the overall market trend and sector performance is essential. For more on risk management, check out this helpful resource: How to master day trading risk management.
Practical Risk Management Techniques
Using robust risk management is essential for minimizing losses. One key technique is using predefined failure criteria. This means setting a stop-loss order below the flag's lower trendline or a recent swing low. If the price drops below this level, the trade is exited, limiting losses.
Scale-out strategies can also be effective. This involves taking partial profits at predetermined target levels. This approach balances potential profit with risk reduction.
Example: A Failing Bull Flag
Imagine a stock forming a bull flag after a strong rally. During consolidation, volume increases, and the flag slopes upwards. The price breaks above the upper trendline but with low volume and fails to hold. These combined warning signs suggest a high probability of failure.
A trader who recognizes these signs and uses appropriate risk management can exit early, minimizing losses. By understanding these warnings, analyzing market context, and implementing risk management, traders can avoid traps and protect their capital. Knowing when not to trade is just as important as identifying promising setups.
Ready to improve your trading? Explore ChartsWatcher, a stock market scanning software designed for professional traders. Discover how our platform can help you identify high-probability setups, manage risk, and maximize your trading profits.
