Low Float Stocks: High-Reward Trading Strategies
Low float stocks are a fascinating and often misunderstood corner of the market. These are equities with a very small number of shares actually available for the public to trade, which sets the stage for some incredibly volatile price action.
Because the supply is so tight, even small shifts in buying or selling pressure can send prices flying—or crashing. This environment creates huge opportunities for traders, but it also comes with massive risks.
Understanding Low Float Stocks And Their Explosive Potential
To really get a handle on low float stocks, you first have to understand the idea of "float."
Every public company has a total number of shares outstanding. Think of this as all the pieces of the ownership pie. But here's the catch: not all of those pieces are being passed around on the stock market.
A significant chunk of those shares is often locked up by insiders—company executives, founders, and big institutional investors. These are called "restricted" shares because they aren't being actively traded day-to-day. The "float" is simply what's left over for you and me to buy and sell.
Defining The Low Float Threshold
So, what makes a float "low"? While there's no official rule, the general consensus among traders is that a company with fewer than 10 million shares in its float qualifies.
This scarcity is what gives these stocks their wild personality. When a stock has a tiny float, it doesn't take much to move the price. A bit of good news, a positive earnings report, or even a sudden burst of chatter on social media can cause a buying frenzy that quickly overwhelms the limited supply of available shares.
Key Takeaway: The relationship between supply and demand is drastically amplified in low float stocks. A small increase in buying pressure can lead to disproportionately large price increases simply because there aren't enough sellers to meet the demand.
This is exactly why day traders are drawn to them. The potential for a stock to double or even triple in value in a single day is a powerful magnet for anyone seeking quick, substantial gains.
Low Float vs High Float Stocks at a Glance
To put it all in perspective, here's a quick comparison of the key differences between low and high float stocks. Understanding these distinctions is crucial before you even think about placing a trade.
| Characteristic | Low Float Stocks | High Float Stocks |
|---|---|---|
| Share Availability | Very limited (often < 10M shares) | Abundant (often > 100M shares) |
| Volatility | Extremely high | Generally lower |
| Liquidity | Low to moderate | High |
| Bid-Ask Spread | Wide | Narrow |
| Typical Investor | Day traders, speculators | Institutions, long-term investors |
| Price Movement | Explosive and rapid | Slower and more predictable |
| Risk Level | Very high | Moderate |
This table makes it clear: you're dealing with two completely different animals. Trading a low float stock requires a strategy built for speed and volatility, not the slow and steady approach you might use with a blue-chip company.
The Double-Edged Sword Of Volatility
As exciting as the upside is, you have to respect the fact that this volatility is a two-way street. The same forces that can create a spectacular rally can also trigger a catastrophic collapse.
All it takes is a piece of bad news or a wave of profit-taking for the price to plummet just as fast as it climbed. There’s very little cushion on the way down.
This unique behavior also creates the perfect setup for dramatic market events, like the famous short squeeze. When a low float stock also has high short interest, any upward price movement can force short sellers to buy back shares to cut their losses. This forced buying adds even more fuel to the fire, pushing the price higher in a vicious cycle. We've actually put together a detailed breakdown of how a short squeeze works if you want to dive deeper.
Before you jump in, it's absolutely critical to understand this dual nature. Low float stocks offer incredible potential, but they demand a solid grasp of market mechanics and an iron-clad approach to managing risk.
Getting Your Head Right for High-Volatility Trading

The pull of fast profits from low float stocks is undeniable, but make no mistake—this arena is littered with emotional landmines. Before you can even think about trading these tickers successfully, you have to get your own psychology in check. The charts and setups are only half the battle. Your biggest opponent is usually the person staring back at you in the mirror.
When a low float stock starts to go parabolic, the Fear of Missing Out (FOMO) is a powerful, almost physical sensation. You see the screenshots on Twitter, the green rockets flying in chat rooms, and the urge to jump in becomes overwhelming. This is exactly how traders get trapped, buying at the absolute peak as the early crowd is quietly heading for the exits.
On the flip side, the speed at which these stocks can collapse triggers an equally primal emotion: sheer panic. Watching your position evaporate by 10-20% in a matter of minutes makes you want to hit the sell button just to stop the bleeding. This is panic selling, and it almost always means locking in a loss right at the bottom, just before a potential bounce.
The Emotional Tug-of-War
To succeed here, you need a level of emotional discipline that most people simply don't have. It's a constant fight between greed and fear.
- Greed is the little voice that tells you to hold on for just one more dollar, turning a great win into a breakeven trade or even a loss when the stock inevitably reverses.
- Fear is what screams at you to bail after a tiny dip, shaking you out of a perfectly good trade that was heading toward your target.
Trader's Insight: The best low float traders I know operate like machines. They have a non-negotiable plan for every single trade: exact entry, a hard stop-loss, and realistic profit targets. They execute that plan without letting FOMO or panic muddy the waters.
Understanding these psychological traps is your first line of defense. Know that you will feel these emotions. Acknowledging them ahead of time is the only way you can stick to your trading plan when things get heated.
Real Risks That Can Wreck Your Account
Beyond the battle in your head, low float stocks carry very real market risks that can wipe you out in an instant if you’re not prepared. These aren't your grandpa's blue-chip stocks; the rules are completely different.
A classic danger is the trading halt. If a stock moves too violently, exchanges will pause trading to let things cool down. If you're holding a winning position, a halt can kill your momentum and reopen at a much lower price. If you're losing, you're trapped—unable to sell while bad news circulates and sellers pile up.
Then there’s the liquidity trap. A stock might be incredibly easy to buy on the way up, but when the music stops, finding a buyer on the way down can be nearly impossible. The bids vanish, and the price plummets as sellers trip over each other to get out. You might see the price at $5, but by the time your order fills, you're out at $4. That gut-wrenching difference is called slippage.
Red Flags to Watch Out For
Certain scenarios crank up the risk even further. Think of these as bright red warning signs.
- Pump-and-Dump Schemes: Low float stocks are the perfect playground for manipulators. Groups will coordinate to create massive hype online, drawing in unsuspecting traders to drive the price up. Once the new buyers are in, the manipulators dump all their shares, crashing the stock and leaving everyone else holding the bag.
- Overnight Offerings: A company might capitalize on a huge run-up by announcing a secondary share offering after the market closes. This floods the market with new shares, diluting the value for existing shareholders. It’s not uncommon for a stock to gap down 30% or more the next morning, absolutely crushing anyone who held overnight.
Navigating this world requires more than a good scanner. It demands nerves of steel and an ironclad commitment to risk management. Never, ever risk more than you are truly willing to lose on any single trade, and always know your exit before you even click "buy."
Actionable Trading Strategies for Low Float Movers
Alright, enough with the theory. Let's get our hands dirty and talk about how to actually trade these things. Success in the wild world of low float stocks comes down to recognizing specific, repeatable patterns and having a crystal-clear plan of attack. Simply jumping on a stock that’s already screaming up 50% is a surefire way to get burned. You need a defined strategy.
Two of the most powerful and time-tested setups are the short squeeze and the classic breakout. Each one feeds on the unique supply-and-demand chaos that makes these stocks so explosive, but they have their own distinct triggers and personalities you need to learn.
Anatomy Of a Potent Short Squeeze
The short squeeze is probably the most violent and exciting event you'll witness in low float trading. It's a chain reaction that happens when a stock with a ton of short sellers suddenly spikes higher, forcing them to buy back their shares to cut their losses. This frantic buying is like pouring gasoline on a fire, creating a feedback loop that sends the price parabolic.
But these squeezes don't just appear out of thin air. A true, high-quality short squeeze setup has a few key ingredients you can actively hunt for.
- High Short Interest: This is the bedrock of the entire setup. A huge chunk of the float needs to be sold short. Without it, there's no fuel for the fire.
- A Powerful Catalyst: Unexpected, game-changing news is the match that lights the fuse. Think surprise FDA approval, a massive government contract, or blowout earnings.
- Surging Volume: A tidal wave of buyers is what starts the move and puts the initial pressure on the shorts. This is your confirmation that the squeeze is on.
When a low float stock has a short interest over 20%, things get interesting. This metric—the percentage of a stock's float that's been borrowed and sold short—becomes critical. If a positive catalyst hits a stock with a float under 5 million shares and a short interest above 25%, the scramble to cover can lead to mind-bending price spikes. This is the perfect storm where shorts get trapped. You can dig into more short interest data and its market impact to see these scenarios play out.
As the price rips higher, their losses pile up. Eventually, their brokers might even issue a "margin call," forcing them to buy back shares at any price, which only adds more fuel to the rally.
The Classic Breakout Strategy
Another one of my go-to strategies for low float stocks is the breakout. This setup is less about the company's story and all about pure technicals and momentum. The game plan is simple: find a stock that's been stuck under a clear resistance level and jump in the moment it punches through that ceiling on massive volume.
Think of a resistance level as a price where sellers have shown up time and time again, slamming the door on any rally. When the stock finally blasts through that level, it's a huge psychological shift. The sellers are exhausted, and the buyers have taken over.
Trader's Insight: A rookie mistake I see all the time is ignoring volume on a breakout. A stock creeping over resistance on low volume is a trap—a "fakeout" waiting to happen. A real, legitimate breakout must be driven by a huge surge in volume, ideally several times the stock's average daily volume.
This volume surge proves there's real conviction behind the move. It's not just a few buyers; it's an army. Plus, short sellers who were betting against the stock at that resistance level likely placed their stop-loss orders just above it. When the price breaks through, those stops trigger as market buy orders, adding another wave of buying pressure.
Building Your Tactical Checklist
A vague idea isn't a strategy; it's a gamble. To trade effectively, you need a concrete, written-down plan that removes emotion from the equation. Here’s a practical checklist for a breakout trade that you can easily adapt for a short squeeze.
| Checklist Item | Actionable Rule | Rationale |
|---|---|---|
| Entry Trigger | Buy as the price breaks decisively above a key resistance level on a high-volume candle. | This confirms buyers are in control and reduces the odds of getting caught in a fakeout. |
| Stop-Loss Placement | Set your initial stop-loss just below the breakout level or the low of the breakout candle. | This defines your exact risk. If the price drops back below this point, your trade idea is wrong. |
| Initial Profit Target | Aim for a first target that gives you at least a 2:1 reward-to-risk ratio. | This ensures your winners are big enough to more than cover your losers, which is essential for long-term profit. |
| Scaling Out | Sell a piece of your position (e.g., 1/3 or 1/2) at your first target and move your stop-loss up on the rest. | This lets you book profits and pay yourself while still giving you a chance to catch a bigger run. |
Using a structured checklist like this forces discipline. You know your entry trigger, you know where you're wrong, and you know how you'll take profits when you're right. This is the kind of methodical approach that separates consistent traders from the gamblers in the fast-paced world of low float stocks.
Finding High-Potential Stocks with ChartsWatcher
A great strategy is worthless if you can’t find the right stocks at the right time. This is where a powerful, real-time stock scanner becomes your most important tool. Forget sifting through thousands of tickers by hand; you can build a machine that brings high-potential low float stocks right to your screen.
The idea isn’t just to find any low float stock. We're hunting for the ones with a real catalyst and unusual volume—the tell-tale signs that a major move is brewing. With a tool like ChartsWatcher, you can set up precise filters to slice through the market noise and zero in on the tickers that meet your strict criteria for a high-probability setup.
Building Your Pre-Market Gapper Scan
The first hour of trading is often pure chaos for low float stocks, and that's where the opportunities are. News that drops overnight can create massive price gaps, and your mission is to spot these "gappers" long before the opening bell. Think of a solid pre-market scan as your early warning system.
Here’s a practical, plug-and-play scanner setup in ChartsWatcher designed to pinpoint these movers:
- Float: Set this to less than 10 million shares. This is the heart of our search, filtering for stocks that have the DNA for explosive moves.
- Pre-Market Volume: Require a minimum of 50,000 shares. This tells you there's already real interest in the stock before most traders have even had their coffee.
- Pre-Market Gap %: Look for stocks gapping up at least +10%. A gap this big screams that a powerful catalyst is in play, drawing a crowd.
- Price: Stick to a range of $1 to $20. This is the sweet spot where stocks are accessible to most retail accounts and tend to make the most dramatic percentage gains.
This combination of filters takes the entire market and boils it down to just a handful of stocks already buzzing with activity. It's a targeted approach that lets you build a focused watchlist for the open instead of getting distracted by random noise.
Trader's Insight: Pay close attention to that pre-market volume. A stock gapping up on a few thousand shares is a major red flag—it could easily get smacked down at the open. High pre-market volume, on the other hand, shows genuine, widespread buying interest.
Crafting a Real-Time Mid-Day Breakout Scan
The action doesn't stop at 10 AM. All day long, stocks can break out of consolidation patterns on fresh news or a sudden surge of buying. To catch these moves as they happen, you absolutely need a real-time, mid-day scanner running.
This scan is less about overnight news and more about what's happening right now. Here’s a powerful configuration for finding these mid-day runners:
- Float: Once again, we're keeping this under 10 million shares.
- Relative Volume (RVOL): Set this to greater than 3. This is a non-negotiable filter. It compares current volume to the stock's average for that time of day. An RVOL of 3 means the stock is trading at 300% of its normal volume—a clear sign something unusual is going on.
- Percent Change from Open: Filter for stocks that are up at least +5%. This makes sure you're only looking at names that have already established solid upward momentum.
- Current Volume: A minimum of 250,000 shares helps weed out those ghost stocks that might show a high RVOL simply because their average volume is practically zero.
Globally, low float stocks are concentrated on major exchanges like the NASDAQ and NYSE, where platforms can get the best data. Traders often look for volume spikes—sometimes 1.5 times or more over a 90-day average—as a signal of strong momentum. For more on how these lists are compiled, you can explore the resources on LowFloat.com.
Here's what a properly configured scanner in ChartsWatcher can look like when it's dialed in to find these kinds of opportunities.
This clean view lets you instantly spot the tickers with high relative volume and significant price moves, streamlining your hunt for stocks that are breaking out.
By building and saving these scan configurations, you create a systematic workflow. You're no longer chasing tips or relying on luck. You're using a data-driven process to unearth the best low float stocks every single day. To take it a step further, check out our complete guide to using a stock screener for day trading. This methodical approach is what separates the pros from the hobbyists.
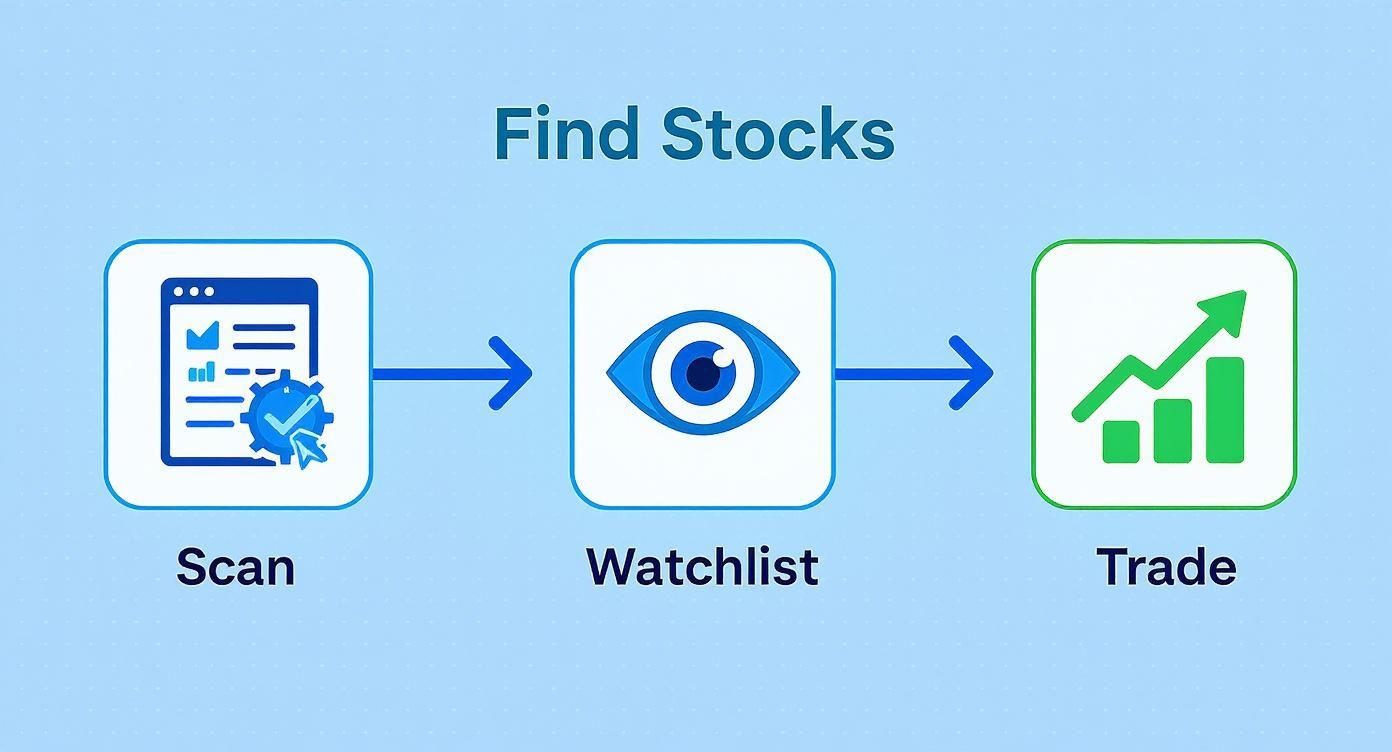
A Practical Workflow for Executing Your Trade
Okay, so your scanner just pinged you with a hot setup. That's the first step, but it's a long way from a profitable trade. What separates the pros from the rookies is having a disciplined, repeatable workflow for what comes next.
This isn't just about clicking "buy." It's about turning that initial alert into a professionally managed operation, from entry to exit. Without a clear plan, the volatility of these stocks will chew you up and spit you out.
Think of it like a funnel. You start with the entire market, narrow it down with your scanner, and then focus your capital on just the best setups that make it through your rigorous checks.
This methodical process is your best defense against making emotional, impulsive decisions when real money is on the line.
Sizing Up The Real-Time Battle
Before you even think about entering a trade, you need a live read on the supply and demand dynamics. This is where your trading platform’s Level 2 data and the Time & Sales window (often called "the tape") are indispensable.
Level 2 shows you the order book—all the buy and sell orders waiting at different prices. The tape, on the other hand, shows you every single trade as it executes, moment by moment.
Together, they tell a powerful story. Are huge buy orders stacking up on the bid, creating a potential floor of support? Or is a massive wall of sell orders appearing on the ask, ready to cap any upward move? The tape confirms what's actually happening. A stream of green prints means buyers are aggressively hitting the ask, while a flood of red shows sellers are dumping their shares.
Trader's Insight: I always look for a "thick" bid on Level 2, where you see a ton of large orders clustered around the current price. This can act as a temporary support level, offering a lower-risk entry point because it signals that big players are willing to defend that price.
Defining Your Entry and Exit Points
A trade without a plan is just a bet. Your workflow must include precise, pre-determined rules for when you get in, when you admit you're wrong, and when you take your profits. Leave emotion at the door.
Your entry should be triggered by a specific event from your strategy, like a stock smashing through a key resistance level on a big volume spike. But the second you're in, your stop-loss becomes the most important order you have. It’s your non-negotiable eject button if the trade turns sour.
Here are a few simple but effective rules to build into your plan:
- Setting a Stop-Loss: A classic approach is to place your stop just below the low of the breakout candle or a recent pivot low. This way, you’re risking a small, defined amount if your initial read on the stock was wrong.
- Planning Your Profit Targets: Don't just hope for the best. A solid rule of thumb is to take some profit off the table when the stock reaches a 2:1 reward-to-risk ratio. For example, if you risked $0.20 per share with your stop-loss, your first target to sell a portion of your shares would be $0.40 above your entry.
Actively Managing The Trade
Your job isn't done once you've entered the position. Active management means adapting as the trade develops. After you sell a piece of your position at that first profit target, the very next thing you should do is protect the rest of your shares.
A simple and powerful technique is to move your stop-loss up. Once you hit that 2:1 target, slide your stop-loss on the remaining shares up to your original entry price. Just like that, you've created a "risk-free" trade.
Now you can let the rest of your position run for a much bigger gain, knowing that the worst-case scenario is breaking even. This kind of disciplined, step-by-step execution is what professional trading in low float stocks is all about.
Common Questions About Trading Low Float Stocks
When you first dive into the world of low float stocks, a lot of questions pop up. It's one thing to understand the theory, but putting real money on the line brings a whole new level of detail to the forefront. Let's tackle some of the most common questions traders have, so you can build your confidence before you ever place a trade.
Think of this as your quick-reference guide. Getting these core concepts nailed down is non-negotiable for long-term success.
What Is the Best Time of Day to Trade Low Float Stocks?
The action is almost always hottest in the first one to two hours after the market opens (9:30 AM - 11:30 AM EST). This "morning rush" is where pre-market news and pent-up buying or selling pressure collide, often leading to the explosive moves we're looking for.
You might also see a spike in activity during the last hour of the session (3:00 PM - 4:00 PM EST), often called the "power hour." This is when traders are either closing out for the day or taking positions into the close. Trying to trade outside these windows can be a recipe for disaster; liquidity dries up, spreads widen, and you can get trapped in a position.
How Is Stock Float Different from Shares Outstanding?
This is a classic point of confusion for new traders, but the difference is critical. Shares outstanding is the total number of shares a company has issued. This includes shares held by insiders, institutions, and other restricted shares that can't be freely traded.
The float is the number that really matters to us. It’s a much smaller number representing only the shares available for trading on the open market by you, me, and every other retail trader.
A company can have a massive number of shares outstanding but a tiny float if insiders are holding most of the stock. It's the float—the actual supply—that dictates how volatile a stock can be.
Can I Hold Low Float Stocks Overnight?
You can, but it's incredibly risky and something I'd strongly advise against, especially if you're just starting out. Holding these stocks overnight, or swing trading them, exposes you to immense gap-down risk. These companies are notorious for dropping news after-hours or in the pre-market that can obliterate the stock price before you have a chance to react.
Imagine the company announces a dilutive secondary offering or bad clinical trial results at 8:00 PM. By the time the market opens at 9:30 AM, the stock could be down 50% or more, blowing right past any stop-loss you had set. The most successful low float traders are day traders for a reason—they're flat at the close, sleeping soundly while avoiding that unpredictable overnight risk.
Why Are Low Float Stocks Often Not Available to Short?
It all comes down to supply and demand. Many low float stocks are labeled "hard to borrow" (HTB) by brokers, meaning there's a very limited supply of shares available to lend out for short selling.
Here's why that happens:
- Limited Supply: By definition, a small float means there are just fewer shares in the system for brokers to get their hands on and lend out.
- High Demand: When a low float stock starts running, everyone wants to short it, thinking it's overextended. This high demand from other short sellers quickly snaps up the few shares that are available.
When a stock is hard to borrow, your broker will either charge you insanely high borrowing fees (which eat into your profits) or, more likely, won't allow you to open a new short position at all. This scarcity of shares to short is the very thing that can fuel a massive short squeeze.
Ready to stop chasing tips and start finding high-potential low float stocks with a data-driven process? ChartsWatcher provides the powerful, real-time scanning tools you need to build your own targeted watchlists and catch explosive moves as they happen.
