Learn How to Backtest Trading Strategy Effectively
The Foundations of Effective Strategy Backtesting

Developing a profitable trading strategy without backtesting is like navigating uncharted waters without a map. A brilliant trading idea is just the starting point. You need a reliable way to validate its potential. Backtesting bridges the gap between theory and practice, providing a critical assessment before you risk real capital. This systematic process of validation distinguishes consistently successful traders from those who struggle.
Why Backtesting Is Essential
Many aspiring traders rely on intuition and market hunches. However, markets are often unpredictable, and emotional decisions can lead to substantial losses. Backtesting introduces objectivity into the equation. It allows you to rigorously test your strategy using historical data, simulating real-world market behavior. This helps uncover hidden flaws and refine your approach before live implementation.
A key aspect of backtesting is using a diverse and representative data set. This ensures your results reflect a broad spectrum of market conditions, increasing the strategy's reliability. For example, using data only from currently active companies can create an overly optimistic view. This is because it ignores past failures. Including data from companies that have gone bankrupt or been liquidated paints a more realistic picture. A study might analyze historical data from the S&P 500 index from 2000-2022, encompassing both successful and failed companies. This comprehensive approach allows traders to assess their strategy's resilience. Learn more about data diversity and its importance for backtesting at Investopedia.
Avoiding Common Backtesting Pitfalls
Several misconceptions around backtesting can mislead traders. One frequent error is prioritizing maximum historical returns. This can cause overfitting, where a strategy excels on past data but underperforms in live trading. Another common mistake is overlooking transaction costs, like commissions and slippage. These seemingly small expenses can significantly erode profits. For further insights, check out this article on How to master backtesting trading strategies for better results.
Developing a Disciplined Mindset
Effective backtesting demands a disciplined and objective approach. It's more than simply tweaking parameters to achieve the highest returns. It involves critically examining the strategy's logic, understanding its strengths and weaknesses, and being willing to adapt as market conditions evolve. This process fosters a mindset centered on data-driven decisions, not emotional impulses – a hallmark of consistently successful traders. You can find more practical advice in this article on How to master backtesting trading strategies for better results. A rigorous, systematic approach to backtesting is crucial, and we'll delve deeper into this in the following section.
Sourcing High-Quality Historical Data That Won't Lie to You
The cornerstone of any reliable backtest is high-quality data. Faulty data will undoubtedly produce misleading results, rendering the entire backtesting exercise pointless. Even pricey data sources can harbor hidden biases, skewing results and creating artificially optimistic performance metrics. Understanding these potential problems is the first step towards building a backtest you can rely on.
Identifying and Eliminating Data Biases
One common pitfall is survivorship bias. This happens when data only includes currently successful companies, excluding those that have failed. This paints an overly positive picture of past performance. For example, a backtest on a specific stock index over the past 20 years must consider companies delisted due to bankruptcy or mergers. Their absence inflates the historical performance, creating a misleading impression of returns.
Look-ahead bias occurs when future information is inadvertently incorporated into a backtest. An example is using a stock's closing price when the strategy would only have access to the intraday price. This seemingly minor detail can significantly skew the outcome.
The Impact of Data Granularity
Data granularity—whether tick-by-tick, minute-by-minute, or daily—also profoundly affects results. Tick data offers the most detail, recording every price change, while daily data provides a broader perspective. The key is aligning data with trading style.
- If your strategy involves holding positions for days or weeks, tick data adds unnecessary complexity and could lead to overfitting.
- Conversely, for scalping small intraday profits, daily data lacks the necessary precision.
The following infographic illustrates the variations in data points expected with different time resolutions:
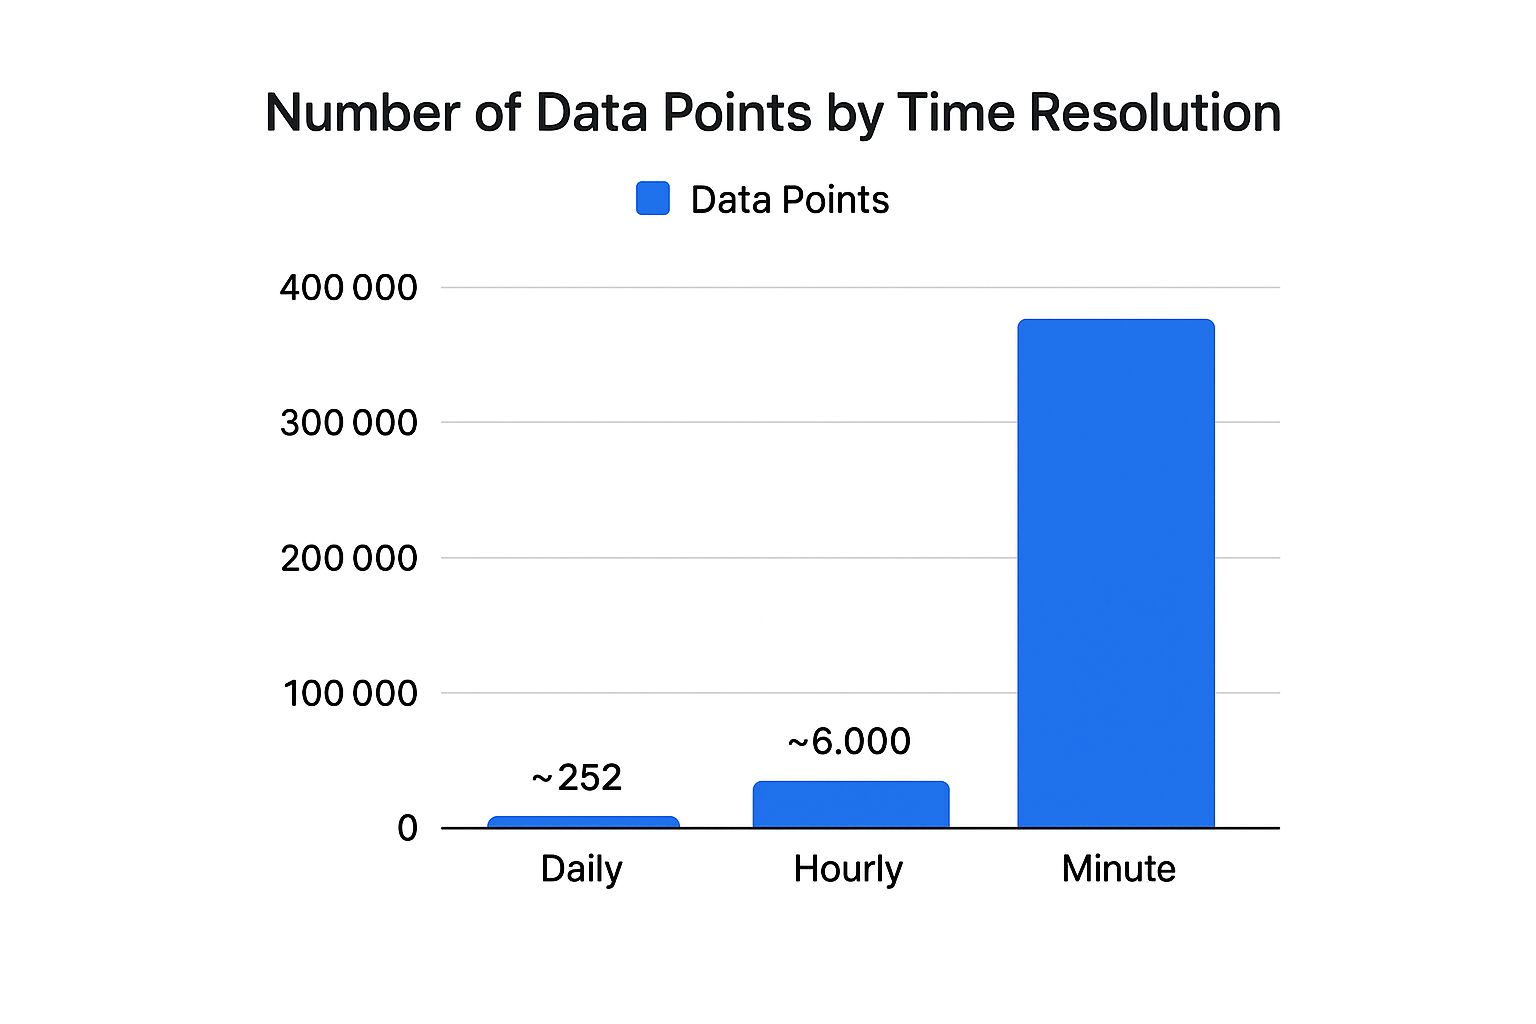
The number of data points increases significantly from daily to minute data, highlighting the importance of correct resolution for backtesting needs. Using excessively granular data for longer-term strategies can result in over-optimization and poor live trading performance.
To help you choose the right data source for your needs, let's compare a few options:
Comparison of Historical Data Sources Evaluates different data providers based on cost, data quality, historical range, and market coverage.
| Data Source | Cost | Data Quality | Historical Range | Market Coverage | Data Types |
|---|---|---|---|---|---|
| Example Source A | Varies | High | 20 years | US Equities | Tick, Minute, Daily |
| Example Source B | Free/Subscription | Medium | 10 years | US Equities, Forex | Daily, Hourly |
| Example Source C | Subscription | High | 30 years | Global Equities | Tick, Daily |
This table illustrates how different data sources can vary significantly in their offerings. Consider your budget, the required data quality, and the markets you're interested in when making your choice. While Example Source C offers the longest historical range and global coverage, it comes at a subscription cost. Example Source B might be suitable for those on a budget but has a shorter historical range and medium data quality.
Choosing the right data source can significantly impact the accuracy and reliability of your backtests. Be sure to thoroughly research the options and select the source that best aligns with your specific requirements.
Handling Real-World Data Complications
Experienced traders know real-world data is not always clean and easily accessible. Data gaps, corporate actions (like stock splits and dividends), and other issues can greatly impact backtest accuracy. Addressing these problems is critical.
For instance, consider how a stock split affects backtested entry and exit points. Ignoring such details creates a disconnect between simulated results and actual market activity. Data Analysis Methods Research offers additional information on statistical approaches for handling such complexities.
By tackling these challenges directly, you can develop a stronger, more realistic backtesting strategy. This ultimately bridges the gap between simulated and real-world profits. This focus on data integrity sets the stage for the next critical step: designing your backtesting environment.
Building Your Backtesting Laboratory
A robust backtesting environment is essential for evaluating the effectiveness of any trading strategy. This section offers a practical guide to help you select and configure the tools best suited to your individual trading style and technical skills. A poorly configured backtesting setup can lead to skewed results and, consequently, poor trading decisions.
Choosing The Right Backtesting Platform
The first step in building your backtesting "laboratory" is choosing the right platform. There are various platforms available, each with its own advantages and disadvantages. Open-source platforms like Backtrader and Zipline in Python offer flexibility and customization. These are great options for traders comfortable with coding who require highly specialized features. However, there's a steeper learning curve involved.
Commercial platforms such as TradeStation and MetaTrader provide user-friendly interfaces and often include integrated data feeds and charting tools. They're a good fit for traders who prioritize ease of use and prefer a more visual approach. However, customization might be more restricted than with open-source options.
Essential Configuration Details
Even with a top-tier platform, incorrect configuration can invalidate your backtesting results. It's essential to consider these key aspects:
-
Slippage Modeling: Slippage, the difference between the expected price of a trade and the price at which it's actually executed, is an unavoidable part of live trading. Your backtesting system must realistically account for slippage based on your strategy’s execution speed and market volatility. Not accounting for slippage can lead to overly optimistic results.
-
Commission Structures: Commissions can significantly impact profitability, especially for high-frequency trading strategies. Accurately representing commission costs in your backtests is essential for realistic profit calculations.
-
Execution Assumptions: How your orders are filled in live markets needs to be accurately reflected in your backtests. Are you working under the assumption that market orders are filled instantly at the current price? Are you modeling limit orders, which might not be filled at all? These assumptions must align with your real-world trading methods.
Creating Realistic Testing Conditions
Professional strategy developers stress the importance of creating realistic testing conditions. This involves replicating actual market mechanics as opposed to overly simplified scenarios. For example, modeling liquidity constraints and factoring in elements like order book depth can significantly improve the accuracy of your backtests.
High-quality historical data is crucial for effective backtesting, helping to eliminate bias in your results. For a deeper look into statistical approaches, consider reading this article on Data Analysis Methods Research. This attention to detail helps ensure that your backtest results accurately reflect potential real-world performance.
Avoiding Costly Surprises
By carefully considering these configuration details and focusing on realistic market simulation, you can build a reliable backtesting environment. This allows for trustworthy evaluation of your trading strategies and minimizes the risk of unwelcome surprises when transitioning to live trading. This preparation forms the foundation for designing backtests that accurately predict future performance, which is the topic of the next section.
Designing Backtests That Actually Predict Future Performance
Creating a backtest that boasts impressive historical returns can be thrilling. However, the unfortunate truth is that many of these strategies falter when put into practice in live markets.
This often happens because the strategies are overfitted to the historical data. In other words, they perform exceptionally well on past data but struggle with new, unfamiliar data. This section delves into how to sidestep this pitfall and design backtests that offer genuine predictive value for future results.
Avoiding the Overfitting Trap
Overfitting occurs when a trading strategy is too closely molded to the specific details of historical data. It’s similar to crafting a key that perfectly unlocks one lock but fails to open any others.
This scenario arises when a strategy becomes overly complex, capturing irrelevant noise and random fluctuations in the data instead of genuine market patterns.
For instance, a strategy might identify a seemingly lucrative pattern based on specific price movements over a short timeframe. However, this "pattern" could simply be random noise, unlikely to reappear in the future. A simpler, more robust strategy based on wider market trends would likely be more dependable.
Advanced Validation Techniques
Seasoned traders utilize advanced techniques to evaluate a strategy’s resilience and predictive ability. Walk-forward analysis is one such method.
It involves splitting the historical data into separate segments. The strategy is optimized using one segment and then tested on the following segment, mimicking real-world deployment. This process repeats across multiple segments, offering valuable insights into the strategy’s performance under diverse market conditions.
Another potent technique is Monte Carlo simulation. This involves executing thousands of simulations with slightly adjusted data, incorporating random variations. This assesses the strategy’s ability to withstand unexpected market swings and helps uncover potential vulnerabilities.
Building Robust Trading Rules
To accurately forecast future performance, concentrate on developing robust trading rules that aren't overly sensitive to small data variations. This entails:
-
Focusing on broader market trends: Rather than pursuing short-term price swings, ground your strategy on fundamental principles or recognizable, recurring patterns.
-
Keeping it simple: Avoid excessively complicated rules with numerous parameters. Simpler strategies are less susceptible to overfitting and are easier to comprehend and manage.
-
Validating across different market environments: Confirm that the strategy consistently performs well across varied market conditions, including bull and bear markets and periods of high and low volatility.
Learn more in our article about How to backtest a trading strategy: an essential guide.
Frameworks for Predictive Power
By integrating these advanced validation techniques and prioritizing robustness, traders can go beyond simply fitting past data. This shift towards authentically predicting future performance necessitates a more disciplined and systematic approach to backtesting. This facilitates the development of strategies better equipped to succeed in the complexities of live trading, where market conditions continuously shift.
You might also be interested in: How to master backtesting trading strategies for better results. This approach ultimately increases the likelihood of converting backtested profits into actual gains. This thorough process helps cultivate strategies that are resilient and adaptable to the constantly changing dynamics of the market, improving the chances of achieving consistent profitability in the demanding world of trading.
Reading Between the Numbers: Interpreting Backtest Results
Successfully backtesting a trading strategy requires a deeper dive than simply glancing at the final profit number. It demands a nuanced understanding of various performance metrics to uncover the true potential and hidden risks of your approach. Chasing high returns without a thorough analysis can be misleading, often concealing flaws that could lead to substantial losses in live trading. This section focuses on effectively interpreting backtest results, going beyond basic profit analysis toward a more sophisticated evaluation.
Beyond Basic Profit: Key Performance Metrics
Profit is the ultimate goal, but focusing solely on it can be deceptive. A strategy might appear profitable in a backtest because of a few fortunate trades, even while exhibiting underlying weaknesses. Therefore, risk-adjusted metrics are crucial for a clearer understanding. Consider incorporating insights from proven automation testing strategies when interpreting backtest results. This careful assessment is essential to prevent costly errors in live trading.
For instance, the Sharpe Ratio measures risk-adjusted return. A higher Sharpe Ratio generally indicates stronger performance. The Risk-Reward Ratio (RRR) shows the potential profit relative to potential loss. An RRR of 3:1 signifies a potential gain of three dollars for every dollar risked. These metrics provide a more comprehensive evaluation than profit alone, helping differentiate between consistent profitability and random luck.
When backtesting a trading strategy, metrics like the Sharpe Ratio and Risk-Reward Ratio (RRR) are key to evaluating its effectiveness. The Sharpe Ratio assesses the strategy's risk-adjusted return, providing insights into whether returns are due to sound investment decisions or simply chance. A high Sharpe Ratio, such as 1.5, suggests better risk-adjusted performance than a ratio of 0.5. Meanwhile, the RRR determines if potential gains outweigh potential losses. An RRR of 3:1, where three dollars are returned for every dollar risked, is generally favorable. Find more detailed statistics here. Traders rely on these metrics to assess strategy efficiency before live trading.
To understand how these metrics play a role in evaluating backtests, let's look at the following table:
Essential Performance Metrics for Strategy Evaluation
Key metrics to analyze when evaluating backtest results, with explanation of what each measures and target values.
| Metric | What It Measures | Ideal Values | Warning Signs | Calculation Method |
|---|---|---|---|---|
| Sharpe Ratio | Risk-adjusted return | > 1 | < 0 | (Average Return - Risk-Free Return) / Standard Deviation of Returns |
| Risk-Reward Ratio (RRR) | Potential profit relative to potential loss | > 2:1 | < 1:1 | (Potential Profit) / (Potential Loss) |
| Maximum Drawdown | Peak-to-trough decline during a specific period | As low as possible | Large, frequent drawdowns | (Peak Value - Trough Value) / Peak Value |
| Recovery Period | Time taken to recover from a drawdown | As short as possible | Prolonged recovery | Time from trough to new peak |
| Win Rate | Percentage of winning trades | Not solely reliant on this; consider average win/loss size | High win rate with small wins and large losses | (Number of Winning Trades) / (Total Number of Trades) |
Analyzing these metrics helps determine if a strategy is truly effective or just riding a wave of good fortune.
Analyzing Equity Curves and Trade Distributions
Equity curves visually depict the growth of a trading account over time. A smooth, upward-sloping curve indicates consistent profitability. Sharp drops or extended flat periods, however, suggest potential issues.
Analyzing the distribution of trades is equally vital. A large number of small losses offset by a few substantial wins can mask hidden risks. Such an uneven distribution might not be sustainable in the long term. Understanding these patterns helps identify potential issues early on. This in-depth analysis provides valuable context for overall performance interpretation.
Drawdowns and Recovery Periods: The Mark of Resilience
Experienced traders often focus on drawdowns, the peak-to-trough decline in account value, and recovery periods, the time to regain previous highs. A strategy with frequent, deep drawdowns or slow recovery periods can be mentally taxing. This is especially true in live trading where emotions can influence decisions.
Emotional resilience is as critical as statistical performance. Understanding personal risk tolerance and selecting a strategy that can be confidently executed through challenging periods is paramount. This practical aspect distinguishes successful traders from those who abandon their plans.
Distinguishing Edge from Noise: The Objective Evaluation
Backtesting aims to identify a genuine edge, a statistically significant market advantage. However, seemingly positive results can stem from random chance or statistical noise. This is especially true with limited historical data.
Rigorous statistical analysis is crucial for determining the true significance of results. This objective evaluation demands discipline and a data-driven approach, essential for long-term trading success.
Bridging the Gap: From Backtest Success to Live Trading
A successful backtest is a significant milestone, but it's just the first step. The true challenge lies in transitioning your strategy from simulated historical data to the live market. This is where many promising strategies fall short. This section provides a practical framework for navigating this crucial transition, borrowing techniques from professional trading firms.
The Importance of Paper Trading
Forward performance testing, often called paper trading, is essential. It involves simulating trades in real-time market conditions without risking real capital. This allows you to practice executing your strategy, become familiar with its nuances, and uncover any unforeseen issues.
For example, a trader might backtest a strategy from 2010-2020 and then paper trade it from 2021-2022. This tests the strategy's performance in more recent market conditions. This is critical for determining if past success can be replicated. Backtesting isn't just about historical data; it includes this forward-looking element. Sticking to your strategy's rules during paper trading is vital for accurate results. Learn more about forward performance testing here.
However, paper trading has its limitations. While it helps refine execution and identify psychological challenges, it can't fully replicate the emotional pressures of trading with real money.
Psychological Challenges and Execution Issues
Trading psychology plays a major role in the transition to live trading. In backtests, decisions are made based purely on data without the fear of financial loss. Live trading introduces emotions like fear and greed, which can lead to impulsive decisions and deviations from your strategy.
Issues not present in backtests can also arise in live trading. Slippage, the difference between the expected price and the actual execution price, and commissions can affect profitability. Technical problems with your trading platform or internet connection can also disrupt strategy execution.
Progressive Implementation and Real-Time Monitoring
To manage these risks, professional traders often use progressive implementation. This involves gradually increasing position sizes as the strategy proves itself in live markets. Starting small builds confidence and minimizes potential losses if the strategy initially underperforms.
Position scaling is another risk management technique. It involves adjusting position sizes based on market volatility or other predefined criteria. This dynamic approach helps protect capital during periods of heightened uncertainty.
Real-time performance monitoring is essential during this transition. Tracking key metrics like drawdown and win rate can reveal whether the strategy is performing as expected or needs adjustments. This vigilance ensures the strategy remains aligned with market conditions and its objectives.
Warning Signs and Strategy Degradation
It's important to remember that market conditions are constantly changing. A strategy that performed well in backtesting and initial live trading can deteriorate over time. Continuously monitoring performance and adapting your strategy is essential for long-term success.
Warning signs of strategy degradation include:
- Increased frequency and severity of drawdowns
- Declining win rate
- Slippage exceeding backtested estimates
- Consistent underperformance compared to backtest results
These signs indicate the strategy may be losing effectiveness and requires review or modification.
Successfully transitioning from backtest to live trading demands careful planning, disciplined execution, and continuous monitoring. By understanding the challenges and adopting professional strategies, you can improve your chances of turning backtested profits into real gains.
Ready to enhance your trading? ChartsWatcher offers advanced charting, scanning, and analysis tools to empower your trading decisions. Explore the power of ChartsWatcher today.
