How to Use a Stock Screener to Find Investments
Think of the stock market as a massive, sprawling library with millions of books. Trying to find the right one by hand would be impossible. A stock screener is your personal, high-tech librarian—it listens to exactly what you're looking for and instantly pulls a curated list of stocks that fit your criteria.
You simply tell it what you want, whether it's companies with low P/E ratios, explosive revenue growth, or anything in between, and it sifts through thousands of options to find your perfect matches.
Why Stock Screeners Are a Modern Investor's Edge
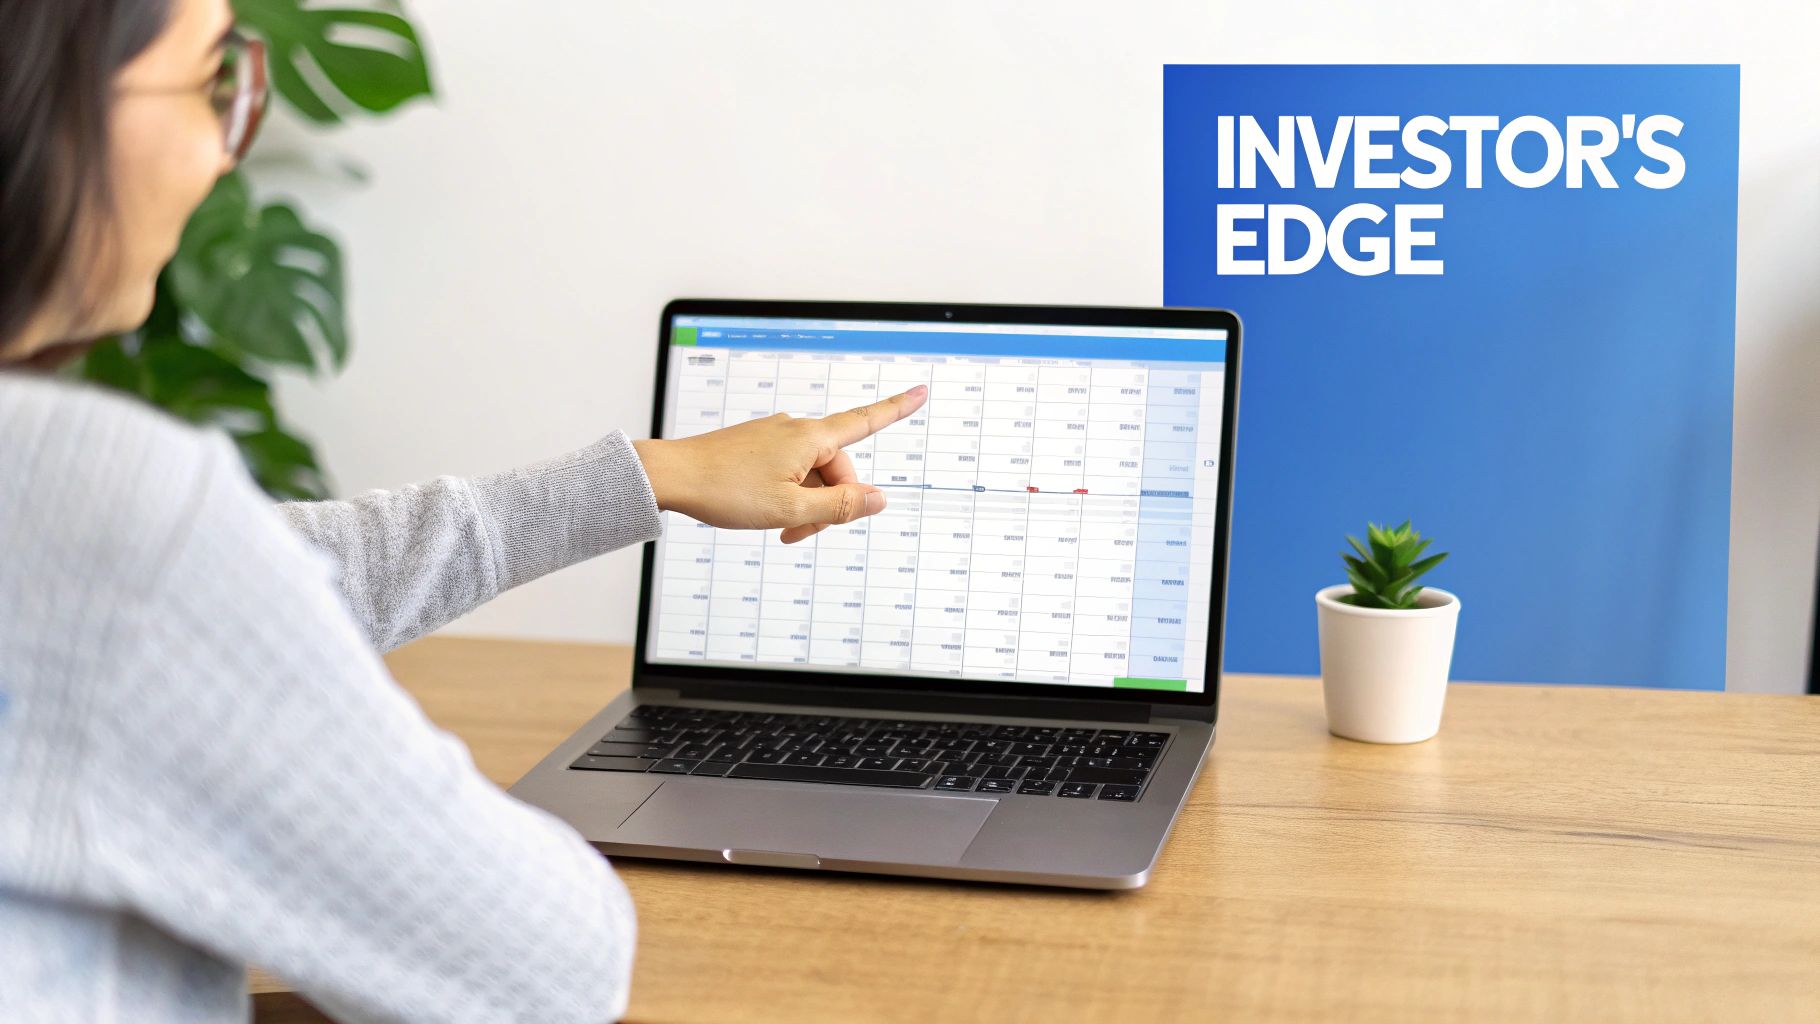 The image above shows a classic screener in action. You can see how raw data—like market cap and P/E ratios—is organized into a clean, scannable format, turning a mountain of information into actionable insights.
It's easy to feel like you're drowning in a sea of thousands of publicly traded companies. This is where a stock screener becomes an indispensable tool. It’s the difference between blindly panning for gold and using a state-of-the-art metal detector to find exactly where to dig.
Forget chasing hot stock tips or letting market noise dictate your decisions. A good screener forces you to be disciplined and intentional. It empowers you to set precise, data-driven rules based on your investment philosophy, whether you’re a value hunter searching for hidden gems, a growth investor chasing disruptors, or someone focused on steady dividend income.
If you're just getting started, our guide on https://chartswatcher.com/pages/blog/what-is-a-stock-screener-boost-your-investing is a great place to build a solid foundation.
The Power of Data-Driven Decisions
At its core, a stock screener is a filtering engine. The best ones can comb through companies on major global exchanges like the NYSE and NASDAQ, often analyzing over 20 years of historical performance data. This is huge. It means you can actually backtest your screening criteria against past market cycles to see how your strategy might have performed, giving you a bit more confidence before putting real money on the line.
The approach is similar to how marketers analyze consumer data; just as they benefit from understanding the nuances between passive listening and active monitoring, investors can use screeners to actively monitor the market for specific signals instead of just passively watching prices go up and down.
The biggest win here is the incredible amount of time you save. More importantly, it gives you a competitive edge, helping you spot opportunities that the broader market might be ignoring.
A screener isn't just a filter; it's your personal discovery engine for building a smarter portfolio. It systemizes your approach, ensuring every potential investment passes your initial quality checks before you spend time on deeper analysis.
This methodical process pays off in a few key ways:
- Emotional Discipline: It forces you to stick to a rules-based system, which is the best defense against making impulsive trades based on hype or fear.
- Broad Market Coverage: You can scan entire markets for hidden gems in minutes—a task that would be physically impossible to do manually.
- Customized Strategies: You can mix and match dozens of metrics to build screens that perfectly align with any investment style, from deep value to aggressive growth.
Honestly, learning to effectively use a stock screener is one of the most valuable skills a modern investor can develop. It fundamentally changes how you find and evaluate potential investments.
Key Stock Screener Metrics and What They Mean
When you first open a stock screener, you'll be greeted by a long list of metrics. Don't let it intimidate you! Most of them fall into a few key categories. Here’s a quick-reference table to help you get started with the most common ones you'll encounter.
| Metric Category | Example Metric | What It Tells You |
|---|---|---|
| Valuation | Price-to-Earnings (P/E) Ratio | Shows how much investors are willing to pay for each dollar of a company's earnings. A low P/E might suggest a stock is undervalued. |
| Growth | EPS Growth (YoY) | Measures the year-over-year growth in a company's earnings per share. High growth is often a target for growth investors. |
| Profitability | Return on Equity (ROE) | Indicates how efficiently a company is using shareholder money to generate profits. Higher is generally better. |
| Financial Health | Debt-to-Equity Ratio | Compares a company's total debt to its shareholder equity. A high ratio can signal financial risk. |
| Dividends | Dividend Yield | The annual dividend per share divided by the stock's price. Income investors look for stable, high yields. |
| Technical Indicators | 52-Week High/Low | Shows the stock's price range over the past year. A stock near its 52-week high may have strong upward momentum. |
This table is just a starting point. As you get more comfortable, you can start combining these metrics to create powerful, custom screens that fit your unique investment goals.
Building Your First Foundational Stock Screen
Jumping into an advanced stock screener like ChartsWatcher for the first time can feel like sitting in an airplane cockpit—a dizzying array of buttons, dials, and settings. It's easy to get overwhelmed. The key is to ignore most of them, at least for now, and focus on building a simple, foundational screen that actually finds something useful.
Let's get practical and build one together from the ground up.
The most critical part of this process happens before you touch a single filter: you have to define your goal. What are you actually looking for? Without a clear objective, you're just clicking buttons and wasting time.
For this real-world scenario, our goal is to find established, fundamentally sound technology companies that aren't excessively expensive.
That single sentence is our mission statement. It gives us three clear, actionable filters to start with:
- Established: This points to company size and stability.
- Technology Companies: This defines our universe of stocks.
- Not Excessively Expensive: This tells us we need a valuation metric.
With our goal defined, it's time to translate it into specific criteria.
Setting Your Core Filters
The first filter we'll apply is for company size, which we can easily measure using Market Capitalization. This is just a company's stock price multiplied by its number of outstanding shares. To find "established" players, we want to filter out the small, volatile upstarts and penny stocks.
A great starting point is to set the Market Cap to "> $10 Billion." This instantly weeds out thousands of smaller companies, focusing our search on large-cap businesses that are generally more stable and have a proven track record.
Next, we need to isolate our target industry. Screeners let you filter by broad Sectors and more specific Industries. For our goal, we'll simply select the 'Technology' sector. This is a straightforward but crucial step to make sure every result is relevant.
Just by applying these two filters—Market Cap and Sector—we've likely cut down the entire market of over 9,000 US stocks to just a few hundred. That’s the raw power of a screener. We’ve eliminated over 95% of the noise in two clicks.
Adding a Valuation Layer
Our list is much smaller now, but it still contains a mix of companies at all sorts of price points. Some might be wildly overvalued growth darlings, while others could be reasonably priced. This brings us to our third criterion: finding companies that are "not excessively expensive."
One of the most common valuation metrics is the Price-to-Earnings (P/E) Ratio. It gives you a quick read on how much you're paying for one dollar of a company's earnings. It’s not perfect, but it’s a fantastic first-pass filter for a value-oriented screen.
To filter out the speculative froth, we can set our P/E Ratio to "Under 20." Historically, a P/E below 20 has often been seen as a reasonable valuation for a stable company. This helps us sidestep the high-flying tech stocks trading at 50x or 100x earnings, keeping us aligned with our "fundamentally sound" objective.
Your first screen isn't about finding the perfect stock instantly. It's about building a solid, reusable template that filters out the irrelevant noise. What you're left with is a manageable, high-quality list ready for deeper research.
This foundational screen is now complete. Let's see what we've built.
| Filter | Setting | The "Why" Behind It |
|---|---|---|
| Market Cap | > $10 Billion | Focuses on large, established companies, reducing volatility risk. |
| Sector | Technology | Narrows the universe to the specific industry we want to analyze. |
| P/E Ratio | < 20 | Filters for reasonably valued companies, avoiding speculative excess. |
The result? Instead of thousands of stocks, you might have a list of 10, 20, or maybe 50 companies. This is no longer a haystack. It’s a curated list of potential candidates that all meet our basic requirements. From here, the real work of analyzing each company individually can begin. The screener has done its job perfectly by pointing you in the right direction.
With a solid foundational screen in place, you’ve successfully cut through the market noise. Now it's time to get surgical. This is where you move from broad strokes to a fine-tipped brush, layering different data types to paint a much sharper picture of your ideal investment.
Think of it as adding nuance. A basic screen finds companies that meet simple criteria, like being a large-cap tech stock with a decent P/E ratio. An advanced screen, however, finds companies that are not only cheap but also growing, profitable, and showing signs that the market is starting to take notice.
Combining Value with Growth Metrics
Let's build on our last example. We found some established tech companies that weren't outrageously expensive. But what if we also want to make sure these companies are actually expanding? A cheap company that’s shrinking is often a value trap waiting to spring.
To dodge this, we can layer on a growth metric. A great one to add is '5-Year Revenue Growth > 15%.'
By tacking on this filter, we’re telling the screener, "Show me those cheap, big-name tech companies that have also proven they can consistently grow their sales over the long haul."
This one simple addition completely transforms the screen. It weeds out the stagnant giants and spotlights businesses that are both well-priced and dynamic. The key is finding that balance—you want criteria strict enough to matter but not so restrictive that you filter out every single stock on the market.
Integrating Technical Indicators for Timing
Fundamentals tell you what to buy. Technicals can help you decide when to buy.
By layering a technical indicator onto your fundamental screen, you can pinpoint strong companies that are just temporarily out of favor with the market. This is the classic "buy the dip" scenario in action.
For instance, let's add a filter for the Relative Strength Index (RSI), a go-to momentum indicator for many traders. An RSI reading below 30 is often considered "oversold." We'll be a bit more flexible to catch more opportunities.
Let’s try adding 'RSI (14) < 40' to our screen. Now, our query is searching for:
- Large-cap tech companies...
- With a P/E ratio under 20...
- That have grown revenue over 15% annually for five years...
- And are currently showing signs of being oversold.
See how much more powerful that is? We're now hunting for a very specific setup: a fundamentally sound growth company that just might be on sale. To explore more of these powerful filter combinations, check out our guide on the top 8 best stock screener settings for stock success.
This infographic shows the basic layering process of narrowing down the market.
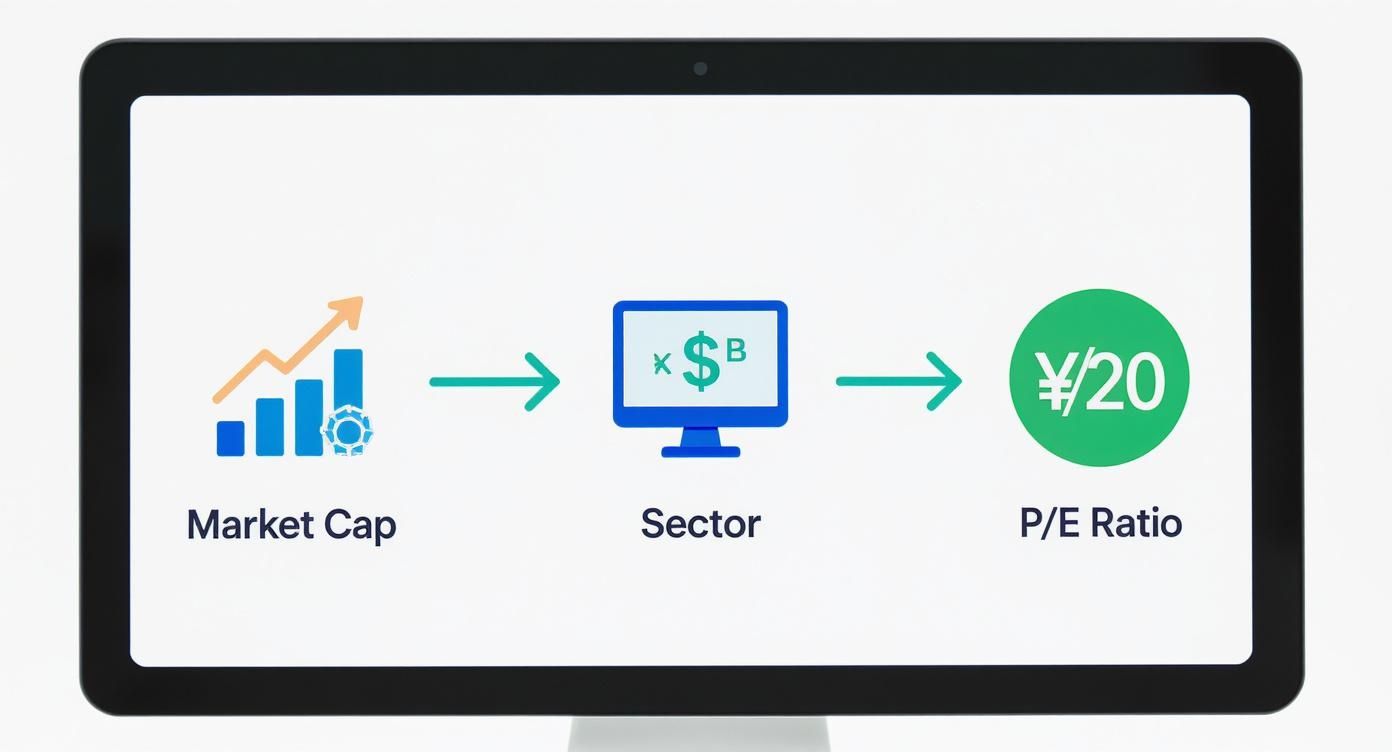
As you can see, each filter you add dramatically shrinks the pool of candidates, leaving you with a manageable list of stocks that actually meet your core strategy.
Mastering Nuanced Queries with AND/OR Logic
Most serious screeners let you use logical operators like AND and OR to build more flexible, creative queries.
The AND operator is usually the default—it forces a stock to meet all of your criteria. But the OR operator is where things get interesting, as it allows a stock to meet just one of several conditions you set.
Imagine you're looking for highly profitable companies but you're flexible on the exact metric. You could set up a condition like this:
(Return on Equity > 15%) OR (Return on Invested Capital > 12%)
This query will find companies that are highly efficient with either shareholder money OR their total capital. It broadens your search just enough to catch quality names without lowering your standards.
Pro Tip: Use 'OR' logic to group similar metrics, like different measures for growth or profitability. This is a great way to catch quality companies that might fail one specific test but ace a closely related one.
Creating Custom Formulas for Ultimate Precision
The true power users eventually learn to write their own custom formulas. This unlocks the ability to screen for conditions that aren't available as pre-built filters.
For instance, what if you want to find strong momentum stocks that are just off their yearly peak, potentially offering a small pullback entry?
You could create a custom formula like this:
Price >= 0.95 * 52-Week High
This filter will find every stock currently trading within 5% of its 52-week high. It’s a classic momentum screen designed to find stocks in a powerful uptrend that might be about to break out again.
The ability to create these custom rules is what separates a casual user from an expert. It lets you test very specific hypotheses about what's working in the market. The sheer volume of data these tools process is staggering; some screeners cover over 160,000 stocks worldwide. This allows you to run incredibly precise searches, like finding European banks with a P/E below 10 or Asian consumer goods companies with a dividend yield above 2%.
By learning to layer fundamental, technical, and custom filters, you transform your stock screener from a simple search tool into a sophisticated discovery engine.
How to Analyze and Interpret Your Screener Results
Getting a list of ten or twenty stocks from your screener is a huge step forward, but it's critical to remember what that list really is. It’s not a shopping list; it’s a research list. This is where the algorithm’s job ends and your critical human analysis begins.
A raw output tells you which companies met your quantitative rules. It doesn't tell you why they met them or if there's a hidden story behind the numbers. A stock might look cheap on paper for a very good reason—like pending litigation or a failing product line. Your job now is to dig into the context.
Start With Relative Comparison
Before you dive deep into any single company’s annual report, start by pitting the shortlisted stocks against each other. Your screener probably laid out the results in a nice, neat table. Use it to your advantage by sorting the list by different columns to see which companies really pop.
Who has the best profit margin? Sort by that column. Who’s carrying the least amount of debt? Sort again. This simple act of relative comparison often reveals the strongest and weakest candidates in your group almost instantly.
- Profitability Check: Sort by metrics like Operating Margin or Return on Equity (ROE). A company that consistently leads its peers in profitability often has a strong business model or a serious competitive advantage.
- Health Check: Now, sort by Debt-to-Equity or the Current Ratio. This is a quick way to spot companies that might be overleveraged, adding a layer of risk you might want to avoid.
- Valuation Check: A quick sort by the P/E Ratio or Price-to-Sales (P/S) Ratio gives you a gut feeling for which companies are the most or least expensive relative to the others on your list.
This initial culling process helps you focus your energy on the most promising one or two names, rather than getting lost trying to research a dozen companies at once.
Perform a Quick Sanity Check
Once you've zeroed in on a top candidate from your relative comparison, it’s time for a qualitative "sanity check." This is a rapid-fire investigation to uncover any obvious red flags that the numbers couldn't show you. This whole process shouldn't take you more than 15-20 minutes per stock.
First, just pull up a simple one-year price chart. You're not doing complex technical analysis here; you're just looking for big, glaring issues. Is the stock in a freefall? Has it been dead money for years? A quick glance at the chart provides essential context for the numbers you're seeing.
Next, do a quick news search for the company name. What have the headlines been for the last few months? Are they launching a new product? Did they just lose a major customer? Is there a big management shake-up? This step helps you understand the story behind the stock's recent performance.
This screenshot shows how a screener can offer a bird's-eye view of market health.
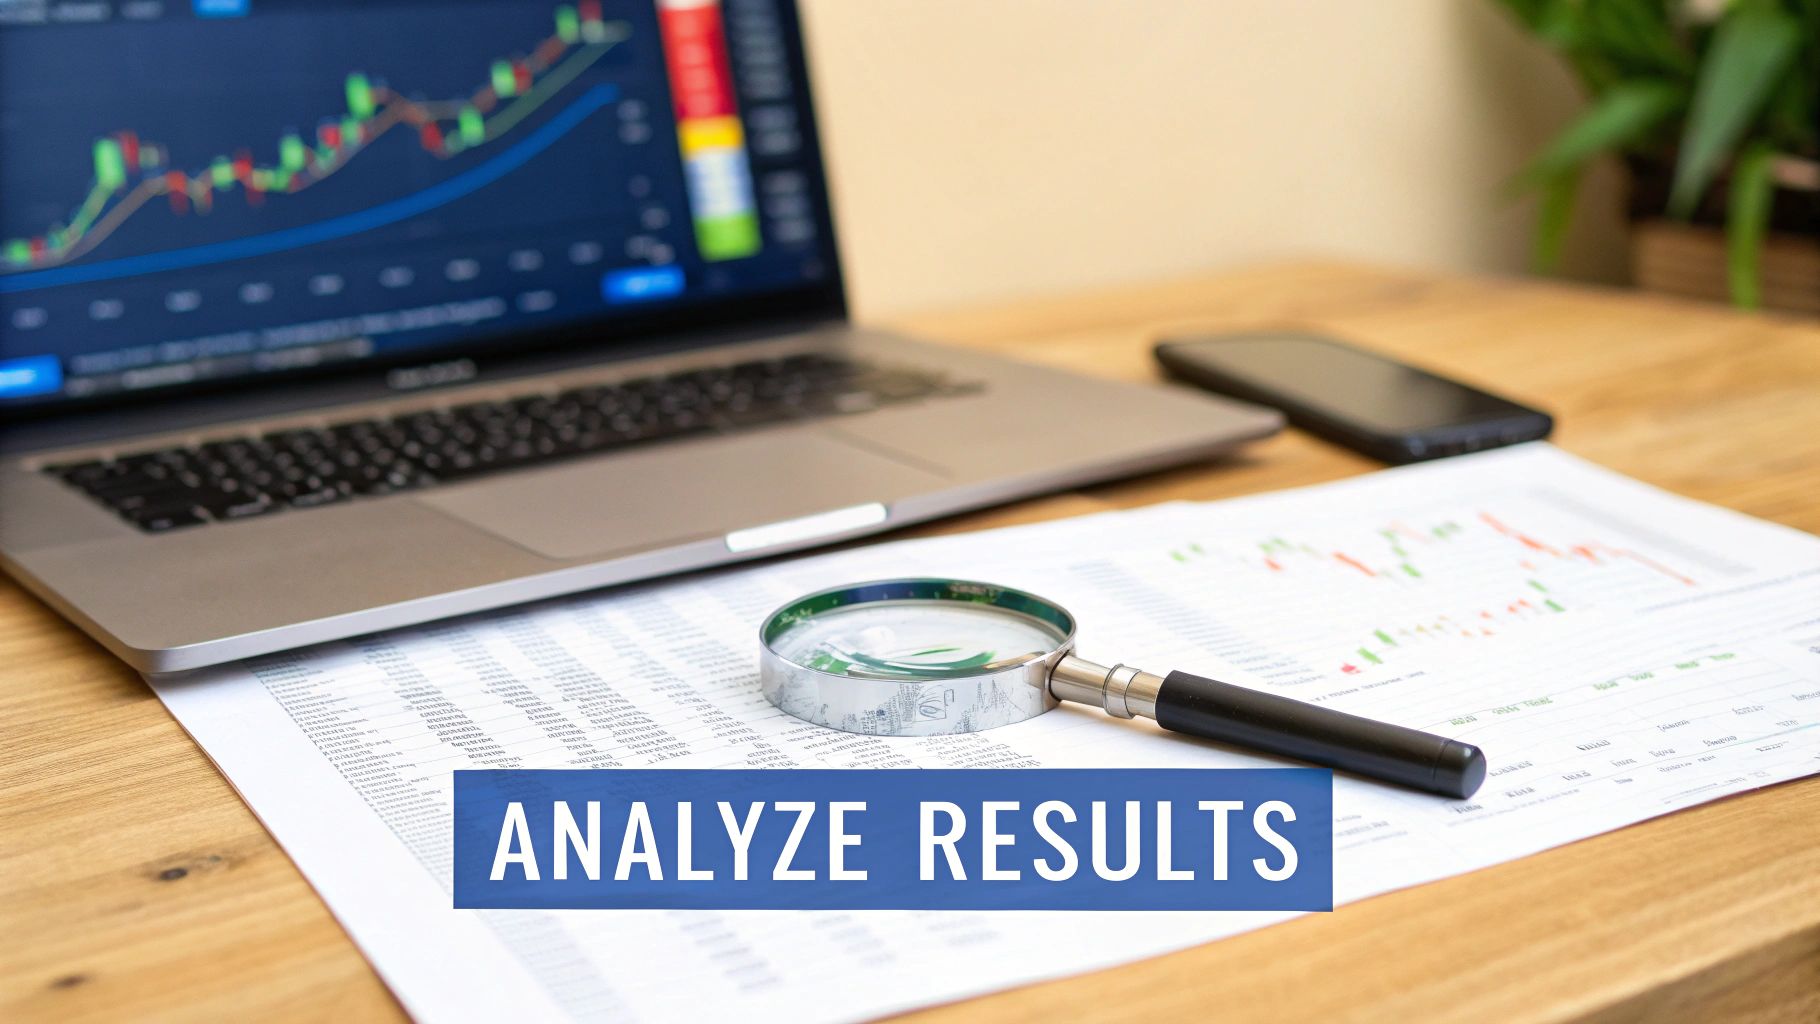
This kind of summary data reveals broad market sentiment, which provides crucial context for your individual stock analysis.
Understanding Broader Market Context
Your screener isn't just for finding individual stocks; it's also a powerful tool for gauging the health of the entire market. For instance, some platforms can segment the market into advancing and declining stocks, which recently showed 54.9% advancing versus 41.4% declining.
Metrics like stocks hitting new highs (32.1%) versus new lows (67.9%) also paint a clear picture of market momentum. These percentages provide a snapshot into market breadth, which is critical for understanding if you're swimming with or against the current. You can explore more real-time market data on sites like Finviz.
The goal is to develop a critical eye, transforming you from a passive screener user into an active, thinking investor. The screener provides the data; your job is to provide the wisdom and interpretation.
Finally, look up analyst ratings. While you should never base a decision solely on what analysts say, their consensus can be a useful data point. If a dozen analysts rate a stock as a "Strong Buy," it's worth noting. Conversely, if the consensus is "Sell," you should definitely try to understand why.
By the end of this process, you will have moved from a generic list of stocks to a deeply vetted, high-potential candidate. You'll know not just that it met your criteria, but you'll have a much clearer picture of the business itself and its current place in the market.
Turn Your Screens Into a Long-Term Strategy
A powerful stock screener isn't something you just use once and forget about. If you want a real edge, you need to make screening an efficient, repeatable part of your investing workflow. This is how you shift from running one-off searches to building a dynamic system that consistently surfaces opportunities.
The first and most important habit to build is saving your successful screens. Any good screener, including the one in ChartsWatcher, lets you save a specific set of filters as a template. It's a simple click, but it saves an incredible amount of time and lets you re-run your best queries in seconds.
Build a Library of Screens for Every Market
Don't just save one screen. The pros build a small library tailored to different market conditions. The market is never static, so why should your search methods be?
Think about creating a few distinct screens for specific scenarios:
- 'Bear Market Value' Screen: You'd want this one to focus on fortress-like balance sheets (low Debt-to-Equity) and dirt-cheap valuation metrics (P/E < 10, P/B < 1). The goal here is to find deeply discounted, resilient companies that can weather a storm.
- 'Bull Market Momentum' Screen: In a roaring bull market, your priorities shift. This screen would look for high revenue growth, strong relative strength (RSI > 60), and stocks pushing up against their 52-week highs.
Having these on hand means you can pivot your strategy with the prevailing market winds in a single click, keeping your search relevant and effective.
Let the Screener Do the Heavy Lifting with Alerts
This is a major efficiency hack. Instead of manually running your screen every single day, set up alerts. Most advanced screeners can be configured to notify you the moment a new stock meets your criteria.
This flips the entire process on its head. You’re no longer actively hunting for opportunities; the opportunities are being delivered straight to your inbox. It’s a way to passively monitor the entire market without being glued to your computer.
For any investor serious about long-term success, getting a handle on data-driven automation is a huge advantage. The underlying concepts are similar to what the tech world uses for automating data pipelines for robust workflows, which is all about creating efficient, reliable systems from complex data—exactly what we're doing with a stock screener.
Think of alerts as your personal research assistant, tirelessly scanning thousands of stocks on your behalf. It’s one of the best ways to make sure you never miss an emerging opportunity that fits your exact strategy.
Review and Backtest to Stay Sharp
A saved screen isn't meant to last forever. Markets evolve, sectors rotate, and economic conditions change. A screen that worked beautifully last year might be a total dud today.
Set a calendar reminder—maybe quarterly or twice a year—to review the performance of your saved screens. Be honest and ask yourself a few critical questions:
- Is this screen still finding quality names? If all it's returning is junk (or nothing at all), your criteria might be too strict or simply outdated for the current market.
- How have the stocks it found actually performed? Many screeners have backtesting features that show you how a strategy would have performed historically. Use this data to validate or challenge your filter combinations.
- Does a filter need a tweak? Maybe that P/E ratio you set six months ago is now too low for the market's current valuation. Perhaps revenue growth expectations need to be adjusted for a slowing economy.
This review process is what separates the amateurs from the pros. It’s how you refine your approach, learn from your results, and ensure your stock screening remains a sharp, effective tool in your arsenal.
Got Questions? Let's Talk Screeners
As you start working screeners into your trading routine, you're going to have questions. Everyone does. Let's tackle some of the most common ones I hear so you can get past the hurdles and start finding opportunities with confidence.
What Are the Biggest Beginner Mistakes?
It’s almost a rite of passage for new traders to make the same few mistakes. The biggest one? Piling on way too many filters at once.
It feels like the right thing to do—you add a dozen criteria, thinking you’ll pinpoint the "perfect" stock. But what usually happens is you've made the screen so restrictive it comes back with zero results. It’s a fast track to frustration.
A much better approach is to start broad. Pick just two or three simple filters, like market cap and sector, to get a manageable list of names. From there, you can start layering in more specific criteria, one by one, to see how it refines your results.
Another classic pitfall is treating the screener's output as a direct buy signal. It's not. Think of your results as a list of interesting candidates that now require real research. You still need to do your homework and understand the story behind the numbers.
And a simple but surprisingly common error: forgetting to save your good screens. There's nothing worse than building a killer screener, finding great stocks, and then realizing you have to build it all over again from scratch next time.
How Often Should I Run My Screens?
There's no single right answer here—it all boils down to your personal trading style and time horizon. The key is to sync up your screening schedule with your strategy.
For instance, a long-term value investor hunting for deep-value plays might only run their main screens once a week, or even once a month. The kinds of companies they're looking for don't just pop up and disappear in a day.
On the other hand, a swing trader trying to catch momentum shifts might run their screens every single day, maybe even a few times a day. They need to stay on top of rapid changes in price action and sentiment.
As a rule of thumb, try to match your screening frequency to your expected holding period. If you're a buy-and-hold investor, running daily screens is a recipe for over-trading and getting lost in the noise.
Are Paid Stock Screeners Really Better?
For most investors, especially when you're starting out, free screeners are more than enough. Seriously. Tools like Finviz or the screener on Yahoo Finance are incredibly powerful and let you build sophisticated strategies without paying a cent.
So, when does it make sense to pay? Paid screeners earn their keep by offering specialized features for more demanding traders. These premium tools typically give you:
- Real-time Data: Most free screeners have a 15-20 minute delay. That’s totally fine for a long-term investor, but it's a non-starter for a day trader.
- Deep Historical Data: If you’re serious about backtesting, you’ll want the 10+ years of financial data that many paid tools offer.
- Custom Formulas: This is a big one. It's the ability to create your own unique metrics, like finding stocks trading within 2% of their 52-week high.
- Integrated Alerts: Get automated notifications the moment a new stock meets your saved criteria, so you don't have to be glued to your screen.
My advice is to only upgrade to a paid service when you start feeling genuinely constrained by the free options. If your strategy absolutely requires real-time data or a custom formula that you just can't get otherwise, then a paid screener becomes a valuable investment. Until that day comes, master the free tools first.
Ready to move beyond the basics and build professional-grade screens with real-time data and unmatched customizability? ChartsWatcher provides the advanced features you need to turn your strategies into actionable results. Explore ChartsWatcher and start your free trial today.
