Top 8 Best Stock Screener Settings for Stock Success
Unlocking Market Opportunities With Powerful Stock Screeners
Finding promising investments in today's financial markets can be daunting. The sheer amount of data and the rapid pace of market changes make manual analysis a significant challenge. This is where stock screeners become invaluable. They've evolved from basic filters using simple metrics like price-to-earnings ratios to sophisticated algorithms incorporating both technical indicators and fundamental data. Understanding these tools is now essential for modern investing.
A stock screener's strength lies in its ability to quickly analyze thousands of stocks, identifying those that match your investment strategy. Whether you're looking for value stocks, momentum plays, or short-term breakouts, the right screener settings are key. These settings, based on market theory and incorporating both technical and fundamental analysis, allow you to define your ideal investment criteria.
This guide explores eight powerful stock screener settings to help you uncover exceptional market opportunities in 2025 and beyond. We'll cover a range of strategies, from classic indicators to advanced techniques, empowering you to find the best stocks regardless of your investing style or experience. Get ready to refine your investment research and discover how to identify promising candidates efficiently.
Setting 1: Price-to-Earnings Ratio (P/E)
The P/E ratio is a classic valuation metric comparing a company's stock price to its earnings per share. A low P/E ratio could suggest an undervalued stock, while a high P/E ratio could indicate overvaluation. However, it's crucial to consider industry context and growth prospects. Learn more about the P/E ratio on Investopedia.
Setting 2: Return on Equity (ROE)
ROE measures a company's profitability relative to shareholder equity. A higher ROE generally suggests better management of shareholder investments. This metric provides insight into a company's ability to generate profits from its available resources.
Setting 3: Debt-to-Equity Ratio
The debt-to-equity ratio indicates a company's financial leverage. A high ratio signifies greater reliance on debt financing, which can be risky. Analyzing this metric helps assess a company's financial stability and potential vulnerability to economic downturns.
Setting 4: Earnings Growth
Consistent earnings growth is a positive indicator of a company's financial health. Look for companies with a history of steady earnings increases, suggesting sustainable business performance.
Setting 5: Moving Averages
Moving averages smooth out price fluctuations, revealing trends and potential buy/sell signals. The 50-day and 200-day moving averages are popular indicators for identifying trends. Learn more about Moving Averages on TradingView.
Setting 6: Relative Strength Index (RSI)
The RSI measures the speed and change of price movements, identifying overbought or oversold conditions. This momentum indicator can help pinpoint potential trend reversals.
Setting 7: Volume
Trading volume provides insights into market sentiment and the strength of price movements. High volume can confirm a breakout or trend reversal.
Setting 8: Price and Volume Trend (PVT)
PVT combines price and volume data to measure the cumulative buying and selling pressure. This indicator can help identify stocks experiencing significant accumulation or distribution. Learn more about PVT on StockCharts.
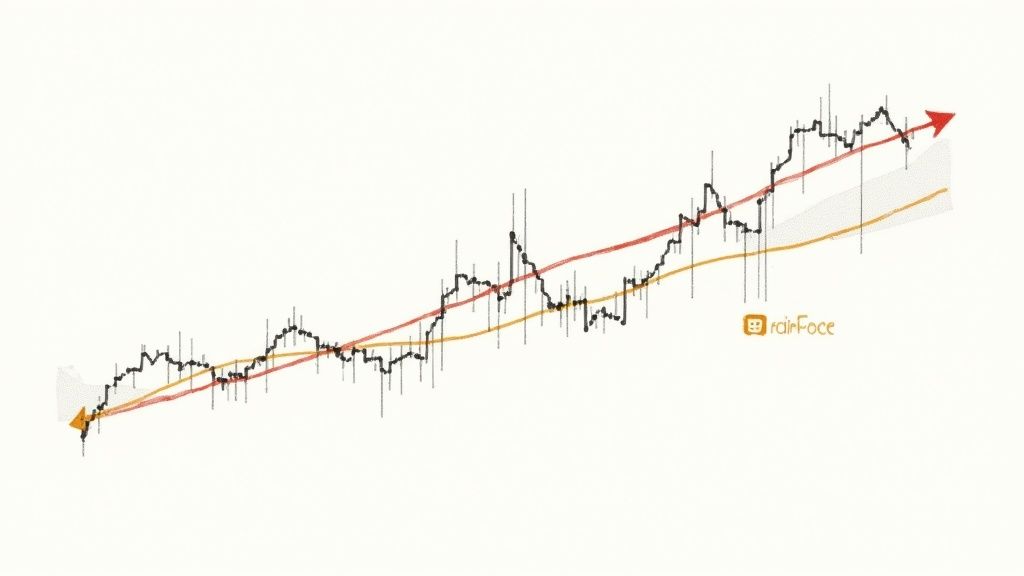
1. Moving Average Crossover Screener
The Moving Average Crossover Screener is a cornerstone of technical analysis. It provides traders with objective signals for potential trend changes in stock prices. This screener uses the relationship between shorter-term and longer-term moving averages (MAs) to identify momentum shifts and potential entry or exit points.
Its popularity comes from its clear signals, historical reliability, and ease of use. It can be implemented across various trading styles and timeframes, making it a valuable tool for everyone from day traders to long-term investors.
How It Works
The core concept revolves around identifying when a shorter-term MA (e.g., 50-day) crosses above or below a longer-term MA (e.g., 200-day). A Golden Cross happens when the shorter-term MA crosses above the longer-term MA. This signals a potential bullish trend reversal. Conversely, a Death Cross happens when the shorter-term MA crosses below the longer-term MA, suggesting a potential bearish trend reversal.
Key Features and Benefits
- Golden & Death Cross Signals: These easily identifiable patterns offer clear buy/sell signals. This can help reduce emotional decision-making.
- Customizable Time Periods: Traders can adjust the MA periods (e.g., using a 10-day and 30-day MA). This fine-tunes the screener’s sensitivity and adapts it to different market conditions or trading strategies.
- Volume Confirmation Filters: Adding volume filters helps confirm the strength of the crossover signal. This helps avoid false breakouts.
- Historical Backtesting: Most platforms like TradingView allow backtesting different MA crossover strategies. This helps optimize parameters and assess historical performance.
Real-World Examples
- Apple (AAPL): A Golden Cross in April 2023 preceded a significant uptrend. This example demonstrates the predictive potential of this indicator.
- S&P 500: The Death Cross in March 2020 correctly signaled the pandemic market crash. This showcases its effectiveness in identifying major market turns.
- Tesla (TSLA): A 20/50-day MA crossover in November 2022 offered an early indication of the stock’s subsequent recovery.
Pros & Cons
Pros:
- Clear, objective entry and exit signals
- Effective for identifying new trends
- Reduces emotional decision-making
- Works across multiple timeframes
- Well-established technical pattern with historical reliability
Cons:
- Prone to false signals in choppy markets
- Lagging indicator that can miss early trend moves
- Requires additional confirmation signals for best results
- Different effectiveness across various market sectors
Tips for Implementation
- Confirmation Signals: Combine the MA crossover screener with other technical indicators. Using indicators like the Relative Strength Index (RSI) or Moving Average Convergence Divergence (MACD) can increase signal accuracy.
- Market Capitalization Considerations: Use different MA periods for stocks with different market capitalizations. Smaller-cap stocks may benefit from shorter MA periods due to higher volatility.
- Volume Requirements: Set minimum volume requirements. This filters out low-liquidity stocks, where false signals are more common.
- Sector-Specific Periods: Consider using sector-specific MA periods. Faster MAs may be suitable for technology stocks, while slower MAs may be better for utilities.
- Exponential Moving Averages (EMAs): Use EMAs for a more responsive indicator. EMAs give more weight to recent price data.
Origins and Popularization
While moving averages can be traced back to the work of Charles Dow, the modern application and popularization of MA crossovers are often attributed to technical analyst John Murphy. Trading platforms have further cemented their place in the modern trader's toolkit.
The Moving Average Crossover Screener remains popular due to its ease of use and proven ability to identify potential trend changes. By understanding its strengths and limitations and incorporating these tips, traders can effectively use this powerful tool.
2. Relative Strength Index (RSI) Reversal Screener
The Relative Strength Index (RSI) Reversal Screener is a powerful tool for identifying potential trend reversals in stock prices. It uses the RSI, a momentum oscillator developed by J. Welles Wilder, to pinpoint stocks that are overbought (RSI above 70) or oversold (RSI below 30) and showing signs of a price direction change. This allows traders to anticipate potential entry and exit points, often catching shifts in momentum before major trend changes fully materialize.
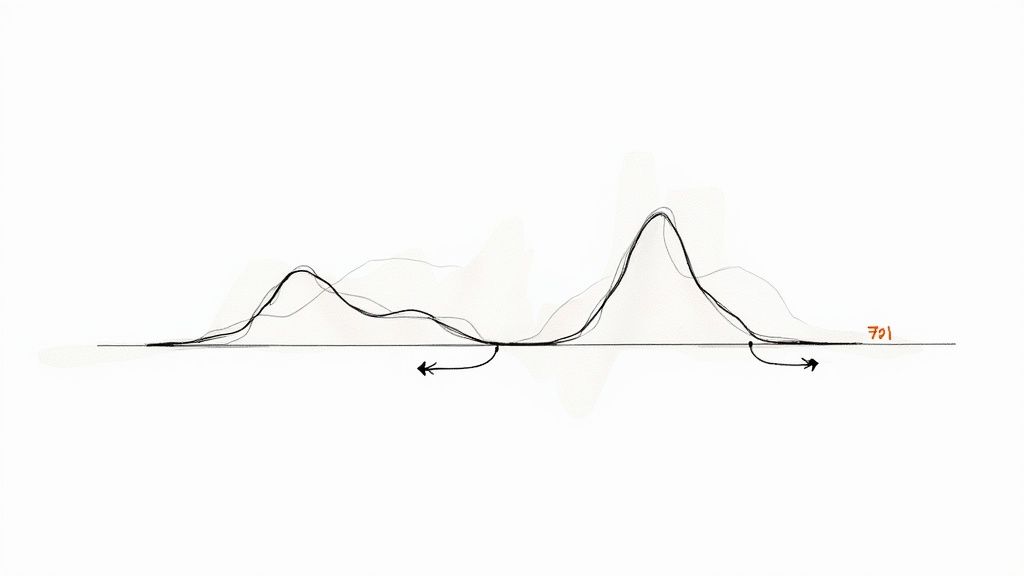
This screener's core functionality revolves around customizable RSI thresholds. While 30 and 70 are the standard benchmarks, these can be adjusted based on market volatility.
For example, highly volatile stocks might warrant wider thresholds (e.g., 20/80). The screener can also detect RSI divergences, where price makes a new high or low, but the RSI fails to confirm, signaling a potential weakening of the trend.
Additional Features
- Time period customization (the standard is 14 days, but shorter periods like 2 days can be used for short-term trading)
- RSI trend line breakout detection
- Multiple timeframe RSI confirmation for enhanced signal validation
The RSI Reversal Screener excels in its ability to identify potential reversal points, helping traders avoid buying at market tops and selling at bottoms. It's effective in both trending and range-bound markets. It can be applied to any liquid market or timeframe, offering specific, actionable price levels.
Real-world examples highlight its utility:
- Bitcoin’s RSI dipped to 25 in December 2022 before a significant bounce.
- Netflix (NFLX) showed RSI divergence in July 2022 preceding a substantial rally.
- Nvidia (NVDA) experienced overbought RSI readings above 80 in 2023, followed by predictable pullbacks.
However, like any indicator, the RSI Reversal Screener has limitations. RSI can linger in overbought or oversold territory during strong trends, sometimes generating premature signals. Confirming signals with price action analysis is crucial. The screener’s efficacy can be diminished in certain market conditions, such as periods of low volatility. You might be interested in our guide on Technical Analysis Indicators to learn more about other indicators that can complement RSI analysis.
Tips for Maximizing Effectiveness
- Wait for the RSI to definitively reverse, not merely reach extreme levels.
- Look for RSI divergences with price for stronger signals.
- Combine the screener’s output with support and resistance levels for optimal entry and exit points.
- Adjust RSI thresholds according to market volatility.
- Leverage multiple timeframe RSI alignment for stronger confirmation.
The work of J. Welles Wilder laid the foundation for the RSI, and its application in reversal screening has been popularized through platforms like Stockcharts.com's technical screeners. The teachings of technical analysts like Constance Brown further solidify its place as a valuable tool for traders of all levels. Its versatility, actionable signals, and ability to function across various market conditions make it a valuable tool for traders.
3. Value Stock Screener With Graham Number

The Graham Number screener is a fundamental tool for value investors. It offers a structured way to pinpoint potentially undervalued companies. Developed by Benjamin Graham, considered the father of value investing, and championed by his student Warren Buffett, this method prioritizes fundamental analysis and the important concept of a "margin of safety." Its inclusion on this list is warranted because it provides a proven, quantitative way to cut through market noise and zero in on companies possessing strong inherent value.
This approach centers around the straightforward Graham Number formula: √(22.5 × EPS × BVPS). The formula uses both earnings per share (EPS) and book value per share (BVPS) to estimate a fair value. The constant, 22.5, comes from Graham's recommended maximum P/E ratio of 15 and P/B ratio of 1.5. If a stock trades below its Graham Number, it’s potentially undervalued, offering a margin of safety.
Key Features of a Graham Number Screener
- Graham Number Calculation (√(22.5 × EPS × BVPS)): This calculation forms the foundation of the screener.
- Price-to-Graham Number Ratio: A lower ratio suggests a larger potential margin of safety.
- Minimum Market Capitalization Filter: This helps avoid micro-cap stocks, which are often more volatile.
- Debt-to-Equity Ratio Maximum: This helps filter out companies carrying excessive debt.
- Current Ratio Minimum (typically >2): This helps ensure companies have adequate short-term liquidity.
- 5-Year Earnings Growth Consistency Check: This feature identifies companies with a consistent earnings history.
Pros of Using the Graham Number
- Fundamental Focus: The screener relies on core business metrics instead of short-term market sentiment.
- Systematic Approach: It provides a clear, repeatable process for finding value opportunities.
- Margin of Safety: The method has built-in protection against market fluctuations and potential errors in valuation.
- Reduced Emotional Investing: It offers a quantitative framework for making investment decisions.
- Resilience in Bear Markets: Value stocks tend to hold up better during market downturns.
Cons of Using the Graham Number
- Value Traps: The screener may highlight companies with declining fundamentals that appear cheap.
- Not Ideal for Growth Stocks: The formula doesn't consider a company’s potential for future growth.
- Potential Underperformance in Bull Markets: Growth and momentum stocks often outperform during market rallies.
- Requires Patience: Realizing value can take time, necessitating a long-term investment outlook.
- Industry Adjustments May Be Needed: The standard formula may need adjustments for different industries with varied capital structures.
Real-World Examples
- Success: Bank of America (BAC) traded below its Graham Number in March 2020, providing a substantial buying opportunity before the stock price doubled.
- Value Trap: Fossil Group (FOSL) appeared undervalued according to some Graham Number screeners in 2019, but the company's struggles continued, highlighting the risk of value traps.
- Berkshire Hathaway: Many companies in Warren Buffett's portfolio align with Graham's principles.
Tips for Effective Implementation
- Minimum Institutional Ownership: Filter for stocks with a certain percentage of institutional ownership (e.g., >15%) as a sign of broader market validation.
- Sector-Specific Metrics: Use sector-specific metrics such as lower P/B ratios for financial institutions.
- Positive Free Cash Flow: Look for positive free cash flow to avoid companies with potentially unsustainable earnings.
- Minimum Dividend Yield: Add a minimum dividend yield requirement if you want income from your investments.
- Insider Buying: Consider insider buying as a positive indicator of management’s confidence in the company.
By using the Graham Number screener alongside other fundamental analysis tools and a deep understanding of the company’s business model, investors can significantly improve their ability to identify truly undervalued opportunities and construct a strong, value-focused portfolio. Resources like GuruFocus's Graham Number Screener and publications from the AAII (American Association of Individual Investors) offer additional information and tools for implementing this valuable investment strategy.
4. MACD Momentum Screener
The MACD Momentum Screener is a powerful tool for finding stocks ready to make big price moves. By studying how moving averages interact, this screener picks out stocks showing strong momentum and potential trend reversals. This makes it valuable for traders looking to profit from both early trend development and points where a trend runs out of steam.

Developed by Gerald Appel, the MACD indicator consists of the MACD line (the difference between two exponential moving averages), the signal line (an EMA of the MACD line), and the histogram (the difference between the MACD and signal lines). This setup helps traders visualize momentum shifts.
When the MACD line crosses above the signal line, it suggests bullish momentum. A crossover below the signal line indicates bearish momentum. The histogram offers further confirmation, with expanding bars showing accelerating momentum and contracting bars suggesting weakening momentum.
Features and Benefits
- MACD Line Crossing Signal Line Detection: This feature clearly identifies bullish and bearish crossover signals.
- MACD Histogram Expansion Measurement: This confirms momentum strength and potential trend reversals.
- MACD Divergence With Price Identification: This highlights possible differences between price action and momentum, which can predict trend changes.
- Multiple Timeframe MACD Alignment: Checking momentum across different timeframes (like daily and weekly charts) makes the signals more reliable.
- Volume Confirmation Filter: This feature filters for stocks with matching volume increases, improving the accuracy of signals.
- Customizable MACD Parameters: Traders can adjust the standard (12, 26, 9) parameters to fit their trading style and market conditions.
Pros
- Combines trend and momentum analysis in one indicator.
- Provides clear visual signals for trend changes and momentum shifts.
- Works well in various market conditions and asset classes.
- Helps pinpoint both entry and exit points.
- Can be used on any liquid market or timeframe.
Cons
- Can give false signals in choppy or sideways markets.
- As a lagging indicator, it might miss the very start of trend moves.
- Works best with confirmation from other indicators or price action.
- May generate conflicting signals across different timeframes.
Real-World Examples
- Microsoft (MSFT): A bullish MACD crossover in January 2023 came before a substantial 30% rally.
- Crude Oil Futures: MACD divergence in June 2022 foreshadowed a major market top.
- AMD: A weekly MACD crossover in October 2022 signaled a new uptrend.
Tips for Implementation
- Concentrate on stocks with MACD crossovers near the zero line for stronger signals.
- Look for histogram acceleration (taller bars) to confirm growing momentum.
- Use weekly MACD for overall trend direction and daily MACD for trade timing.
- Combine MACD signals with price pattern breakouts for higher probability trades.
- Wait for the signal line crossover to finish, not just approach, to avoid entering or exiting a trade too early.
Popularity and Evolution
Gerald Appel created the MACD, but figures like Thomas Aspray made it more popular through histogram analysis. The indicator is widely used because it's included in popular stock screening platforms like FinViz and TradingView, making it easily available to all traders.
The MACD Momentum Screener is valuable because it combines trend and momentum analysis, providing clear signals for potential price moves. By understanding its strengths and weaknesses, and using the tips provided, traders can use the MACD to improve their strategies and find profitable opportunities.
5. Volatility Breakout Screener (Bollinger Bands)
The Volatility Breakout Screener uses Bollinger Bands to identify stocks ready for significant price action. This method leverages the cyclical nature of volatility, using periods of low volatility, or price compression, as potential breakout signals. It's a useful tool for traders aiming to capture large price swings early on.
Bollinger Bands have three lines plotted on a price chart: a simple moving average (SMA), an upper band two standard deviations above the SMA, and a lower band two standard deviations below. When these bands narrow, a phenomenon called a "squeeze," it signals decreasing volatility. This often precedes a breakout. A price breaking above the upper band or below the lower band confirms this potential shift from low to high volatility.
Key Features and Benefits
-
Bollinger Band Width Measurement: This helps pinpoint consolidating periods where the bands are narrowing.
-
Breakout Detection: The screener alerts traders to price movements breaking above the upper or below the lower band.
-
Volume Surge Requirement: Filtering for increased volume validates breakouts and minimizes false signals.
-
Bollinger Band Squeeze Detection: This isolates extremely low volatility periods where the bands contract sharply. These periods are often followed by powerful breakouts.
-
Multiple Timeframe Confirmation: Cross-referencing breakouts on different timeframes (like daily and weekly charts) adds confirmation and reduces noise.
-
Customizable Standard Deviation Settings: Traders can fine-tune the standard 2.0 setting based on their risk tolerance and current market conditions.
Pros
- Early Breakout Identification: Catch substantial price moves as they begin.
- Statistically Sound: Based on the principle of volatility reversion.
- Market Agnostic: Works in both rising and falling markets.
- Clear Entry and Exit Points: The bands provide clear entry triggers and initial stop-loss levels.
- Versatile Applicability: Effective across different asset classes and timeframes.
Cons
- False Breakouts: Disciplined stop management is essential because false signals can occur.
- Rapid Reaction Required: Breakouts demand swift action from traders.
- Direction Uncertainty: It can be difficult to anticipate which direction the breakout will take.
- Limited Effectiveness in High Volatility: Reliability decreases in highly volatile markets.
- Position Sizing Crucial: Appropriate position sizing is critical for managing the inherent risks of increased volatility.
Real-World Examples
- GameStop (GME) January 2021: The dramatic price spike followed a significant Bollinger Band squeeze, highlighting the indicator's potential to identify short squeezes.
- Bitcoin (BTC) July 2020: Contracting Bollinger Bands preceded a major bull run, demonstrating the indicator's relevance to cryptocurrencies.
- Tesla (TSLA) November 2021: A weekly Bollinger Band breakout marked the start of a major upward trend, showcasing the indicator's effectiveness for longer-term moves.
Practical Tips for Implementation
- Confirmation is Key: Wait for a confirmed close outside the bands, not just an intraday break, to filter out false signals.
- ATR for Stop Placement: Use the Average True Range (ATR) to set appropriate stop-loss levels based on recent volatility.
- Volume Validation: Look for increasing volume on breakouts (at least double the average volume).
- Momentum Indicators: Pair Bollinger Bands with momentum indicators such as the Relative Strength Index (RSI) and the Moving Average Convergence Divergence (MACD) to better gauge breakout direction.
- Timeframe Selection: Use weekly charts to identify major price movements and daily charts for shorter-term trading.
Popularized By
John Bollinger (creator of Bollinger Bands), Mark Minervini (known for his work on volatility contraction patterns), and platforms like TradeStation and StockCharts.com have further popularized the use of Bollinger Bands for breakout identification.
By understanding Bollinger Bands and using these practical tips, traders can use the Volatility Breakout Screener to identify and profit from dynamic market movements. This technique offers a statistical advantage, enabling traders to make informed decisions based on market volatility cycles.
6. Gap Trading Screener
A Gap Trading Screener is a powerful tool for identifying stocks with price gaps. These gaps appear as empty spaces on a stock chart, showing where the opening price differs significantly from the previous day's close. They represent supply and demand imbalances, often leading to predictable price movements. Traders use these screeners to find gap continuation patterns (price moves in the gap's direction) and gap fill patterns (price returns to close the gap).
This screener is a valuable resource for traders looking for clear trading opportunities. The volatility around gaps can provide excellent risk-reward scenarios for prepared traders, making it a top choice for stock screener settings in both bull and bear markets.
Key Features
- Percentage Gap Threshold Detection: Set the screener to find gaps above a specific percentage (e.g., 2-5%).
- Gap Classification: Differentiate between gap types like breakaway, runaway, exhaustion, and common gaps.
- Volume Surge Confirmation Filter: Locate gaps with increased volume, indicating stronger market conviction.
- Pre-market/After-hours News Correlation: Connect gaps with news for better context.
- Historical Gap Fill Tendency Analysis: Analyze a stock's history of filling gaps to estimate probabilities.
- Sector and Market Cap Categorization: Filter by sector or market capitalization for targeted searches.
Pros
- Provides clear trading opportunities every day.
- Gaps often create high-probability setups, especially gap fills.
- Works in both bull and bear markets.
- Can be automated for early morning preparation.
- Often offers favorable risk-reward ratios.
Cons
- Requires pre-market analysis.
- Gap direction isn't always indicative of the day's price movement.
- Some gaps don't fill (especially earnings-related gaps).
- Requires experience to distinguish between continuing and filling gaps.
- Increased volatility requires careful position sizing.
Real-World Examples
- Netflix (NFLX): Saw significant price swings of 15% or more in 2022-2023 after earnings-related gaps, presenting both continuation and fill opportunities.
- SPY ETF: During the volatile market of March 2020, the SPY ETF showed numerous morning gaps that filled within days, providing short-term opportunities.
- Nvidia (NVDA): The 2023 AI rally saw Nvidia create several runaway gaps, demonstrating gap continuation in a strong trending market.
Tips for Effective Implementation
- Focus on gaps aligned with the overall trend.
- Watch the first 30 minutes of trading to assess gap follow-through.
- Set price alerts for half-gap fills as potential reversal points.
- Consider using options for defined risk.
- Classify gaps using volume and price patterns for better predictions. For more on price analysis, see Our guide on Price Action Trading Strategies.
Popularity and Evolution
Gap trading gained popularity through figures like Scott Andrews (Gap Guy) and Toby Crabel, who developed specific gap trading strategies. Sophisticated scanning tools like Trade Ideas and gap filters in platforms like TC2000 have made gap trading more accessible. This has cemented the gap trading screener as a crucial tool for modern traders.
7. Insider Trading Signal Screener
The Insider Trading Signal Screener focuses on a powerful, often overlooked aspect of stock analysis: insider trading activity. This screener identifies stocks with significant buying or selling activity by company executives, directors, and major shareholders. It operates on the idea that insiders, with their intimate knowledge of company operations and future prospects, often make informed trading decisions. These decisions can foreshadow future stock price movements.
Insider buying is particularly significant. Insiders may sell for various reasons (diversification, personal expenses), but they typically buy for one reason: they believe the stock is undervalued. This screener helps you follow the "smart money" and potentially uncover hidden gems before the broader market does.
How It Works and Why It Matters
This screener goes beyond simple buy/sell tallies. It uses several key features to refine the signal and identify truly insightful trades:
- Multiple insider purchases filter (cluster buying): Isolated purchases can be misleading. This feature highlights situations where multiple insiders are buying simultaneously, suggesting a collective belief in undervaluation.
- C-level executive transaction focus: Transactions by CEOs, CFOs, and other high-ranking executives are given greater weight. They are typically more informed about the company’s strategic direction.
- Transaction size relative to insider's holdings: A large purchase relative to existing holdings indicates strong conviction.
- Open market purchases vs. options exercises distinction: Open market purchases are more telling than options exercises, which can be mechanically driven.
- Timing relative to earnings announcements: Purchases before positive earnings surprises can be particularly insightful.
- Historical insider transaction pattern analysis: The screener lets you review past trading history to identify consistent patterns and assess track records.
Real-World Examples
- Moderna (MRNA): Several Moderna directors made significant stock purchases in the months leading up to the company's 2021 vaccine announcements. This demonstrated their confidence in the vaccine’s potential.
- GameStop (GME): Insider buying in late 2020, before the 2021 short squeeze, hinted at underlying value the market initially overlooked.
- Berkshire Hathaway's purchases of Bank of America (BAC) stock by Warren Buffett: Buffett's significant investments in Bank of America, revealed through insider filings, signaled his long-term bullish view.
Pros and Cons
Here’s a quick look at the advantages and disadvantages:
| Pros | Cons |
|---|---|
| Based on actions of those with closest company knowledge | Insiders can be early (sometimes very early) with their timing |
| Provides fundamental validation beyond technical patterns | Requires Form 4 filings, which have reporting delays |
| Strong historical correlation with long-term performance | Doesn't work well for short-term trading strategies |
| Particularly effective in small and mid-cap stocks | Insider sales are often less predictive than purchases |
| Often identifies undervalued companies before institutional investors | Needs additional fundamental confirmation |
Tips for Implementation
- Focus on cluster buying: Look for multiple insiders buying concurrently.
- Prioritize CFO and CEO purchases: These executives often have the most complete financial picture.
- Look for first-time insider buying after prolonged selling: This can signal a sentiment shift.
- Pay attention to transaction size relative to the insider's net worth: Larger purchases demonstrate stronger conviction.
- Combine with technical support levels for better entry timing: Integrate insider signals with technical analysis to optimize entry points.
Popularity and Evolution
The importance of insider trading signals has been popularized by figures like Peter Lynch, the legendary Fidelity fund manager. He emphasized the value of following insider activity. The SEC's Form 4 disclosure requirements provide transparency. Platforms like OpenInsider.com and InsiderMonkey provide data aggregation and analysis tools.
Why This Screener Deserves Its Place
The Insider Trading Signal Screener provides a unique and valuable perspective, complementing other screening methods. By understanding the motivations and actions of company insiders, investors can gain a significant edge. They can identify potentially undervalued stocks and make more informed decisions. This screener is particularly valuable for long-term investors focused on fundamental analysis. While not foolproof, tracking insider activity provides a compelling layer of insight. This can significantly enhance your investment process.
8. Earnings Surprise Momentum Screener
The Earnings Surprise Momentum Screener is a powerful tool for finding stocks with potential for growth after a significant positive earnings surprise. This strategy uses the Post-Earnings Announcement Drift (PEAD), where a stock's price continues to move in the direction of the earnings surprise for weeks or even months after the initial announcement. The screener combines fundamental analysis (earnings performance) with technical analysis (price momentum and volume) to pinpoint promising trading opportunities.
How It Works
This screener looks for companies that recently reported earnings significantly exceeding analyst expectations and are showing positive price momentum after the announcement. It filters stocks based on several key features:
- Earnings Surprise Percentage Threshold: Usually set above 10%, this identifies companies that significantly outperformed projections.
- Positive Price Reaction Confirmation: This ensures the market is responding favorably to the positive earnings news.
- Increased Trading Volume Requirement: Higher volume confirms the move's strength and suggests increased investor interest.
- Consecutive Earnings Beats Streak Filter: This helps identify companies with consistent growth.
- Analyst Upgrade Momentum Tracking: Positive analyst revisions after earnings further validate the positive outlook.
- Options Implied Volatility Change Measurement: Monitoring volatility changes can help gauge market expectations and potential price swings.
Why It Deserves a Place on the List
The Earnings Surprise Momentum Screener offers a structured approach to using the PEAD. It provides clear entry timing based on concrete company news (earnings) and combines fundamental and technical indicators to improve the probability of success. This strategy is particularly useful because it can uncover stocks at the start of new uptrends, potentially leading to trades lasting several months.
Real-World Examples
- Nvidia (NVDA): A 25% earnings beat in Q2 2023 fueled a continued uptrend, demonstrating the power of positive earnings surprises with strong market sentiment.
- Zoom (ZM): A positive surprise in March 2020 began a major uptrend, showing how this strategy can identify stocks early in a significant growth phase.
- Target (TGT): Conversely, a negative earnings surprise in May 2022 preceded a significant downtrend, illustrating how these principles can apply to identifying potential shorting opportunities.
Pros
- Capitalizes on fundamental catalysts with a proven momentum effect (PEAD).
- Provides clear entry timing after significant company news.
- Often identifies stocks at the start of new trends.
- Combines fundamental and technical confirmation.
- Can produce trading opportunities lasting multiple months.
Cons
- Earnings surprises can sometimes lead to 'sell the news' reactions.
- Requires quick screening after earnings announcements.
- Highest volatility often happens right after announcements.
- May miss entry if the post-earnings gap is too large.
- Effectiveness can vary seasonally during earnings seasons.
Tips for Implementation
- Wait for Confirmation: Wait for at least one full trading day after earnings for a better understanding of the market reaction.
- Manage Risk With Options: Use options strategies to manage risk during the typically high volatility period after earnings.
- Focus on Revenue and EPS Beats: Prioritize stocks beating both revenue and EPS, ideally with raised future guidance.
- Compare to Previous Quarters: Analyze the stock's reaction to past earnings for pattern consistency.
- Use Trailing Stops: Set trailing stops to capture post-earnings drift momentum and protect profits.
Origins and Popularity
The concept of momentum investing, a core principle behind this screener, was pioneered by investors like Richard Driehaus. The focus on earnings surprises gained traction through research by firms like Zacks Investment Research, known for their earnings surprise prediction models. Publications like Investor's Business Daily (IBD) also emphasize earnings season as key for identifying promising investments. FactSet's comprehensive earnings data has also made this information more accessible for market participants.
8-Strategy Stock Screener Comparison Matrix
| Strategy | Complexity (🔄) | Resources (⚡) | Outcomes (📊) | Use Cases (⭐) | Advantages (💡) |
|---|---|---|---|---|---|
| Moving Average Crossover Screener | Medium; configurable MA periods | Medium; requires historical data and volume filters | Clear trend shifts and objective signals | Trend-following multi-timeframe trading | Reduces emotion; well-established technical pattern |
| RSI Reversal Screener | Simple to Moderate; threshold and divergence based | Low-Medium; uses readily available indicator data | Identifies reversal points at extreme RSI levels | Overbought/oversold detection in various markets | Actionable entries; can be combined with other indicators |
| Value Stock Screener with Graham Number | Medium; involves fundamental calculations | High; needs earnings, book value data, and additional filters | Finds undervalued stocks with a margin of safety | Long-term value investing and fundamental analysis | Systematic approach; reduces emotional bias; margin of safety |
| MACD Momentum Screener | Medium; multi-timeframe analysis with adjustable MACD parameters | Medium; relies on momentum data and volume filters | Detects momentum shifts and potential trend reversals | Trend and momentum trading in liquid markets | Combines trend and momentum; provides clear visual signals |
| Volatility Breakout Screener (Bollinger Bands) | Moderate; uses statistical measures with breakout detection | Medium-High; requires real-time volatility and volume data | Captures explosive moves post volatility contraction | Breakout trading and volatile market setups | Statistically driven; offers clear entry triggers and stop levels |
| Gap Trading Screener | Moderate; gap detection and classification with volume confirmation | Medium; utilizes pre-market data and percentage-based gap filters | Identifies high-probability gap setups | Early morning trading; risk-reward gap analysis | Provides objective setups; potential for favorable risk-reward ratios |
| Insider Trading Signal Screener | High; involves detailed analysis of filings and insider transactions | High; depends on regulatory filings and insider activity data | Indicates fundamental validation through smart money actions | Long-term investors seeking insider insights | Leverages insider actions for confirmation and long-term prospects |
| Earnings Surprise Momentum Screener | Moderate-High; rapid post-earnings analysis and filtering | High; requires timely earnings data and volume spikes | Captures post-earnings momentum and continued price drift | Earnings season trades; momentum opportunities | Merges fundamental catalysts with clear timing signals |
Fine-Tuning Your Strategy With the Best Stock Screener Settings
Finding the best stock screener settings isn't a one-and-done deal. It's a continuous process of refinement and adaptation. Whether your focus is a moving average crossover screener, exploring RSI reversal signals, or searching for value stocks using the Graham number, your parameters require regular review. Market dynamics are constantly shifting, and your approach should too. Think of your settings as dynamic tools needing regular calibration, not static rules set in stone.
Applying these concepts effectively requires discipline and a clear understanding of your investment goals. Begin by defining your risk tolerance. Are you a long-term investor focused on value, or a short-term trader seeking quick gains? Your chosen strategies, and therefore your screener settings, should align with these objectives. Meticulously track the results of different setting combinations to identify what works best for you.
Adapting to a Changing Market
Continuous learning is key to success in the ever-evolving stock market. Stay informed about market trends, emerging sectors, and new trading strategies. The increasing use of AI and machine learning in finance, for example, is shaping new screening methodologies. By staying ahead of the curve and integrating these advancements, you maintain a competitive edge in this dynamic environment.
Key Takeaways for Effective Stock Screening
Here’s a summary of how to maximize your stock screening effectiveness:
- Defining Clear Goals: Align your screener settings with your investment objectives and risk tolerance.
- Iterative Testing: Experiment with various parameter combinations and diligently track their performance.
- Continuous Learning: Stay up-to-date on market trends and incorporate new knowledge into your screening strategies.
- Regular Review: Periodically re-evaluate and adjust your settings based on market conditions and performance analysis.
Unlock Your Trading Potential with ChartsWatcher
Looking for a powerful tool to help you navigate the complexities of the market? ChartsWatcher is a sophisticated stock market scanning software designed for professionals. With customizable dashboards, real-time data feeds, advanced charting, and backtesting capabilities, ChartsWatcher empowers you to efficiently track and analyze market movements. Develop precise trading strategies and gain a decisive edge. Explore the power of ChartsWatcher today with our flexible pricing plans, including a free basic package: https://chartswatcher.com
