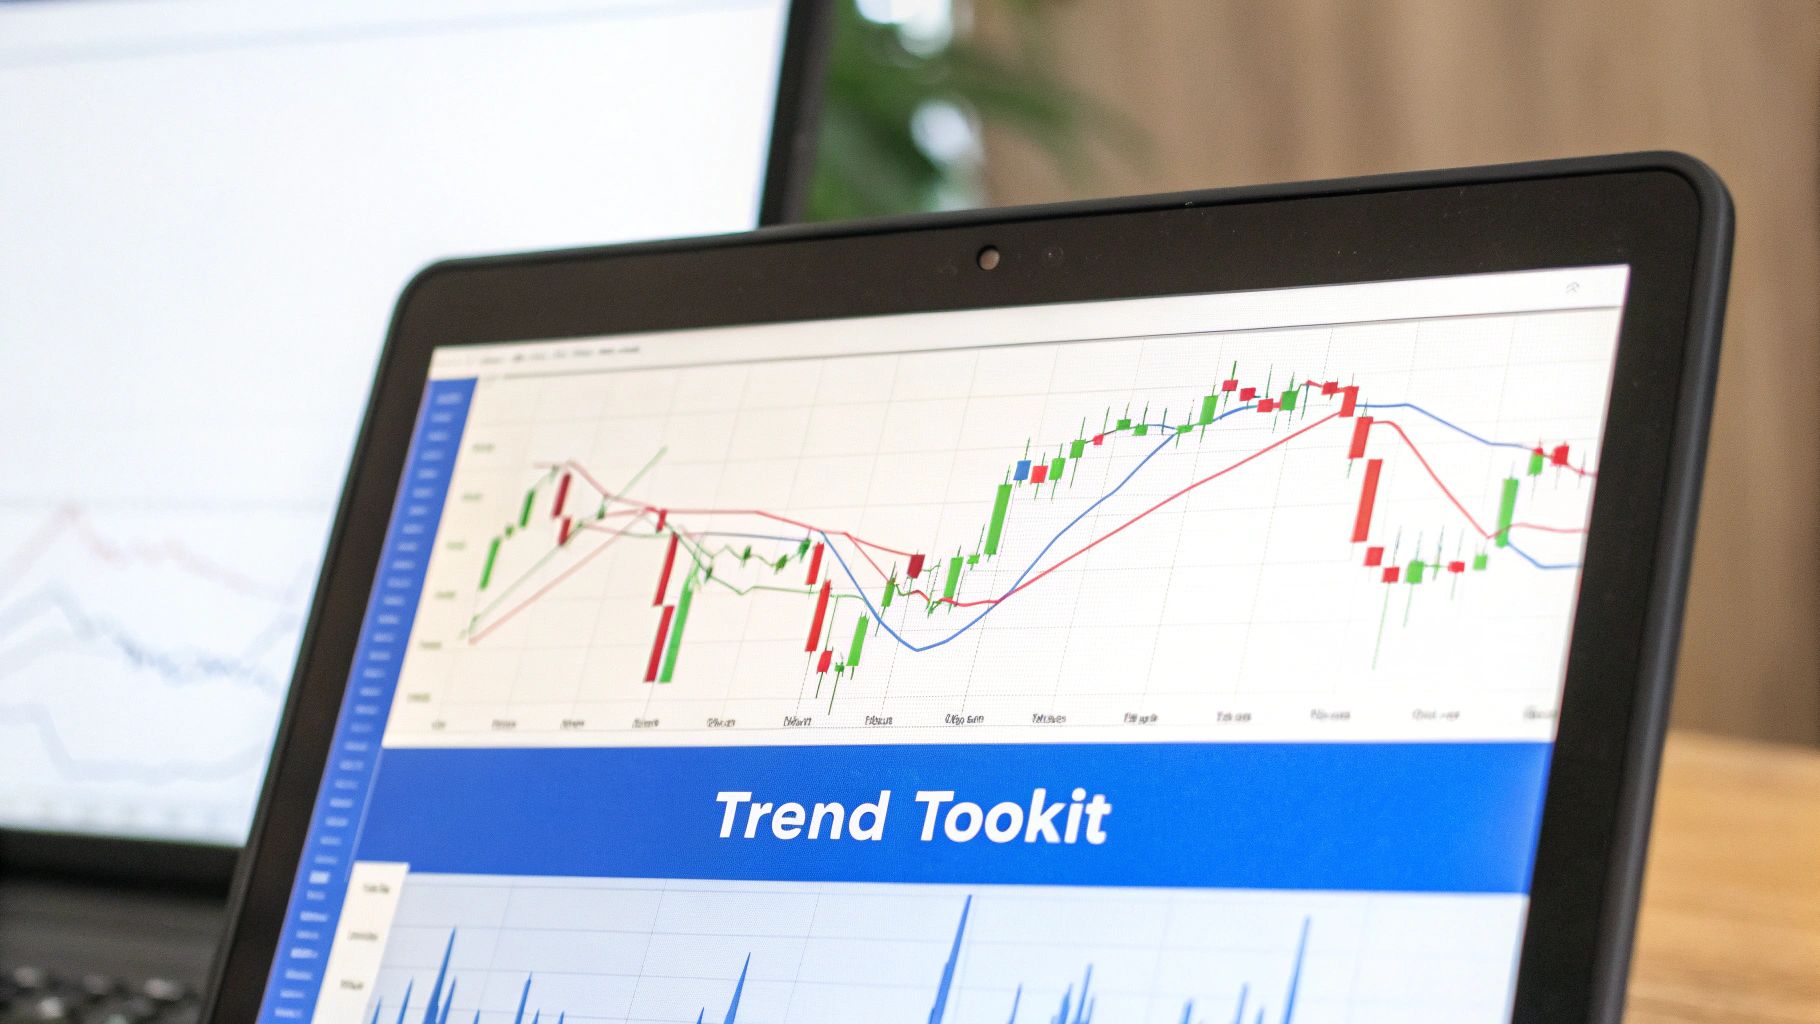
How to trade the trend: A Pro Trader's Guide to Profitable Markets
To trade the trend successfully isn't about chasing hot stocks or perfectly timing market tops and bottoms. It's a much more disciplined game. The whole idea is to pinpoint the market's dominant direction and simply go with the flow, aligning your trades with that underlying momentum.
Understanding What It Really Means to Trade the Trend

A lot of new traders think this means jumping on whatever is popular at the moment. But the reality is far more methodical. At its heart, trend trading operates on a simple but powerful principle: a market in motion tends to stay in motion. Instead of swimming against the current, you learn to ride it.
This requires a mental shift. You have to stop asking, "Where will the market go?" and start asking, "Where is the market going right now?" This is all about analyzing price action to see the tug-of-war between supply and demand that creates those persistent moves in one direction.
The Three Market Directions
Every single chart you pull up will be in one of three states. Learning to spot which one you're looking at is the absolute first step. Get this wrong, and you’ll find yourself fighting a powerful current—a quick way to drain your account.
- Uptrend (Bullish): You'll see a clear pattern of higher highs and higher lows. This is the market telling you that buyers are in charge. They're consistently pushing prices up and stepping in to buy on any small dips.
- Downtrend (Bearish): This is the opposite, defined by a series of lower lows and lower highs. Sellers have the upper hand here, driving prices down and selling into any rallies that pop up.
- Sideways Market (Range-Bound): Price just bounces between a clear floor (support) and ceiling (resistance). There's no real directional momentum. Buyers and sellers are in a temporary truce, and no clear trend is in play.
To help you quickly identify what you're looking at, this table breaks down the core characteristics of each market state.
Key Characteristics of Market Trends
| Characteristic | Uptrend (Bullish) | Downtrend (Bearish) | Sideways (Range-Bound) |
|---|---|---|---|
| Price Action | Higher Highs & Higher Lows | Lower Lows & Lower Highs | Oscillates between support & resistance |
| Dominant Force | Buyers (Demand > Supply) | Sellers (Supply > Demand) | Equilibrium (Supply ≈ Demand) |
| Moving Averages | Sloping upwards, acting as support | Sloping downwards, acting as resistance | Flattening out, often crisscrossing price |
| Trader's Goal | Buy the dips, ride the momentum up | Sell the rallies, ride the momentum down | Trade the range or wait for a breakout |
Think of this table as your field guide. A quick glance at these signals on a chart will tell you who's in control and how you should be positioning yourself.
The goal isn't to be a market genius who predicts the future. It's to be a disciplined observer who reacts to the present reality of the chart. Your job is to align with the dominant force—buyers or sellers—and manage your risk accordingly.
The Forces Behind the Trend
Trends don't just appear out of thin air; they're the footprints of fundamental forces. These drivers can be anything from big macroeconomic shifts, like interest rate changes, to industry-specific news, like a major tech breakthrough. Investor psychology also plays a huge part, creating feedback loops that can keep a trend running for months, or even years.
On a much larger scale, these trends reflect global economic evolution. If you look at historical data, global trade volumes have grown exponentially since 1800, fueled by industrialization, new technologies, and policy shifts. This long-term expansion shows just how powerful these sustained trends can be. You can dive into the data behind this incredible growth by exploring the history of global trade on Our World in Data. This broader perspective helps put the shorter-term market trends we’re trying to capture into context.
Building Your Trend Identification Toolkit
Successful trend traders don’t operate on gut feelings. They rely on a specific set of tools to confirm what the market is telling them. Think of it like a pilot's dashboard—each gauge provides a critical piece of information. Flying blind is just guessing, and in the markets, guessing is a quick way to run out of fuel.
The goal isn't to plaster your charts with every flashy indicator you can find. That just creates noise. A professional approach is all about using a few key tools that work in harmony, each one validating the story the others are telling. This creates a much more robust and reliable signal to trade the trend.
Core Indicators for Trend Analysis
Let's get practical and move from theory to your actual screen. Your foundation should be built on a few time-tested indicators that measure trend direction, momentum, and potential exhaustion points. I’d argue that mastering two or three is far more powerful than being a jack-of-all-trades with twenty.
Here are the absolute essentials that form the backbone of nearly every professional trend-following system:
- Moving Averages (MAs): These are the true workhorses of trend identification. By smoothing out price action, they give you a clean, clear view of the underlying direction. Most traders I know use a combination—a faster one (like the 20-period) and a slower one (like the 50-period). When the shorter MA crosses above the longer one, it’s a classic bullish signal. The reverse signals a potential downtrend.
- Moving Average Convergence Divergence (MACD): This is all about momentum. It has two lines (the MACD line and the signal line) plus a histogram that shows the difference between them. A simple rule of thumb: when the MACD line pushes up through the signal line, it suggests bullish momentum is picking up steam.
- Relative Strength Index (RSI): The RSI is a momentum oscillator, meaning it measures the speed and change of price movements on a scale from 0 to 100. Its primary job is to help you spot overbought (typically above 70) or oversold (usually below 30) conditions.
The real edge comes from seeing how these tools interact. A moving average crossover might confirm a new uptrend, but a quick glance at an overbought RSI could be the warning you need to wait for a pullback instead of chasing the move.
Creating Synergy Between Your Tools
No single indicator is a magic bullet. The secret sauce is learning how they confirm one another.
For instance, a strong uptrend confirmed by upward-sloping moving averages becomes far more compelling when the MACD is also rising strongly above its zero line. This confluence of signals is what gives you the confidence to pull the trigger.
A classic professional setup uses moving averages to define the primary trend. You might decide to only consider long trades if the price is holding above the 50-period moving average. From there, you could use the RSI dipping into oversold territory (without the primary trend breaking down) as a high-probability trigger to buy a pullback. This layered approach filters out weak signals and keeps you focused on the highest quality setups.
For traders looking to go deeper, our complete guide on how to identify market trends offers even more detailed strategies and examples. The key is to build a repeatable process. You should be able to look at any chart and, within seconds, use your toolkit to diagnose the market’s health, confirm the trend, and spot a potential opportunity.
Building Your Plan for Getting In and Out
Spotting a great trend is just the start. Seriously, a fantastic market call means nothing if you don't have a mechanical, rules-based plan for how you're going to enter and exit the trade. This is where discipline truly separates the pros from the amateurs. Think of your entry and exit strategy as the business plan for every single position you open.
To really trade the trend effectively, your system needs to be simple enough to execute when the pressure is on, but strong enough to handle the market's wild swings. Forget trying to nail the absolute top or bottom of a move—that’s a recipe for disaster. The real goal is to capture the big, meaty part of the move while keeping a tight leash on your risk.
Pinpointing Your Entry Triggers
Your entry is the moment you commit. It has to be tied to a specific, repeatable event you can see on the chart—a signal that screams "high-probability opportunity." Chasing a stock after it has already made a huge run is a classic rookie mistake. Professionals are patient; they wait for a logical, lower-risk spot to get in.
Two of the most battle-tested entry techniques are:
- Pullbacks to Key Moving Averages: In a solid uptrend, a key moving average like the 20-period EMA or 50-period SMA often acts as a springboard. A disciplined trader waits for the price to dip back and test that level. When it holds, it shows the buyers are still in charge, giving you a green light to jump in.
- Failed Rallies into Resistance: For shorting downtrends, you just flip the logic. You'd look to short a stock when it tries to rally back to a descending moving average or a previous support level (which has now flipped to resistance) and gets rejected. This tells you the sellers are still firmly in control.
Using these methods keeps you from buying into the peak of FOMO or shorting into a panic-driven bottom. You're entering on a moment of temporary weakness within a much larger, more powerful trend.
Defining Your Exit Rules
Believe it or not, your exit strategy is even more important than your entry. It’s got two parts: where you cut your losses and where you take your profits. A crystal-clear exit plan rips the emotion out of your decisions. It stops you from letting a small loss spiral into a portfolio-killer or from bailing on a massive winner way too early.
The professional trader's mindset is simple: cut your losses quickly and let your winners run as long as possible. Your exit rules are the mechanism that forces you to do this systematically.
First up is your initial stop-loss. You need to place this at a logical price level that, if hit, completely invalidates your original trade idea. For example, if you bought a pullback to the 50-day moving average, a logical stop might be placed just a tick below the low of that pullback candle. If the price drops below that, your reason for entering is gone.
The second piece is your profit-taking strategy. For trend traders, a trailing stop-loss is an incredible tool. It helps you lock in profits as the trade moves in your favor. You might trail your stop below the prior day's low or use a moving average as a guide. This method lets you stay in a winning trade for as long as the trend is alive, giving it room to breathe without giving back all your hard-earned gains.
Finding High-Probability Setups with Scanners
Let’s be honest: manually flipping through hundreds of charts is a surefire way to burn out and miss the best moves. Professional traders don’t waste time hoping to stumble upon a good setup; they use scanners to systematically find the best opportunities.
This is how you get ahead. A well-built scan brings a curated list of high-potential candidates directly to you each day, transforming your process from a random hunt into a disciplined, repeatable workflow. It's about efficiently focusing only on stocks that already meet your strict criteria to trade the trend.
Building Your Trend Following Scan
The real power of a scanner is in its filters. Your goal here is to create a "recipe" that isolates stocks showing clear signs of institutional interest and upward momentum. You’re not looking for everything that’s moving—you’re looking for a very specific, high-probability profile.
A great starting point for any uptrend scan includes these core technical filters:
- Price > 50-Day Moving Average: This confirms the stock has solid short-to-medium term strength.
- Price > 200-Day Moving Average: This is your big-picture filter, making sure the stock is in a major uptrend.
- Volume > 1.5x Average Volume: A surge in volume often means big institutions are accumulating shares, which adds conviction to the move.
By layering just these simple rules, you instantly cut through the market noise. We dive deeper into more advanced configurations in our trader's guide to real-time stock scanning, but the key is having a system that automatically finds stocks primed for continuation.
Adding a Layer of Fundamental Strength
Technical signals are powerful on their own, but you can add another layer of conviction by weeding out fundamentally weak companies. You don’t need to become a deep-value analyst, but adding one or two simple growth metrics can help you sidestep stocks that are trending on pure hype.
A strong technical trend backed by solid fundamentals is the sweet spot. It tells you that both the chart and the underlying business story are pointing in the same direction.
Consider adding a filter like Quarterly Sales Growth > 20%. This simple check ensures you’re focused on companies that are actually growing their business, not just riding a temporary market wave. This blend of technicals and fundamentals creates a much more robust watchlist of quality names.
The entire process, from entry to exit, should be a structured workflow. The diagram below shows how a well-defined plan guides you through each stage, removing emotion from the equation.
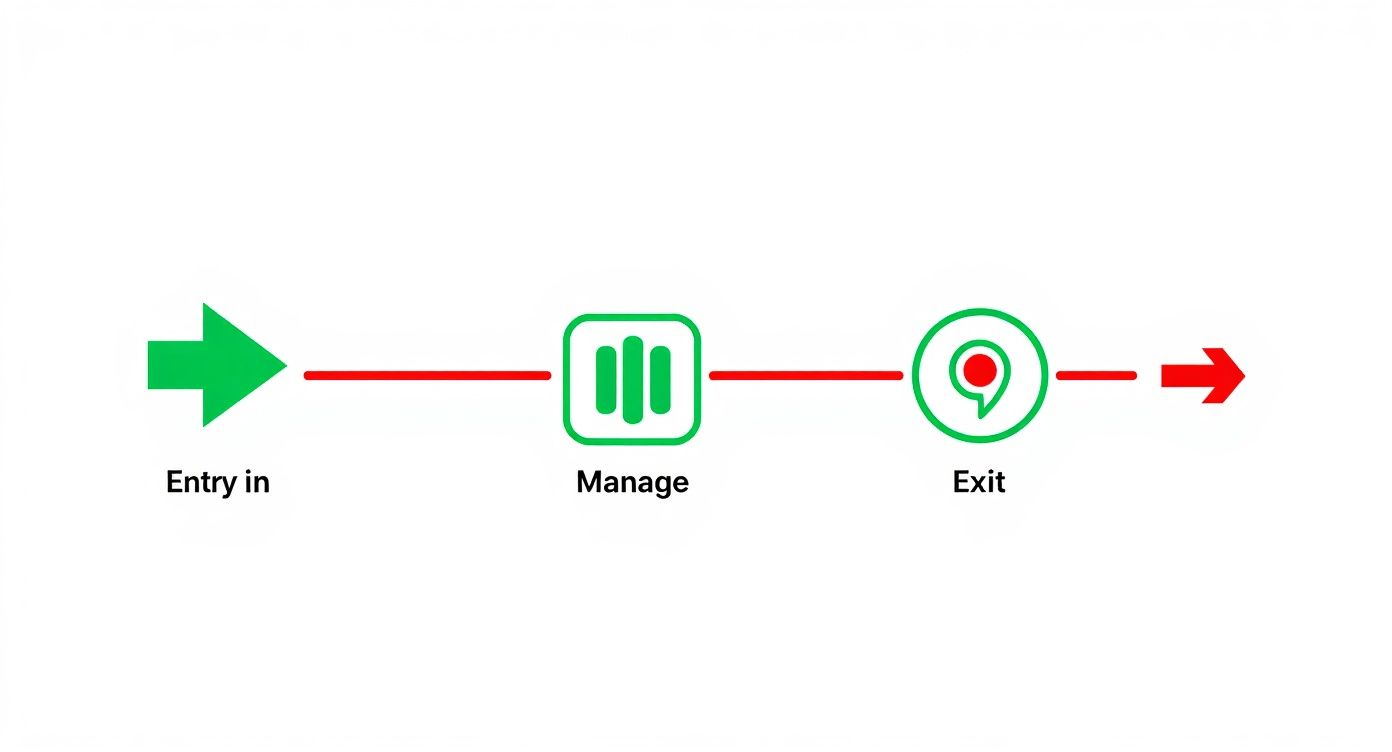
This kind of structured thinking reinforces how each step is a distinct decision point guided by your rules. It’s a perspective that applies even on a macro scale. For instance, global trade showed impressive resilience in 2025, expanding by about $500 billion in the first half of the year alone, driven by powerful commercial trends in sectors like electronics and electric vehicles.
Mastering Risk and Your Trading Psychology

Spotting a monster trend and nailing the entry point is only half the battle. Seriously. Even a picture-perfect technical strategy is doomed to fail if you haven’t mastered risk and your own emotional triggers.
This is the stuff that truly separates the consistently profitable pros from the struggling amateurs. It’s not about being fearless; it's about building a non-negotiable framework that protects you from your worst impulses.
The cornerstone of that framework is the 1% rule. It’s a beautifully simple principle: never risk more than 1% of your total account capital on any single trade. If you're working with a $30,000 account, your maximum acceptable loss on one position is just $300.
This rule makes it mathematically impossible for a couple of bad trades to knock you out of the game. It ensures you have enough capital to survive the inevitable losing streaks and stay afloat long enough for your strategy's edge to pay off.
The Practical Math of Position Sizing
So how do you actually apply the 1% rule? It works hand-in-hand with position sizing, which is the calculation you use to determine exactly how many shares to buy or sell. This isn't guesswork; it's basic arithmetic driven by your entry price and your stop-loss.
Let's say you want to buy a stock at $50, and your chart analysis tells you the trade is invalidated if it drops to $48. Your risk per share is $2 ($50 entry - $48 stop).
With that same $30,000 account, your maximum risk is $300 (1%). To find your position size, you just divide your max risk by your per-share risk:
$300 (Max Risk) / $2 (Risk Per Share) = 150 shares
By following this exact process for every single trade, you ensure each position carries the same, manageable dollar risk—whether you're trading a volatile tech stock or a slow-moving utility. If you want to dive deeper, you can explore some general risk management principles.
Conquering Your Trading Psychology
Beyond the math lies the most difficult opponent you'll ever face in the markets: your own mind. The emotional discipline it takes to trade the trend is immense because long, drawn-out trends are designed to test your patience and rattle your nerves.
You'll have to overcome two major psychological hurdles:
- Fear of Missing Out (FOMO): This is that gut-wrenching impulse to chase a stock after it has already made a massive run. You see it taking off without you, throw your plan out the window, and pile in—usually right near the top, just before a sharp pullback.
- Anxiety and Premature Profit-Taking: On the other side of the coin, fear can trick you into snatching a tiny profit the second a trade moves in your favor. You're terrified of giving back those small gains, so you exit way too early, cutting your winners short. This is the cardinal sin of trading.
The market is a machine built to trigger these emotional responses. Your trading plan—with its strict entry, exit, and risk rules—is your only defense. You have to learn to execute your plan, not your feelings.
This need for a disciplined, rules-based approach isn't just for individual traders; it applies on a global scale. In August 2025, for instance, the U.S. trade deficit narrowed by 23.8% to $59.6 billion due to major shifts in import and export dynamics.
These large-scale economic trends are driven by a complex web of policy, supply chains, and market forces—all reinforcing why structured analysis will always beat emotional reaction. You can see more details in these U.S. international trade statistics on BEA.gov.
Got Questions About Trend Trading? We've Got Answers.
As you start putting these trend trading concepts into practice, the rubber meets the road. It's one thing to understand a trend in theory, but it's another to navigate the messy reality of live markets. This is where the practical, "what if" questions pop up—the kind every single trader runs into.
Getting clear on these common challenges ahead of time is crucial. It builds the confidence you need to stick to your plan when the market starts throwing curveballs. Let's tackle some of the most frequent questions I hear from traders learning this style.
How Long Does a Trend Need to Be "Tradable"?
This is a classic question, but it's slightly misguided. There's no magic number of days or weeks. Quality always trumps duration.
Instead of asking how long a trend has been running, ask how clean its structure is. A tradable trend has a clear, rhythmic pattern: higher highs and higher lows in an uptrend, or lower lows and lower highs in a downtrend. It’s that simple.
A trend that's only a few days old might just be noise—too young and unproven to bet on. On the flip side, a trend that's been grinding higher for a year could be exhausted and ready to roll over. The sweet spot is a trend that's clearly established but still shows signs of life, like strong volume on up-days and orderly, shallow pullbacks.
A better question is: "How well-respected is the trend's structure?" A clean, six-week trend where price has bounced perfectly off the 50-day moving average three times is a much higher-quality setup than a chaotic, year-long "trend" full of deep, volatile corrections that shake everyone out.
What's the Best Time Frame for Following Trends?
The "best" time frame is the one that fits you. It depends entirely on your personality, your schedule, and how actively you want to manage your trades. There's no single right answer, just different strokes for different folks.
Here’s a quick way to think about it:
- Long-Term (Weekly/Monthly Charts): This is for the patient investor, maybe someone with a full-time job who can't watch the screen all day. You might only check your positions once a week. The trends here are powerful and can generate huge returns, but they develop slowly and require serious discipline to hold through minor pullbacks.
- Swing Trading (Daily/4-Hour Charts): This is the sweet spot for many traders. It lets you capture major market swings that last from a few days to several weeks. You get plenty of action without having to be glued to your monitor 24/7.
- Day Trading (Hourly/15-Minute Charts): This is a different beast altogether and requires your full focus. You're hunting for shorter-term trends that play out over minutes or hours. It’s a fast-paced game that's best suited for full-time traders.
How Do You Handle a Sudden, Sharp Trend Reversal?
This one is simple, but not easy: You honor your stop-loss. No exceptions.
Your job as a trend trader isn't to predict when a trend will end. It’s to react decisively when it does. A sudden, violent reversal that smashes through your stop-loss is the market telling you, "The party's over." You get out.
The worst thing you can do is freeze or, even worse, start hoping it will turn back around. Once you're stopped out, the best move is to step aside. Wait for a new, clear trend to establish itself—either in the opposite direction or for the original trend to prove it's back on track. Don't rush back in.
Does Trend Trading Work in Other Markets Besides Stocks?
Absolutely. The principles of trend trading are universal because they're based on one thing: mass human psychology. The collective emotions of fear and greed drive prices in every freely traded market on the planet.
Whether you're looking at:
- Stocks
- Commodities like oil and gold
- Forex currency pairs
- Cryptocurrencies like Bitcoin
...you'll see the exact same patterns of uptrends, downtrends, and choppy ranges. The tools and strategies we've covered, like moving averages and volume analysis, can be applied to any of these markets with just minor tweaks. A trend is a trend, no matter the asset.
Ready to stop hunting for trends manually and start using a systematic, professional workflow?
ChartsWatcher gives you the powerful, real-time scanning and charting tools you need to find high-probability setups without the grunt work. Build your custom screens, set precise alerts, and focus only on the opportunities that fit your strategy.
