How to Track a Stock: Essential Tips for Investors
If you want to track a stock effectively, you have to look at more than just its price. The real story is told through key metrics like trading volume, P/E ratio, dividend yield, and technical indicators. A tool like ChartsWatcher pulls all this data into one place, letting you move from just watching prices to making smart, proactive decisions.
Beyond Price Watching: The New Rules of Stock Tracking
Let's be honest—staring at a stock's price chart all day isn't a strategy. It's a reactive habit that usually leads to emotional, and often costly, decisions. True stock tracking is about digging deeper to understand what's really driving a company's performance. It means analyzing market sentiment, spotting shifts in trading volume, and looking at the core financials.
To build a solid foundation, you have to get past the ticker price. Properly tracking a stock involves looking at several key data points that paint a much clearer picture of a company's health and where it stands in the market. A few of the big ones include:
- Price-to-Earnings (P/E) Ratio: This quickly tells you if a stock might be overvalued or undervalued compared to its earnings. A high P/E can suggest the market has big growth expectations, while a low P/E might signal a potential bargain.
- Dividend Yield: If you're an income-focused investor, this is your metric. It shows the annual dividend payout as a percentage of the stock's current price.
- Trading Volume: A sudden spike in trading volume is a huge signal. It often means significant news just dropped or investor sentiment is shifting, which can come right before a major price move.
Getting a Grip on Core Tracking Metrics
The first step in tracking a stock is knowing what data matters and how it's analyzed. The essentials include the stock price, volume of shares traded, P/E ratio, dividend yield, and technical indicators like moving averages. Even the big market benchmarks, like the S&P 500—which has seen an average annual return of roughly 10% over the last century—are tracked using these same principles to gauge the market's overall health. You can dig into more on long-term market performance with insights from J.P. Morgan.
A classic mistake is getting fixated on a stock's price while completely ignoring the fundamentals. A rising price on low volume can be a serious warning sign, just as a falling price on high volume can signal a major shift in how the market sees the company.
This is where a good dashboard comes in. Here’s a look at how ChartsWatcher brings these essential metrics together in one spot.
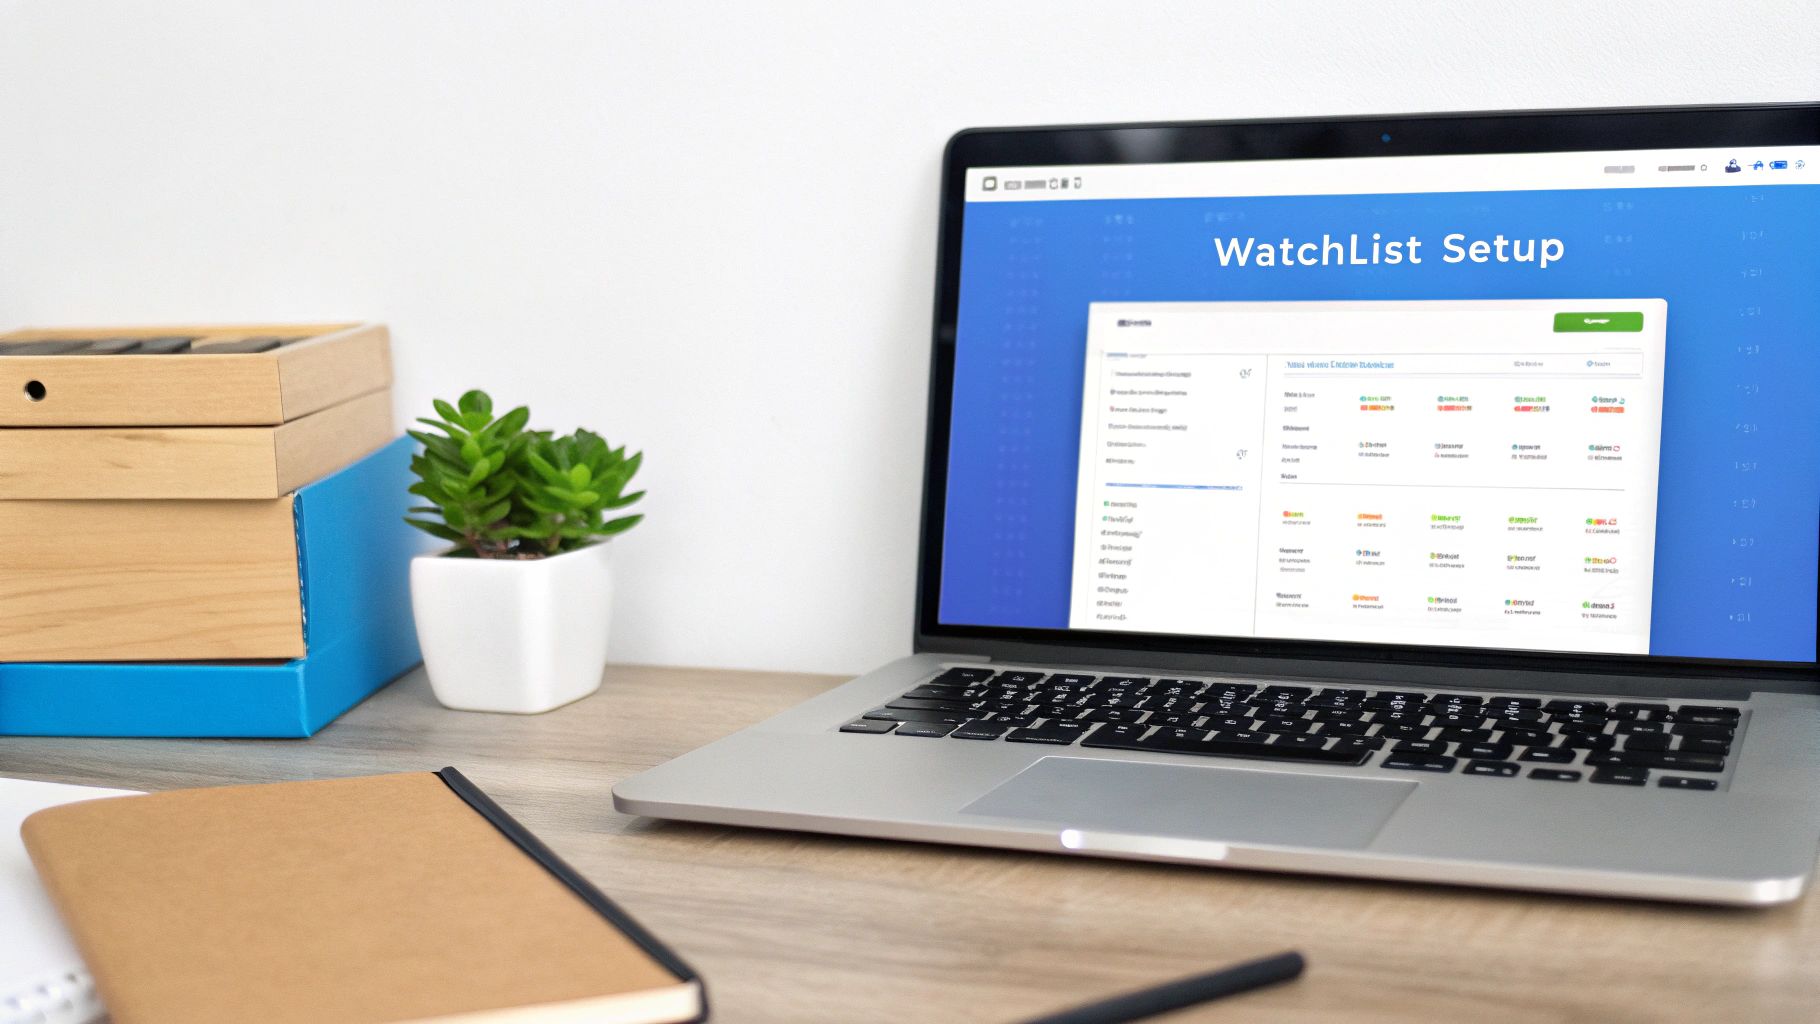
As you can see, this layout lets you monitor watchlists, charts, and news feeds all at once. It's designed to turn raw data into something you can actually use. This integrated view helps you spot connections you’d otherwise miss—like seeing a news event impact trading volume and price in real-time. That's a serious advantage.
To get started, it helps to have a quick reference for the most important data points. These are the metrics I find myself coming back to again and again for a quick health check on any stock.
Key Metrics Every Investor Should Track
| Metric | What It Tells You | Why It Matters |
|---|---|---|
| Price-to-Earnings (P/E) Ratio | How the stock price compares to its annual earnings per share. | Helps determine if a stock is overvalued or undervalued relative to its peers and its own history. |
| Trading Volume | The number of shares traded in a given period. | A spike in volume can indicate significant news or a shift in investor sentiment, often preceding a price move. |
| Dividend Yield | The annual dividend per share as a percentage of the stock's price. | Essential for income investors; it shows the return you get from dividends alone. A stable yield is a sign of health. |
| Earnings Per Share (EPS) | The company's profit divided by its outstanding shares. | A direct measure of profitability. Consistent EPS growth is a strong positive signal. |
| Moving Averages (e.g., 50-day, 200-day) | The average price of a stock over a specific period. | Smooths out price volatility to show the underlying trend direction. Key for identifying support and resistance levels. |
| Relative Strength Index (RSI) | A momentum indicator measuring the speed and change of price movements. | Helps identify overbought (above 70) or oversold (below 30) conditions, which can signal a potential price reversal. |
Having these metrics handy and knowing what they mean is the first step toward building a more disciplined and informed trading strategy. They provide the context you need to look beyond the price chart and make better decisions.
Building Your First Intelligent Stock Watchlist
Your tracking journey really kicks off when you graduate from a messy, chaotic list of tickers. An intelligent watchlist is your personal command center. It’s the difference between a static list and a dynamic tool that flags opportunities and warns you about risks. The goal here is to build a focused view of the market that’s tailored to your specific trading strategy.
Forget just dumping every hot stock you hear about into one giant list. That's a recipe for analysis paralysis. The key is strategic organization. Think of it like creating different playlists for different moods; you want to group stocks by sector ('Cloud Software' or 'EV Manufacturers'), by investment thesis ('High-Growth Tech' vs. 'Stable Dividend Payers'), or even by your personal risk tolerance.
This segmented approach helps you compare apples to apples and see at a glance which parts of your strategy are working. For a deeper dive into structuring your lists for success, you can learn more about how to create a stock watchlist to find winning trades with our detailed guide.
Customizing Your Data View
Once your lists are organized, the real power comes from customizing the data columns. Most platforms just show you the last price and daily change, but that barely scratches the surface. You need to bring the metrics that actually drive your decisions front and center.
In ChartsWatcher, you can tailor your columns to show what truly matters for your style of trading or investing.
- For Value Investors: You’ll want to prioritize columns like P/E Ratio, Dividend Yield, and Price-to-Book (P/B) Ratio. This setup lets you spot potentially undervalued companies in a heartbeat.
- For Growth Investors: Your focus should be on metrics like Revenue Growth (YoY), Earnings Per Share (EPS) Growth, and the stock's proximity to its 52-Week High. These columns highlight companies with serious upward momentum.
- For Swing Traders: Make sure Daily Volume, Average True Range (ATR), and the stock's distance from its 50-day moving average are your primary columns. This data is critical for identifying volatility and short-term trend strength.
As you build out your watchlists, remember that dedicated tools can make a huge difference. Exploring the best portfolio tracking software can help you manage your positions and watchlists across different platforms and brokers.
The most effective watchlist isn't the one with the most stocks; it's the one that provides the most clarity. A well-organized list with customized data columns gives you an immediate, at-a-glance understanding of your entire investment landscape, cutting through the noise to reveal actionable insights.
By taking the time to build and refine these watchlists, you’re no longer just passively watching the market. You're actively creating a high-signal environment that aligns perfectly with your goals, making your process of tracking a stock far more efficient and insightful.
Setting Up Smart Alerts to Catch Critical Moves
Staring at charts all day is a losing game, especially when the market moves in a blink. ChartsWatcher's smart alerts give you a massive edge by doing the heavy lifting for you. You get notified the instant something important happens, letting you focus on strategy instead of screen-watching.
These aren't just simple price alerts. You can set them up to trigger on technical thresholds and statistical anomalies. For instance, you could get a ping for a 150% volume spike compared to its 30-day average, or get notified the moment a stock crosses its 50-day moving average.
This means you never miss the moves that matter, and you can finally step away from your desk with confidence.
Here's a quick visual of how the workflow looks, from picking a stock to getting that crucial notification.
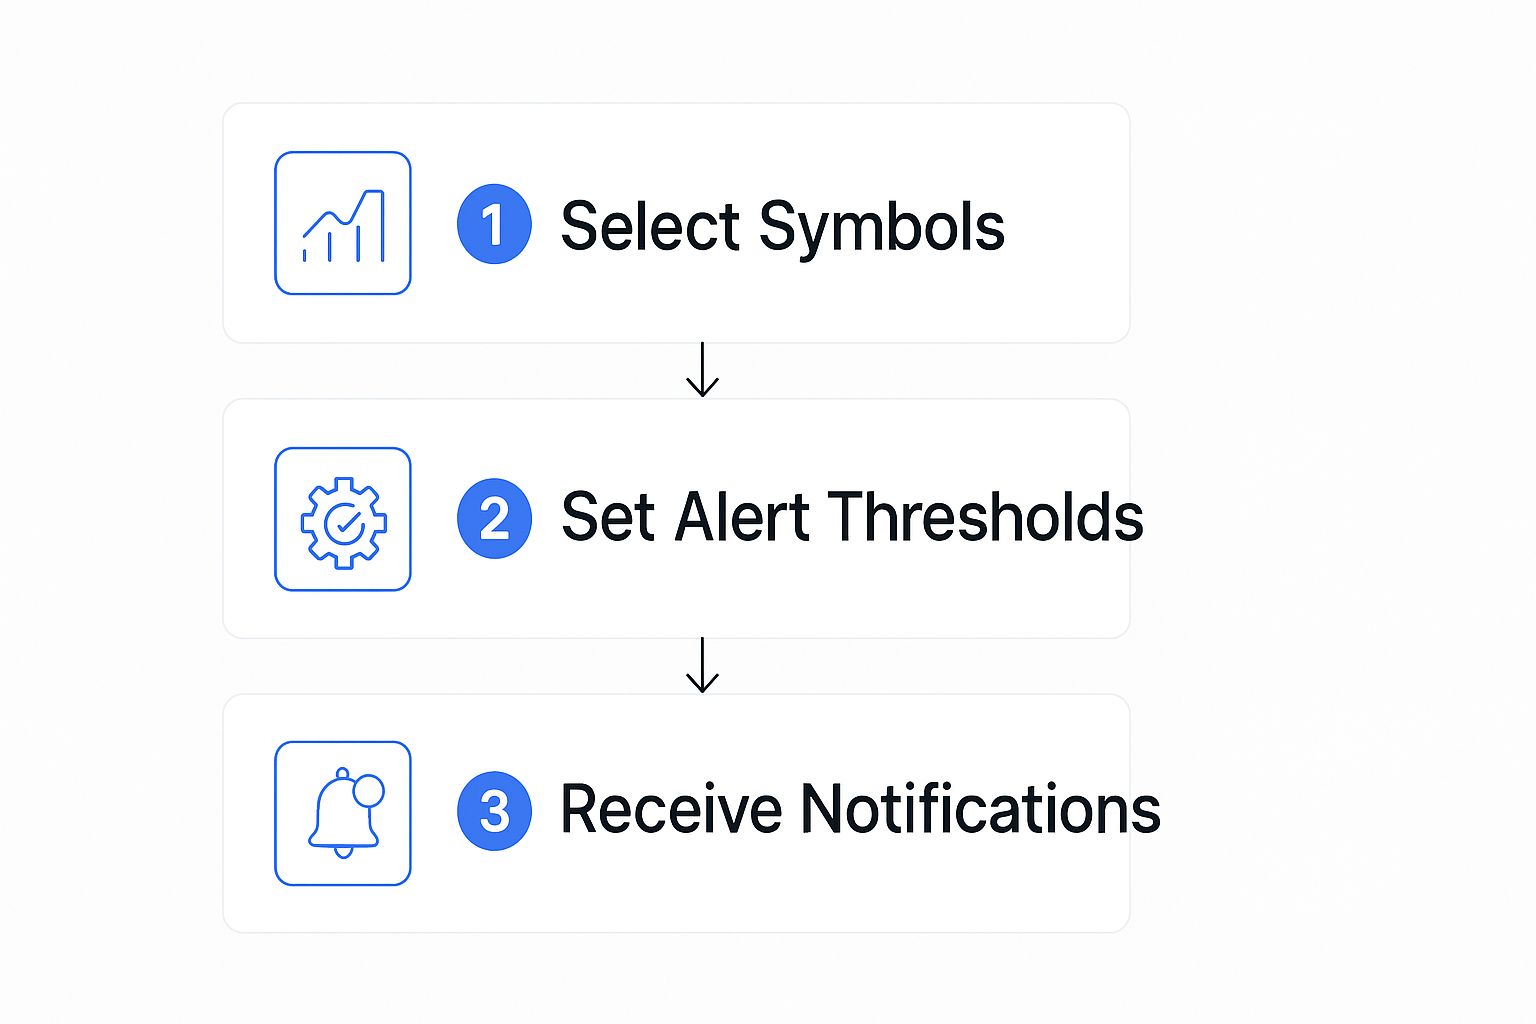
As you can see, it's a straightforward process: select your symbols, define your rules, and let the platform handle the rest.
Customizing Your Alert Thresholds
This is where you can really tailor the alerts to fit your personal trading style. You can set up rules for all sorts of scenarios, like:
- Unusual Volume Spikes: Get an alert when Apple (AAPL) volume suddenly surges 150% above its 30-day average. This is a classic sign that big money is making a move.
- Moving Average Crossovers: A stock crossing its 50-day or 200-day moving average is often a powerful signal of a new trend. Set up an alert so you're one of the first to know.
- RSI Overbought & Oversold Levels: An RSI crossing above 70 or dipping below 30 can signal prime reversal opportunities. These alerts put potential tops and bottoms on your radar automatically.
These are just a few examples. The flexibility here turns ChartsWatcher from a simple tool into your personal market watchdog.
For a deeper dive, be sure to check out our complete guide on How to Set Up Stock Alerts Like a Pro.
By layering these kinds of rules, you shift from passively watching the market to actively engaging with it based on data-driven triggers. Start with just a couple of your favorite setups, tweak them as you go, and you'll quickly see how much more effective your trading can become.
Designing Your Personal Investment Dashboard
Think of your investment dashboard as your command center for the market. Once you’ve got your watchlists and alerts humming along, the next move is to pull everything into a single, cohesive view. This isn't just about making things look tidy; a well-designed dashboard lets you spot connections between different data points instantly, which is absolutely critical for making sharp decisions.
In ChartsWatcher, the dashboard is built with widgets—think of them as modular blocks of information you can add, remove, and shuffle around to fit exactly what you need. The goal here is to craft a layout that tells you everything that matters at a glance, so you can stop flipping between a dozen different tabs or windows. This is where you bring your whole tracking process together.

Assembling Your Key Widgets
First things first, let's get your dashboard populated with the most critical pieces of your strategy. For most traders, a solid starting point is a mix of watchlists, charts, and news that’s actually relevant to you.
Here’s a practical setup you can build right now:
- Primary Watchlist Widget: Slap your main watchlist somewhere prominent. This keeps your core stocks front and center, right where they need to be.
- Real-Time Chart Widget: Give a nice, big chunk of screen real estate to a chart. The trick is to link this widget to your watchlist, so when you click a ticker, the chart snaps to it instantly.
- Filtered News Feed: Add a news widget, but configure it to only show headlines related to the stocks on your watchlist. This is your noise-canceling filter for the market.
A rookie mistake is to jam a dashboard with way too much information. Start with the essentials. Your dashboard should bring you clarity, not confusion. If a widget doesn't directly help you make a decision, it doesn't belong there.
Adding Comparative Analysis Tools
With the foundation in place, you can start layering in tools for deeper analysis. One of the most powerful techniques is comparing a stock’s performance against a benchmark or a direct competitor. This gives its movements much-needed context and tells you if it has relative strength or weakness.
For instance, you could set up a comparative chart to track NVIDIA (NVDA) against the Technology Select Sector SPDR Fund (XLK). In a second, you can see if NVIDIA is outperforming the broader tech sector or lagging behind. In the same way, you could pit Ford (F) directly against General Motors (GM) to see how they’re stacking up head-to-head.
If you’re looking for ideas on how to present data effectively, check out some business intelligence dashboard examples to get inspired. This whole process of customization is what turns your dashboard from a simple data display into a serious analytical tool, giving you the complete picture of the market forces impacting your portfolio.
Expanding Your Tracking to Global Markets
If you're only watching your domestic market, you're trading with one eye closed. Your next big opportunity could easily be brewing an ocean away, whether it's in Europe, Asia, or another emerging economy. Broadening your horizons allows you to tap into different economic cycles and discover unique companies that just aren't available on local exchanges.
Using a tool like ChartsWatcher makes this expansion completely manageable. You can add international stocks to your watchlists right alongside your U.S. picks, keeping everything in one place. For example, if you're already tracking the U.S. tech sector, why not monitor ASML Holding (ASML) from the Netherlands or SAP (SAP) from Germany? Doing so gives you a much fuller picture of the global technology landscape.
Adding International Stocks to Your Watchlists
The good news is that the mechanics of tracking an international stock are identical to what you’re already used to. You can set up the same smart alerts for volume spikes, price movements, and technical indicator crossovers without learning a new process.
The real difference is the added layer of global economic context you have to factor in.
One of the biggest variables is currency fluctuations. An international stock might be crushing it in its local currency, but if that currency weakens against the U.S. dollar, your returns can get wiped out. ChartsWatcher helps you account for this by letting you view performance in different currencies, so you can see the true impact of exchange rate dynamics on your bottom line.
A crucial tip: when tracking a stock from another country, always keep an eye on the broader regional economic news. A policy shift from the European Central Bank or fresh manufacturing data out of China can hit your international holdings much harder than news from Wall Street.
This cross-border analysis is becoming more mainstream. In 2024, international indices like the MSCI EAFE saw impressive earnings revisions, and some even outperformed the S&P 500 into early 2025, pushing more investors to look abroad. For a deeper dive, check out this international stock market outlook on Schwab.com.
Monitoring Major Global Indices
To build a true global perspective, you can't just track individual stocks in isolation. You need to monitor the key international indices that act as a barometer for regional market health. Just as you'd watch the S&P 500 for a pulse on the U.S. market, these indices provide the vital context for your foreign stock picks.
Major Global Indices to Track
To get a quick, at-a-glance view of different regions, it's a great idea to add the major global indices to your dashboard. This list covers the big players and will give you a solid foundation for understanding what’s happening around the world.
| Index Name | Region/Country | What It Represents |
|---|---|---|
| STOXX Europe 600 | Europe | A broad look at companies across 17 European countries. |
| Nikkei 225 | Japan | The leading index for the Tokyo Stock Exchange, key for Asia. |
| MSCI Emerging Markets | Global | Tracks stocks across more than 20 emerging economies. |
| FTSE 100 | United Kingdom | The 100 largest companies listed on the London Stock Exchange. |
| Hang Seng Index | Hong Kong | A key indicator for the Hong Kong stock market. |
| Shanghai Composite | China | Tracks all A-shares and B-shares traded on the Shanghai exchange. |
These indices aren't just numbers; they tell a story about investor sentiment and economic strength in their respective regions.
By integrating these global indices and a few handpicked foreign stocks into your existing workflow, you elevate your strategy from a domestic focus to a comprehensive, worldwide approach. This broader view is no longer a "nice-to-have"—it's essential for finding unique opportunities in today's interconnected market.
Common Questions About Tracking Stocks
Even with the best tools in your arsenal, getting into the weeds of stock tracking can bring up some questions. That's totally normal. Getting the right answers from the start is what separates the traders who make confident moves from those who are always second-guessing. Let’s clear up a few of the most common things people ask when they start tracking stocks more seriously.
One of the first things that trips people up is what happens outside the regular 9:30 AM to 4:00 PM ET trading day. A lot of the real action happens in these off-hours, especially when a company is reporting earnings.
Can I Track Pre-Market and After-Hours Activity?
Yes, you absolutely can—and frankly, you should. ChartsWatcher gives you the full picture with complete extended-hours trading data. You can flip this on right in your chart settings to see every tick of price action during pre-market (4:00 AM - 9:30 AM ET) and after-hours (4:00 PM - 8:00 PM ET) sessions.
But here’s the real game-changer: you can set your smart alerts to trigger during these extended periods. This is a must. Key news like earnings reports almost always drops outside of regular hours. Without pre-market and after-hours alerts, you’re flying blind and might miss a huge gap up or, worse, a gap down that blows up your position.
How Do I Add Technical Indicators to My Charts?
This part is easy. When you’ve got a stock chart pulled up, just look for a button labeled "Indicators" or "Studies"—it's usually right at the top of the chart window. Clicking it pops open a menu where you can find and add just about any indicator you can think of.
For instance, you could quickly add:
- Moving Average Exponential (EMA) to smooth out price action and see the trend.
- Relative Strength Index (RSI) to get a read on whether a stock is overbought or oversold.
- MACD (Moving Average Convergence Divergence) to measure the momentum behind a move.
Once an indicator is on your chart, you can tweak its settings. Want to switch a moving average from a short-term 50-day to a long-term 200-day? No problem. You can dial in the settings to perfectly fit the way you trade.
The real edge isn't just slapping indicators on a chart; it's understanding how they work together. Combining a trend indicator like an EMA with a momentum indicator like the RSI gives you a much stronger, more reliable signal than just using one on its own.
What Is the Best Way to Track an Entire Industry?
If you're trying to keep tabs on an entire sector, monitoring dozens of individual stocks is a recipe for burnout. The smarter, more efficient way to do it is to track a relevant Exchange-Traded Fund (ETF). An ETF is basically a basket of stocks from one specific industry, giving you a clean, bird's-eye view of how the whole sector is performing.
Let's say you want to know what's happening in the semiconductor space. Instead of tracking 20 different chip stocks, you could just watch the VanEck Semiconductor ETF (SMH). By analyzing SMH's chart, volume, and news, you instantly get a feel for the health of the entire industry.
You can then keep a smaller, more focused watchlist of the top dogs within that ETF—like NVDA or AMD—for when you want to dive deeper. This two-level approach gives you both the big-picture context and the granular detail you need to make great decisions.
Ready to stop just watching the market and start actually understanding it? ChartsWatcher gives you the professional-grade tools to build smarter watchlists, set alerts that do the work for you, and design a custom dashboard that puts you in full control.
