How to Read Stock Market Graphs A Beginner's Guide
Learning how to read a stock chart is like learning to decode the story of a company's performance, told through price and time. At its core, it's about understanding the two main axes—price on the vertical axis and time on the horizontal—and getting familiar with the common ways this data is visualized. This skill is what turns a confusing mess of market information into a clear, actionable story.
Your Starting Point for Reading Market Graphs
Jumping into stock charts for the first time can feel like trying to read another language. But the main idea is actually pretty simple. Every single chart, no matter how complex it looks, is just telling a story about the constant battle between buyers and sellers.
Once you learn to interpret these visual cues, you stop guessing about a stock’s future and start making educated decisions based on its history and the market's mood. This isn't just a skill for professional day traders; it's a must-have for anyone who's serious about their investments.
The image below breaks down the fundamental pieces of a standard stock chart, showing how price, time, and trading volume all come together.
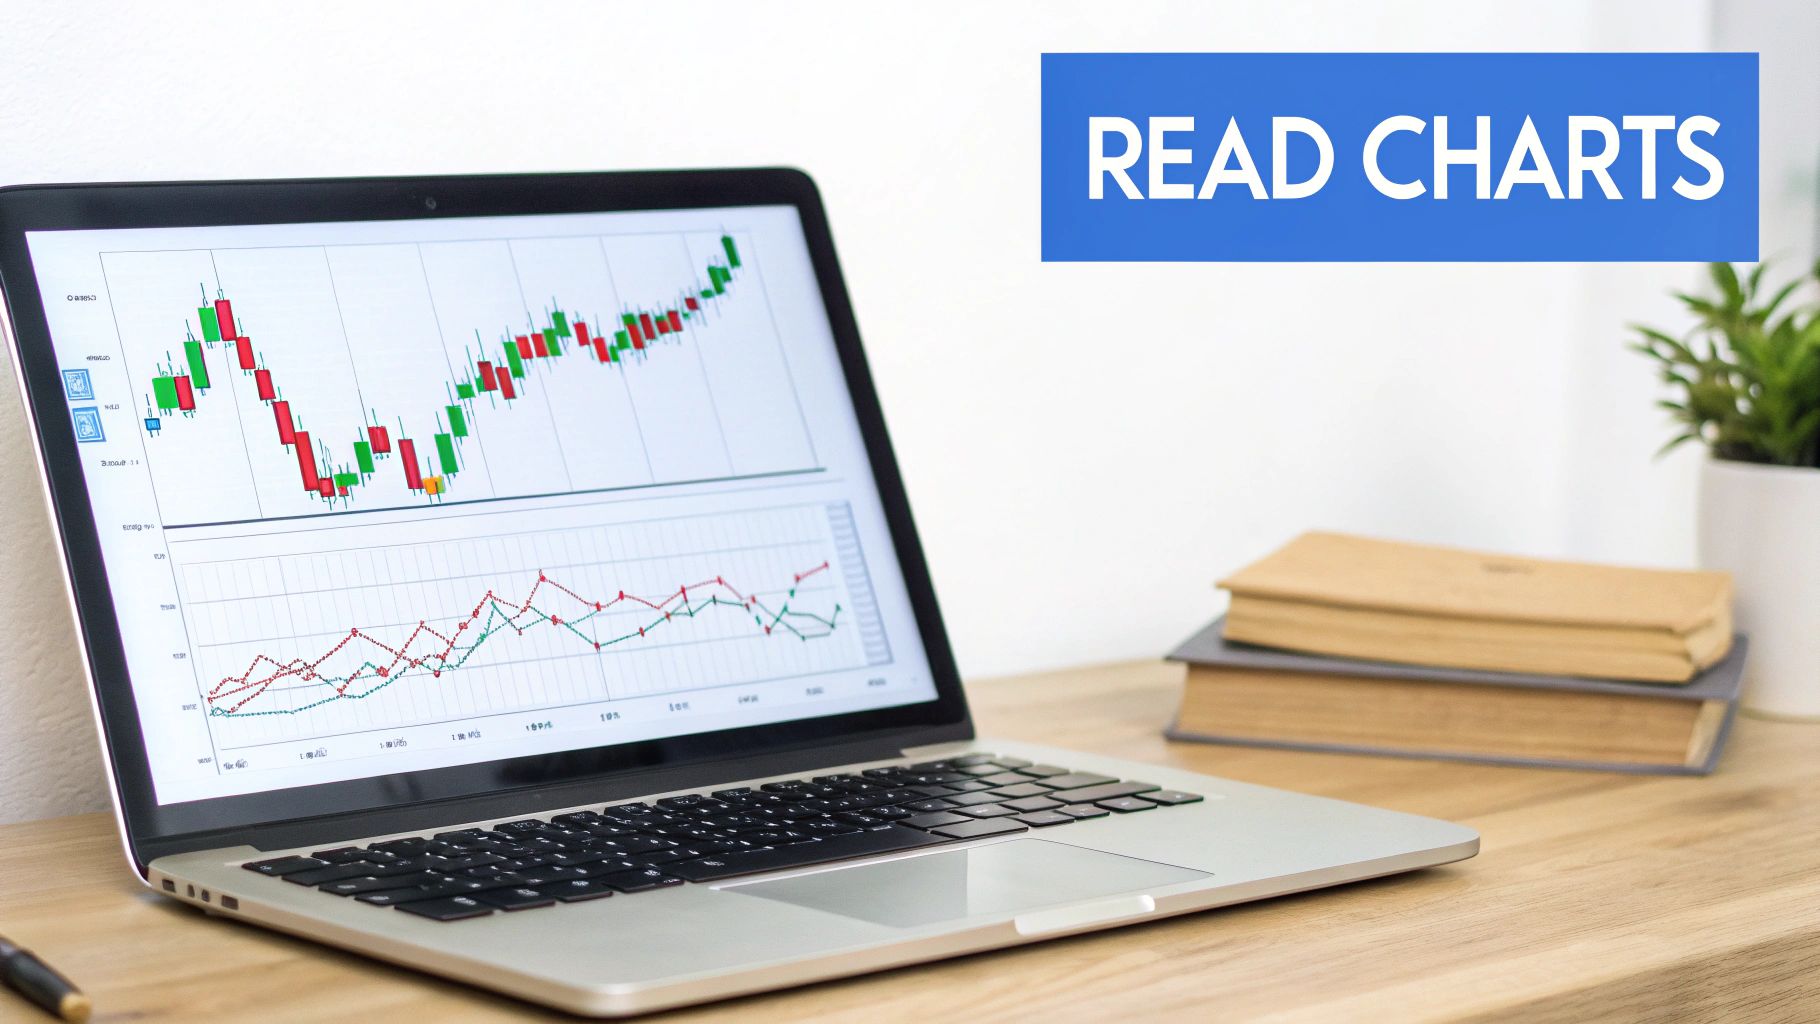
This example shows exactly how price movements are tracked over a set period, giving you a clear visual history of how the asset has been performing.
The Language of the Axes
Every stock chart is built on a straightforward framework. The vertical y-axis always shows the price, while the horizontal x-axis always shows time.
You can adjust that time frame to fit your strategy—from seconds to decades. A long-term investor might zoom out to a five-year chart with monthly data points, while a day trader will live on a one-day chart broken down into one-minute intervals. Getting this basic structure down is the first step before you can tackle more advanced concepts. It’s the canvas where all the price action happens.
Why Visual Analysis Matters
So, why not just stare at a spreadsheet full of numbers? Because a graph instantly shows you patterns and trends that raw data hides. With just a quick glance, you can spot:
- The Overall Trend: Is the stock generally climbing, falling, or just moving sideways?
- Volatility: Are the price swings big and erratic or small and steady?
- Key Price Levels: Are there specific prices where the stock seems to repeatedly hit a ceiling or a floor?
A great way to practice is by studying charts of major indices like the S&P 500 to get a feel for the broader market. Since its creation in 1957, the S&P 500 has become the main benchmark, representing over 80% of the U.S. equity market. Historically, it has delivered an average annual return of roughly 9.3%. Its charts often show a tendency for mean reversion, where a bad start to a year is often followed by a comeback. You can dig into more detailed analysis of these kinds of market trends on Fidelity's market commentary page.
Key Takeaway: Reading stock graphs isn't about predicting the future with 100% certainty. It's about understanding probabilities. You're identifying historical patterns to give yourself an edge in your decision-making.
This ability to quickly size up the market's psychology is what makes chart analysis so powerful. It transforms abstract financial data into a clear picture you can act on.
Decoding the Three Main Types of Stock Charts
First things first, let's get one thing straight: not all stock charts are created equal. When you're learning how to read market graphs, you'll quickly notice that different chart types can tell the same story in completely different ways, each highlighting unique aspects of a stock's price action.
To build a solid foundation, you need to get comfortable with the three most common formats you'll see in any trading platform. The one you choose really depends on your goal—are you trying to get a quick, big-picture view of a long-term trend, or are you digging into the nitty-gritty of a single day's trading chaos?

The Line Chart: Simplicity and Clarity
The line chart is the simplest of the bunch. It's just a single, continuous line that connects a series of data points, which is usually the closing price for each period.
Think of it as the 30,000-foot view. By filtering out all the noise of intraday price swings, a line chart makes it incredibly easy to spot long-term trends and major patterns. It answers one question quickly and effectively: "Overall, is this thing going up, down, or sideways?"
Because it's so straightforward, the line chart is perfect for:
- Long-Term Investors: Great for analyzing performance over months or years.
- Beginners: It’s a fantastic starting point for getting comfortable with charts without feeling overwhelmed.
- Comparing Multiple Stocks: You can easily overlay several line charts to see how different assets are performing against each other.
But its simplicity is also its biggest weakness. The line chart leaves out crucial details, like the opening price, the day's high, and the day's low.
The Bar Chart: Adding More Detail
Next up is the bar chart, often called an OHLC chart (for Open, High, Low, Close). This format gives you a much deeper look into what happened during each trading session. Each "bar" on the chart is a vertical line that tells a four-part story.
The very top of the vertical line shows the highest price the stock hit, and the bottom shows the lowest. Then, you'll see two small horizontal ticks. The tick on the left marks the opening price, and the one on the right marks the closing price.
This structure lets you see the price range and volatility at a glance. A long bar means there was a big price swing and high volatility. A short, stubby bar points to a quiet, stable trading session.
Pro Tip: The relationship between the open and close ticks is everything. If the closing tick (right) is higher than the opening tick (left), the price went up. If it’s lower, the price fell.
Bar charts strike a great balance between providing enough information without being overly complex, which is why they're a favorite for many technical analysts.
The Candlestick Chart: The Trader's Choice
Candlestick charts are, without a doubt, the most popular and information-rich format used by traders today. They show the same four data points as a bar chart (open, high, low, and close) but in a way that’s much more visually intuitive.
Each candlestick has two main parts:
- The Body: This is the thick, rectangular part that represents the range between the opening and closing prices.
- The Wicks (or Shadows): These are the thin lines sticking out from the top and bottom of the body, showing the highest and lowest prices reached.
The real magic is in the color of the body. A green (or white) body means the closing price was higher than the opening price—a win for the buyers (bulls). A red (or black) body means the close was lower than the open, marking a win for the sellers (bears).
This visual storytelling is what makes learning to read candlestick charts so powerful. The size and color of the body, combined with the length of the wicks, form patterns that can reveal a ton about market psychology. For example, a long green body with short wicks suggests strong, confident buying pressure, while a tiny body with long wicks signals indecision.
Mastering these patterns is a huge step in your trading journey. You can dive deeper with our complete guide to understanding candlestick graphs.
Using Indicators to Understand Price Action
A price chart tells you what a stock did. Technical indicators help you figure out why it did it—and what it might do next.
Think of them as different lenses you can apply to a chart. They add crucial layers of context to the raw up-and-down price movements, helping you measure a trend’s strength, gauge market momentum, and even spot potential reversals before they happen.
Without indicators, you're flying blind. Sure, a big green candle looks great on its own, but if it happened on weak volume, it might just be a trap. By adding a few key indicators, you start to read between the lines and make much sharper decisions.
The Importance of Volume
Volume is one of the most honest indicators you’ll find. It's simple: it just shows you how many shares were traded during a given period. You'll typically see it as a series of vertical bars sitting right below the price chart.
The core principle here is dead simple: volume confirms trends. A price move that’s backed by high volume is far more believable than one that happens on a trickle of shares. It tells you there's real conviction and participation behind the move.
- High Volume on an Uptrend: This is what you want to see. It suggests strong buying interest and confirms the bullish momentum. It’s a sign that a lot of people agree the price should be heading higher.
- High Volume on a Downtrend: This signals heavy selling pressure and validates the bearish move. It shows there's a strong consensus that the stock is overvalued.
- Low Volume Price Moves: Be wary of these. A price spike on low volume often screams "head fake." It suggests a lack of genuine interest and means the move might not last.
Key Insight: Keep an eye out for sudden, massive spikes in volume. This often happens right before a major price move. When volume is way out of the ordinary, it's a clear signal that something big is brewing.
Think of volume as the fuel in a car. A trend can't get very far without the conviction that high volume provides.
Smoothing Price with Moving Averages
Let's face it, price action can be choppy and chaotic. It's often hard to see the forest for the trees. This is exactly where Moving Averages (MAs) become so valuable. A moving average smooths out the day-to-day price noise by calculating the average price over a specific period, revealing the underlying trend more clearly.
For instance, a 50-day moving average simply adds up the closing prices of the last 50 trading days and then divides by 50. As each new day passes, the oldest price is dropped and the latest one is added, making the average "move" along with the price.
Two of the most-watched MAs by traders everywhere are:
- The 50-day Moving Average: This is often seen as the key marker for the medium-term trend.
- The 200-day Moving Average: Many traders consider this the ultimate line in the sand for the long-term trend. If a stock is trading above its 200-day MA, it's generally considered to be in a healthy, long-term uptrend.
Moving averages also work as dynamic support and resistance levels. In a strong uptrend, it's common to see a stock pull back to its 50-day MA, bounce right off it, and then continue its climb higher. These interactions give you clear potential spots to consider entering or exiting a trade. To go deeper, you can explore a full range of technical analysis indicators explained on ChartsWatcher.
Gauging Momentum with the Relative Strength Index
While moving averages tell you the trend's direction, the Relative Strength Index (RSI) tells you about its speed and strength. The RSI is what’s known as an oscillator, moving on a scale from 0 to 100. Its main job is to signal when a stock might be overbought or oversold.
Here’s a quick guide to reading the RSI:
| RSI Reading | Market Condition | What It Suggests |
|---|---|---|
| Above 70 | Overbought | The stock has run up very quickly and might be due for a pullback or a rest. |
| Below 30 | Oversold | The stock has fallen hard and fast, and could be poised for a bounce or reversal. |
| Around 50 | Neutral | Momentum is balanced, with no clear advantage for buyers or sellers. |
A word of caution: the RSI isn’t a standalone buy or sell signal. A stock can stay "overbought" for a very long time in a monster uptrend.
Where the RSI really shines is in spotting divergence. A bearish divergence, for example, happens when the stock’s price pushes to a new high, but the RSI makes a lower high. This is a classic warning sign that the upward momentum is running out of steam and a reversal could be around the corner.
By putting these three indicators together—Volume, Moving Averages, and RSI—you build a much more complete picture of what's happening. Volume shows you the conviction, MAs define the trend, and RSI measures the momentum. Together, they turn a simple price chart into a rich source of actionable intelligence.
How to Identify Trends, Support, and Resistance
Reading a stock chart is one thing. Seeing its underlying structure is something else entirely. This is where you graduate from just watching the price wiggle around to actively anticipating its next move. The whole game boils down to identifying trends and mapping out the crucial battlegrounds known as support and resistance levels.
These concepts aren't just technical jargon; they're rooted in raw market psychology. They give us a visual representation of the collective fear and greed of every trader in the game, creating predictable zones where the balance of power between buyers and sellers is likely to tip. Getting a handle on this gives you a real framework for understanding the market's flow and spotting high-probability trade setups.
Visualizing the Market's Direction with Trend Lines
The simplest way to start seeing the structure is by drawing trend lines. A trend line doesn’t just show you where the price has been—it helps project where it might be going. Think of it as your visual guide to the dominant market direction.
There are really only two types of trends you'll be hunting for:
- Uptrends: These are defined by a clear series of higher highs and higher lows. Buyers are in the driver's seat, consistently pushing the price up and defending it at progressively higher levels whenever it dips.
- Downtrends: The opposite story. Here you'll see a series of lower highs and lower lows. Sellers have the upper hand, smashing the price down and killing any significant rally before it can get started.
Drawing an effective trend line is as simple as connecting the dots. For an uptrend, you draw a line connecting at least two of the major "higher lows." For a downtrend, you connect two or more of the "lower highs." The more times the price comes down to touch and respect that line, the more significant that trend becomes.
Pro Tip: A trend line acts like a dynamic boundary. In a healthy uptrend, this line becomes a kind of diagonal support. Many traders I know look for buying opportunities precisely when the price pulls back to touch a well-established uptrend line.
Understanding Support and Resistance Zones
While trend lines show you the direction of travel, support and resistance levels mark specific price zones where a serious fight between buyers and sellers is expected. They are the horizontal floors and ceilings on your chart.
Support is a price level where a downtrend is expected to stall out because of a concentration of demand. Picture it as a floor where buyers suddenly get more aggressive and sellers lose their nerve, causing the price to bounce. This often happens at previous lows, where traders who missed the last move up are now chomping at the bit to get in.
Resistance, on the other hand, is the ceiling. It’s a price level where an uptrend is likely to hit a wall or even reverse, thanks to a flood of supply. At this point, sellers overwhelm buyers. This level often forms at previous highs, where traders decide it's time to take profits or even bet on a price drop.
It's critical to remember that these levels are rarely a single, exact price. It's much more accurate to think of them as zones. A stock might dip a little below a support level or poke just above resistance before snapping back. The more times a price tests one of these zones without breaking through, the stronger that level is considered to be.
The Psychology Behind These Key Levels
Support and resistance aren't just lines on a graph; they are direct reflections of human emotion and memory. Here’s a quick look at the psychology that gives these levels their power:
| Level | Primary Emotion | What's Happening |
|---|---|---|
| Support | Greed & Regret | Buyers who missed the last rally see a second chance to get in at a "discount," which creates fresh demand. |
| Resistance | Fear & Relief | Investors who bought at a previous high are just happy to sell at breakeven, creating a wall of supply. |
When a stock approaches a prior low (support), buyers who were kicking themselves for not buying earlier see their opportunity. At the same time, short-sellers might start buying to close their positions, adding even more fuel to the buying pressure.
The exact opposite happens at resistance. All those folks who bought at the last peak are now desperate to sell and get their money back. On top of that, smart traders who bought lower start taking profits. This combined selling pressure creates a formidable ceiling.
A truly pivotal event in technical analysis is when one of these levels finally breaks. When a stock price smashes decisively through a resistance level, that old ceiling can become the new floor. This is what traders call resistance turning into support. Conversely, when a support level is broken, it can become a new resistance level. These breakout moves, especially when they happen on high volume, often signal the start of a powerful new trend.
Putting It All Together: A Practical Walkthrough
Theory is one thing, but application is everything. It's time to move from looking at individual concepts to conducting a real-world analysis, weaving everything we've covered into a cohesive story. This is how you really learn to read stock market graphs like a pro—by layering tools and seeing how they all interact.
Let's say we've just pulled up a daily candlestick chart for a popular tech stock on a platform like ChartsWatcher. The first thing I always do is get my bearings. We're looking at a daily chart, which means each candlestick captures a full day of trading. This gives us a solid, medium-term view of the trend.
The infographic below gives a great visual of the basic thought process for analyzing trends, which is always the foundation of reading any chart.
This flow chart nails the core decisions any analyst makes: figuring out if the stock is in an uptrend, a downtrend, or just chopping sideways between support and resistance.
Drawing Key Levels and Trends
With the chart open, the first real action is to map out the market structure. I always start by drawing the trend lines. For this example, we'd look for a series of higher lows and connect them to define the current uptrend. Instantly, that line becomes our dynamic support—a visual guide showing where buyers have consistently shown up.
Next up, we find the horizontal battlegrounds. We'll scan the chart for a price level where the stock has repeatedly hit a ceiling and pulled back. That’s our resistance zone. Then, we mark the price floor where it has bounced multiple times, which establishes a clear support zone. Just like that, the chart is no longer a random collection of candles; it has a defined structure.
Personal Insight: Don't get hung up on drawing these lines perfectly. Think of them as broad "zones" rather than exact price points. Markets are messy and driven by human emotion, not robotic precision. Prices will often poke slightly above or below these levels.
Layering On Essential Indicators
Once the structure is in place, it’s time to add context with a few key indicators.
First, we'll add the 50-day and 200-day moving averages. We can see the price is trading well above both, and the faster 50-day MA is above the slower 200-day MA. This is a classic textbook sign of a healthy, bullish trend.
Next, we glance at the Volume bars at the bottom. I'm looking for confirmation. We notice that on days with big green candles (strong up-moves), the volume is significantly higher than average. This tells us there's real conviction and institutional money behind the rally. On the flip side, during the small pullbacks with red candles, the volume is light, which suggests the selling isn't aggressive. It's just profit-taking.
Finally, we'll add the Relative Strength Index (RSI). It’s been oscillating between 50 and 70, indicating strong momentum that isn't dangerously overextended yet. Crucially, we see no bearish divergence—the RSI is making new highs right along with the price, which confirms the trend's health.
Synthesizing the Data Into a Narrative
Now, we bring it all together into a single, actionable story. Here’s what our chart is telling us:
- Primary Trend: The trend is strongly bullish. This is confirmed by the uptrend line and the positive alignment of the moving averages.
- Market Conviction: The big upward moves are backed by high volume, which signals strong participation from big players. This isn't just retail enthusiasm.
- Momentum: The RSI shows healthy, sustainable momentum. It's not in extreme overbought territory, which suggests the trend has more room to run.
- Key Levels: The next major test for this stock is the resistance zone we marked. A breakout above that level on high volume would be a powerful signal that the next leg up is starting.
This layering process is just as vital for understanding the bigger picture. For instance, the U.S. stock market index US500 hit an all-time high of 6,921.75 points in October 2025, which was a gain of over 20% year-over-year. That 20% number tells an analyst about powerful upward momentum, but a more recent 2.44% monthly gain shows how shorter-term trends build into that larger narrative. You can dig into these market cycles on sites like Trading Economics.
By layering your analysis like this, you move from just looking at a graph to truly reading the story it tells.
Got Questions About Reading Stock Charts?
When you're starting out, a few questions always seem to pop up. Getting them answered is key to building some real confidence and sidestepping the mistakes every new trader makes. Let's dig into some of the most common ones I hear.
What Time Frame Should I Use on a Stock Chart?
This is a big one, and the answer is: it depends entirely on your strategy. There's no magic "best" setting here. You have to match the chart to what you're trying to accomplish.
-
Long-Term Investors: If you're buying for the long haul—months or even years—you should be living on the daily, weekly, or monthly charts. These filter out the day-to-day noise and give you a clear picture of the major, underlying trends that actually matter to your investment thesis.
-
Swing Traders: Holding positions for a few days to a few weeks? Your sweet spot is the daily and 4-hour charts. I find this combination is perfect for spotting the primary trend on the daily, then zooming in on the 4-hour to nail down a much sharper entry or exit.
-
Day Traders: If you're in and out of trades on the same day, you need to think small. The 15-minute, 5-minute, and even 1-minute charts are where the action is, allowing you to catch those quick, small price moves that add up.
A powerful technique that tons of pros use is called multiple time frame analysis. You start high (like the daily) to figure out which way the river is flowing, then you drop down to a lower time frame (like the hourly) to pick your exact spot to jump in. This simple habit helps keep you trading with the market's momentum, not fighting against it.
How Many Technical Indicators Should I Use?
When it comes to indicators, less is almost always more. I know how tempting it is to plaster your chart with every shiny tool you can find, but it's a trap. This usually leads straight to "analysis paralysis," where you’ve got so many conflicting signals you can't pull the trigger on anything.
Most of the seasoned traders I've worked with stick to just a handful of indicators they know inside and out. A really solid, clean setup often just includes:
- A trend indicator (like a couple of Moving Averages) to see the overall direction.
- A momentum indicator (like the RSI) to see how much gas is in the tank.
- Volume to confirm that there's real conviction behind a price move.
Remember, indicators are there to confirm what you're already seeing in the price action. Price is king. If your indicators say one thing but the candles are telling you another story, trust the candles.
Can I Predict Stock Prices by Reading Graphs?
Absolutely not. And this might be the most critical lesson of all.
Technical analysis is a game of probabilities, not predictions. No chart pattern or indicator on earth can tell you the future with 100% certainty. The market will always find a way to surprise you.
What reading charts can do is help you spot historical patterns that give you a statistical edge. But a surprise earnings report, a sudden news event, or a random tweet can blow up the most perfect-looking setup in a heartbeat.
The goal isn't to be right every single time—that's impossible. The real goal is to build a system where your winning trades are bigger than your losing trades. That’s why disciplined risk management, like always using a stop-loss to define exactly how much you're willing to lose, is completely non-negotiable if you want to stick around.
Ready to put these ideas into practice on a professional-grade platform? ChartsWatcher provides the powerful, real-time tools you need to analyze market structure, customize your charts, and build a trading strategy based on data, not guesswork. Check out our features and find the right plan for you.
