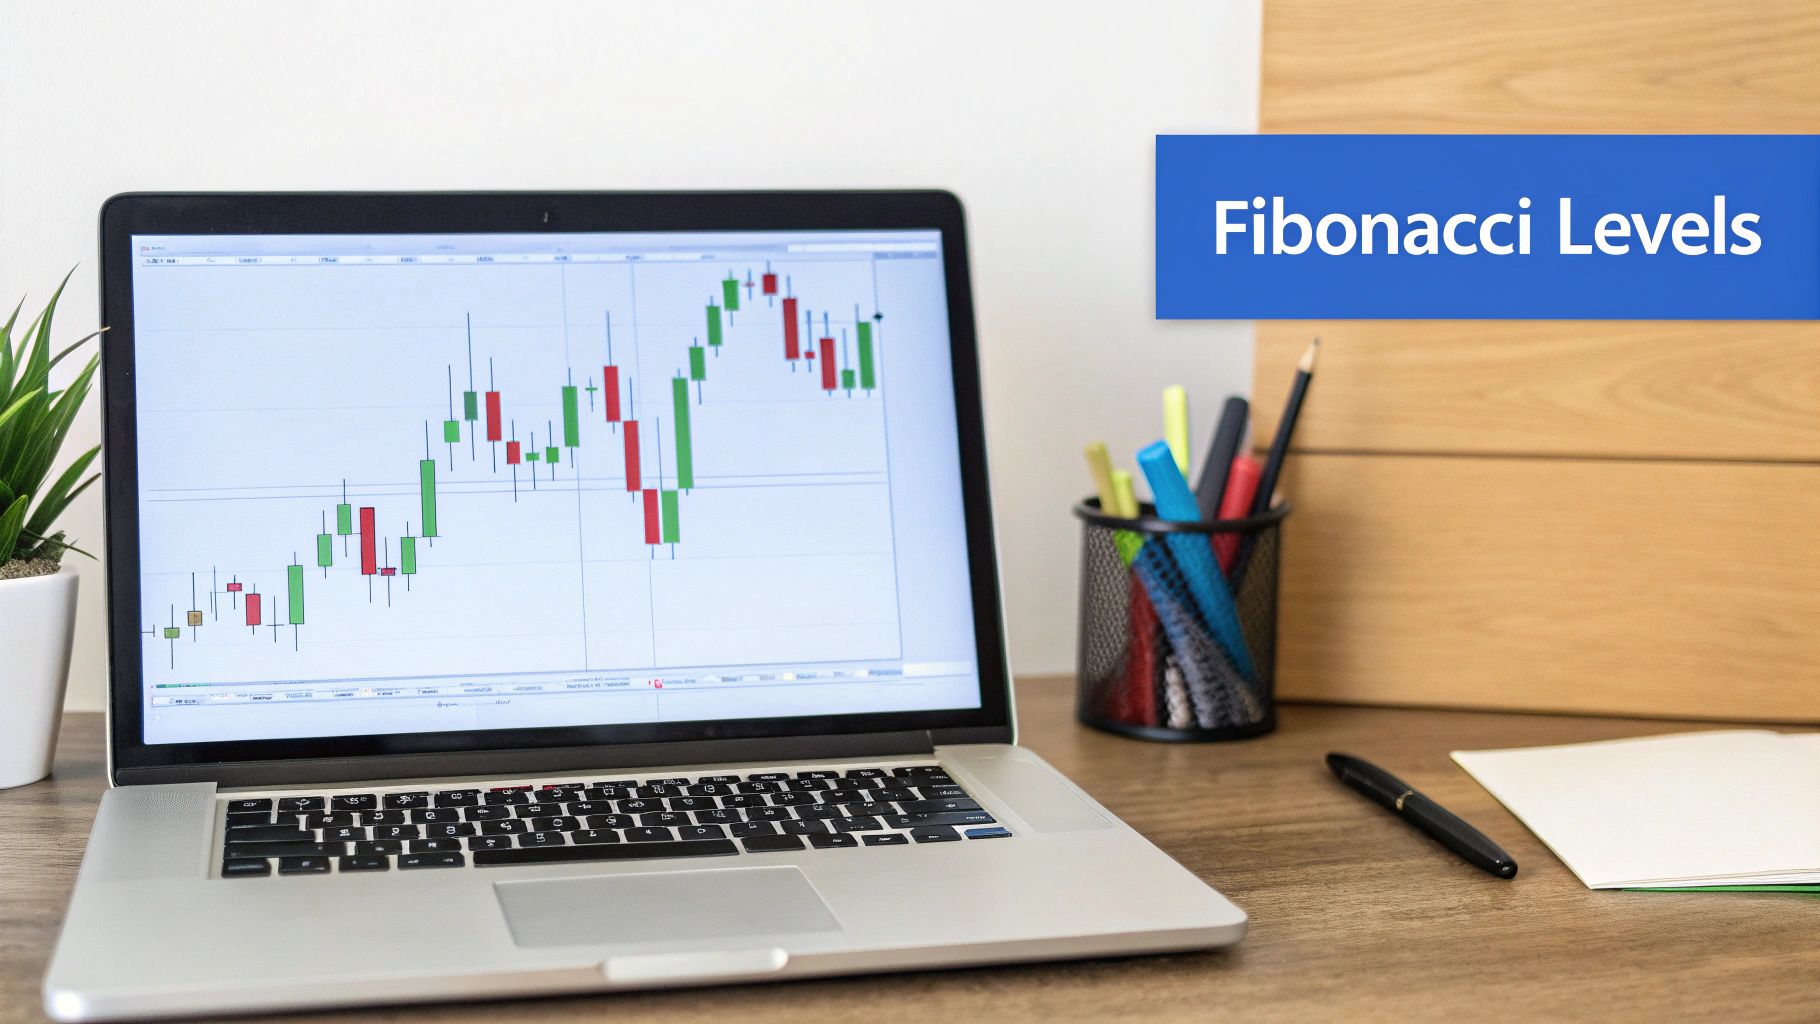
How to Draw Fibonacci Retracements Like a Pro Trader
To really get the hang of drawing Fibonacci retracements, you first need a clear trend to work with. Find a significant price move, then pinpoint its absolute highest point (the swing high) and its lowest point (the swing low). From there, you'll use your charting tool to connect these two points. For an uptrend, you draw from the low up to the high. For a downtrend, you go from the high down to the low. This simple action plots the horizontal lines that will become your roadmap for potential pullbacks.
What Are Fibonacci Retracements and Why Do They Work
Before you even click the mouse, it’s worth understanding what these lines actually mean. They aren't just random percentages on a chart. Think of them as a reflection of market psychology—the natural ebb and flow of price action. These levels highlight potential support and resistance zones where the constant battle between buyers and sellers often finds a temporary truce.
The whole idea is built on a simple market truth: prices rarely move in a straight line. After a strong push in one direction, the market needs to breathe. Prices tend to "retrace" or pull back some of that initial move before, hopefully, continuing the original trend. Fibonacci levels help us measure just how deep that pullback might be.
The Ratios That Matter
The tool gets its predictive power from specific ratios derived from the Fibonacci sequence, a mathematical pattern found all over nature. When it comes to trading, a few levels are absolutely critical.
This quick-reference table breaks down the main Fibonacci levels and what they generally signal about market behavior and potential price moves.
Key Fibonacci Retracement Levels and Their Significance
| Fibonacci Level | Type of Retracement | Typical Market Behavior |
|---|---|---|
| 38.2% | Shallow Retracement | Indicates a strong, fast-moving trend. The pullback is minor, suggesting bulls (in an uptrend) or bears (in a downtrend) are still firmly in control. |
| 50.0% | Midpoint Retracement | A critical psychological level. While not an official Fibonacci number, it represents the halfway point of the initial move. A failure to hold here often signals weakening momentum. |
| 61.8% | Golden Ratio | The most significant and watched level. A bounce from the "golden ratio" is a powerful confirmation that the original trend is likely to resume. |
These levels work so often because they become a kind of self-fulfilling prophecy. Millions of traders, from retail investors to big-shot institutional algorithms, are all watching the exact same lines. When a price approaches a major zone like the 61.8% retracement, a wave of buy orders can create a solid floor of support, pushing the price back up.
You can dive deeper into the core concepts in our complete guide on what Fibonacci retracements are and how to use them.
At its heart, trading with Fibonacci is less about the math and more about understanding human behavior. The levels simply highlight the price points where traders are most likely to feel fear, greed, or uncertainty, leading to predictable reactions.
Historically, the 61.8% "golden ratio" has proven to be a particularly reliable zone. In fact, some backtests on major indices show it acts as a key support or resistance level in about 40% of trending market reversals. Further studies have found that roughly 65% of futures trends that reach this point either reverse or stall before continuing, making it a critical level to watch.
Nailing the Swing Points for Accurate Analysis
The entire foundation of a solid Fibonacci analysis comes down to one thing: picking the right start and end points. If you choose the wrong swing high and swing low, your retracement levels will be useless—just random lines cluttering your chart instead of a powerful predictive tool. This is hands-down the most common mistake traders make, but it's completely avoidable once you learn how to read market structure.
Your mission is to isolate the most significant, structurally relevant price move. You’re looking to capture the primary impulse wave of a trend, not the minor chop and noise that happens along the way. Think of it like finding the main characters in a story; the plot revolves around them, not the background extras.
Differentiating Major Swings from Minor Noise
So, how do you spot these "main character" swings? It really just comes down to training your eye to see clear, decisive market movements. A strong swing has a defined beginning and end, with a clean, directional move in between.
Look for these characteristics to lock in on a structurally significant swing:
- A Clear Start: The move should kick off from a distinct bottom (swing low) or top (swing high). This is often a spot where the market reversed its previous direction with real conviction.
- Strong Momentum: The price action between your two swing points should be relatively clean. You want to see larger-bodied candles and a consistent directional push, not a messy, sideways grind.
- A Definitive End: The swing wraps up at a new peak or trough where momentum stalls out and the price starts to pull back or consolidate. This endpoint becomes the second anchor for your Fibonacci tool.
Whatever you do, avoid anchoring your tool on small, insignificant pullbacks within a larger move. Those are just the market taking a "breath," and they don't represent the primary trend you want to measure. Drawing Fib levels on this minor noise will just give you tight, unreliable zones that are likely to get run over.
The best swing points are obvious. If you have to squint and second-guess whether a move is significant, it probably isn't. The most reliable swings are the ones that jump off the chart and clearly define the recent trend.
Timeframe Considerations for Swing Selection
The timeframe you trade on massively influences which swing points matter. A major swing on a weekly chart is made up of dozens of smaller swings on a 15-minute chart. Your analysis absolutely has to align with your trading horizon.
-
Long-Term Traders (Daily/Weekly Charts): You should be looking for the major, trend-defining moves that play out over weeks or months. Ignore the daily noise and focus on the primary highs and lows that mark significant shifts in market sentiment. These swings give you the macro framework.
-
Swing Traders (4-Hour/Daily Charts): Your focus will be on the more immediate, clear trends that last several days or a few weeks. Your swing high and low will capture a complete leg of a trend within that broader market structure.
-
Day Traders (5-Minute/15-Minute Charts): Your swing points are going to be much more localized. You might anchor your Fibonacci tool to the high and low of the current trading session or a distinct impulse move that took a few hours to play out.
The key is consistency. If you're looking for an intraday setup on a 15-minute chart, don't use a swing low from three months ago. Your swing points have to be relevant to the price action and timeframe you're actively trading.
A great practice is to identify the macro trend on a higher timeframe (like the daily) and then drop down to a lower timeframe (like the 1-hour) to find the precise swing points for drawing your levels. This multi-timeframe approach ensures your trade is aligned with the bigger picture.
For instance, you might spot a clear uptrend on the daily chart of a stock. From there, you could switch to a 4-hour chart to identify the most recent significant swing low and swing high within that uptrend. This helps you pinpoint high-probability entries for a pullback trade that’s flowing with the dominant market current. Learning how to draw Fibonacci retracements correctly starts and ends with this crucial skill of swing point selection.
Applying the Tool to Uptrends and Downtrends
Once you’ve nailed down how to spot significant swing points, the next step is actually applying the Fibonacci tool. This is where the rubber meets the road, and the direction of the market—uptrend or downtrend—dictates everything.
How you draw your Fibonacci retracement levels is completely different for a bull move versus a bear move. Get this right, and you'll project potential pullbacks with precision. Get it wrong, and you’re just cluttering your chart with meaningless lines.
The simple act of dragging your mouse—from low to high or high to low—is what tells the tool whether you're looking for support or resistance. It’s a basic mechanical skill, but it’s the absolute core of the entire technique.
This flow chart breaks down the process for finding the right anchor points in an uptrend.
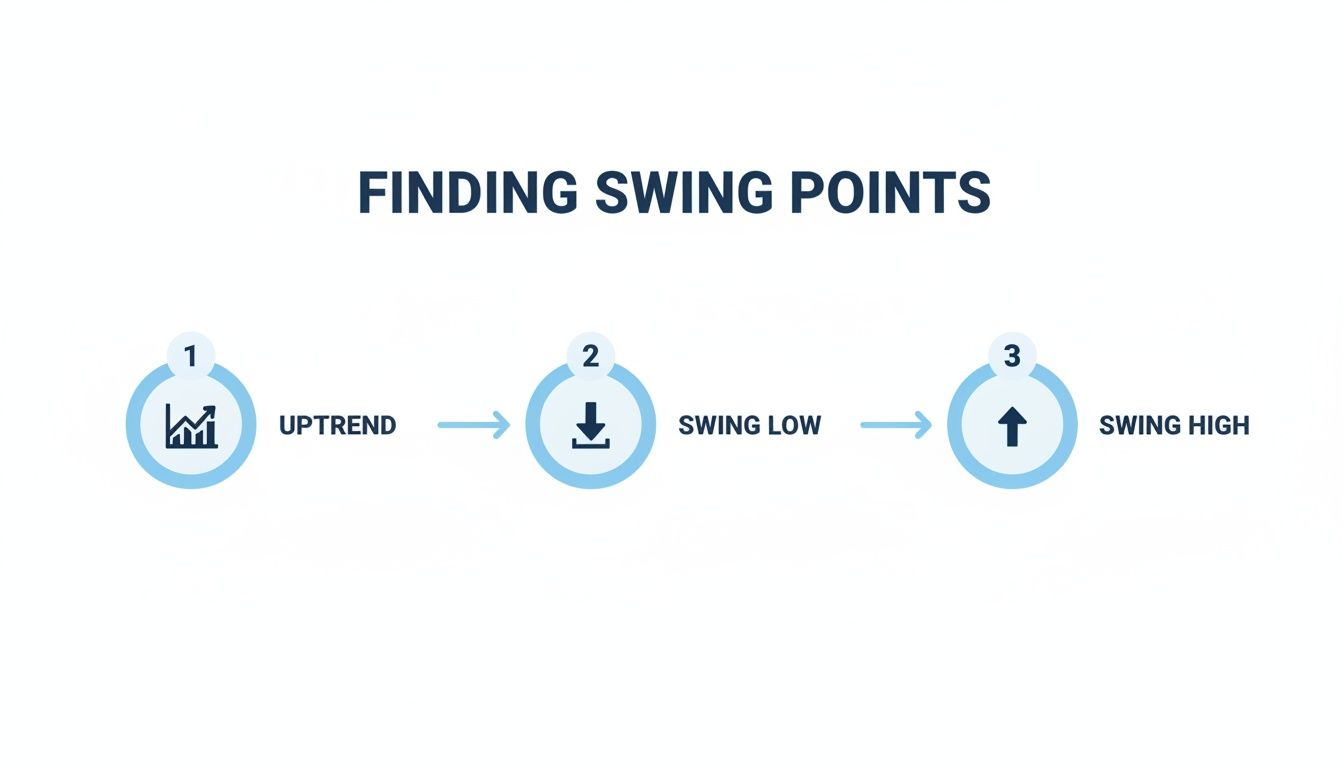
As the visual shows, for a bullish move, you first need to identify the swing low that kicked off the rally and then the swing high where it ran out of steam.
Drawing Retracements in a Bullish Uptrend
When a stock is clearly trending up—making a series of higher highs and higher lows—we expect pullbacks. After a strong run, the price needs to breathe before continuing its climb. The Fibonacci retracement tool is perfect for mapping out potential support zones where this pullback might find its footing.
To draw the levels correctly in an uptrend, you always start at the bottom and draw to the top.
- Select the Fibonacci Retracement Tool: In your charting software like ChartsWatcher, grab the Fib Retracement tool from your drawing panel.
- Identify the Swing Low: Find the absolute bottom of the price move you're analyzing. This is your first anchor point.
- Click and Drag to the Swing High: Click once on that swing low, then drag your cursor up to the absolute peak of that same move (the swing high) and release.
That's it. The platform will automatically plot the horizontal Fibonacci levels between those two points. In an uptrend, these levels (38.2%, 50%, and 61.8%) are your potential support zones. This is where traders watch for signs of a bounce, like a bullish candlestick pattern, to time an entry and ride the trend higher.
Drawing Retracements in a Bearish Downtrend
For a downtrend, you just flip the logic. When the market is bearish—making lower lows and lower highs—we use the Fib tool to pinpoint potential resistance levels. After a sharp drop, prices often have a relief rally before the downtrend resumes. These retracement levels help us spot where that bounce might fizzle out.
The process here is a mirror image of the uptrend method. You start at the top and draw down.
- Step One: Again, select the Fibonacci Retracement tool from your platform.
- Step Two: This time, locate the definitive swing high that started the big downward move. This is your first anchor.
- Step Three: Click on that swing high, hold the button, and drag your cursor down to the swing low where the move finally exhausted itself. Let go.
The tool will now project the key Fibonacci levels, which in this bearish context act as potential resistance. As the price rallies back into these levels, short-sellers are often waiting to jump in, pushing the price back down. Seeing a rejection at the 61.8% level, for example, can be a great signal for a short entry.
The core principle is simple: Always draw in the direction of the primary trend. For uptrends, draw up from low to high. For downtrends, draw down from high to low. This ensures your levels are measuring the retracement against the trend, which is exactly what you want.
This method isn't new; it gained serious traction in the markets after Ralph Nelson Elliott's work in the 1930s. His Elliott Wave Theory used these natural ratios to forecast market waves, and today they influence over 70% of modern technical strategies. On platforms like ChartsWatcher, traders apply this exact principle every day. You can learn how Fibonacci became a trading staple and explore more of its strategic uses.
Using Confluence to Validate Fibonacci Levels
Drawing a Fibonacci retracement on your chart is a great starting point, but it's just that—a start. A single Fib level is simply a line on a chart suggesting where the price might react. To turn that suggestion into a high-probability trading setup, you need more evidence. This is where the powerful concept of confluence comes into play.
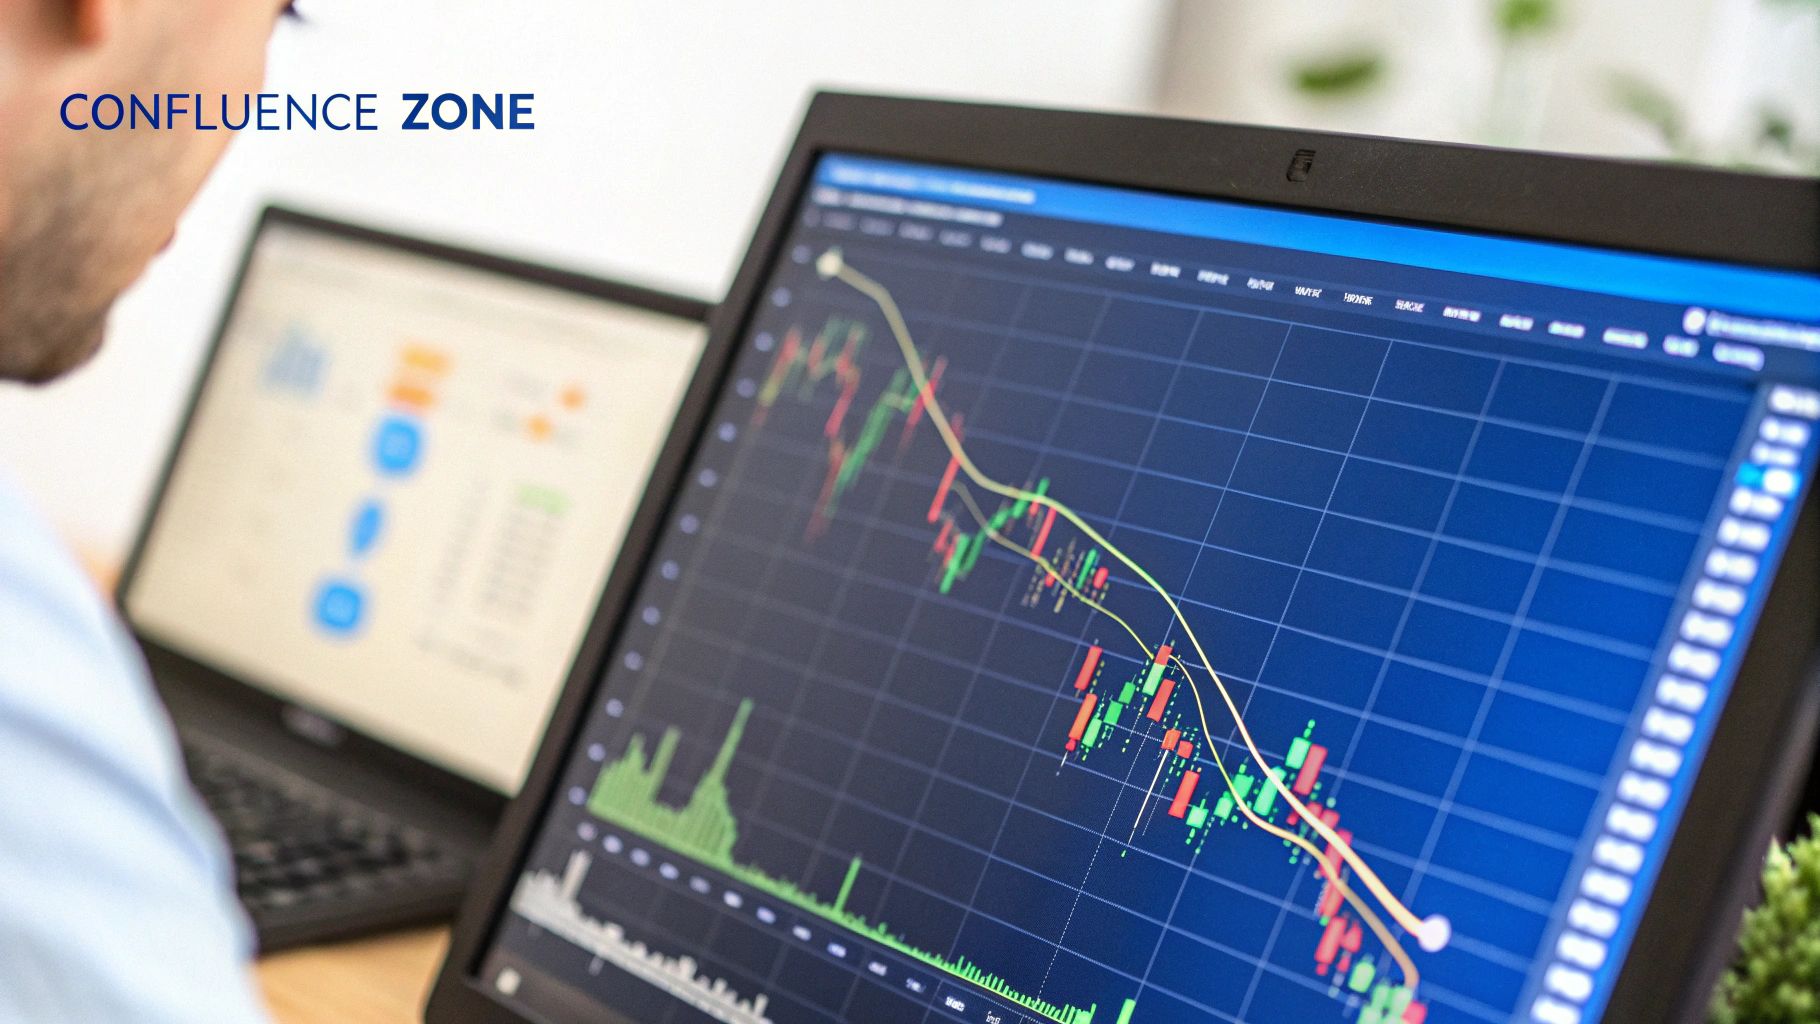
Confluence is all about finding areas where multiple, independent technical signals overlap. When your key Fibonacci level lines up with another form of support or resistance, its reliability skyrockets. It’s a sign that different groups of traders, all using different strategies, are eyeing the same price zone.
Think of it like building a case for a trade. One piece of evidence is interesting. Three or four pointing to the same conclusion? That's compelling. This multi-factor approach is often what separates traders who consistently find solid entries from those taking speculative guesses.
Moving Averages as Dynamic Support
One of the most effective ways to confirm a Fibonacci level is by overlaying key moving averages. While Fib levels are static horizontal lines, moving averages offer dynamic support and resistance that travel along with the price.
When a major moving average, like the 50-day Simple Moving Average (SMA) or the 200-day Exponential Moving Average (EMA), intersects with a Fibonacci level, that price zone becomes significantly stronger.
- The 50 SMA: Often seen as a medium-term trend guide, a pullback to a 50 SMA that also lines up with the 38.2% or 50% Fib level can be a classic trend-continuation signal.
- The 200 EMA: This is the line in the sand for long-term trends, watched closely by large institutions. If a deep pullback brings the price down to the 61.8% Fib level and it sits right on the 200 EMA, you've found a potent support zone.
This alignment shows that both short-term pullback traders (watching Fibs) and long-term trend followers (watching MAs) see value at that price, creating a powerful floor.
Checking Oscillators for Momentum Clues
Oscillators like the Relative Strength Index (RSI) or Stochastics don't measure price levels, but they excel at measuring momentum. They're perfect for telling you if a market is getting "overextended" and might be due for a turn. This adds a critical timing element to your analysis.
Let's say a stock in a strong uptrend pulls back to its 61.8% retracement level. If you glance at your RSI and see it has dipped below 30, it’s signaling an oversold condition.
This is a prime example of confluence. The price has hit a key support level (the 61.8% Fib), and momentum has reached an oversold state (RSI < 30). This combination creates a much higher probability for a bounce than either signal would on its own.
On the flip side, in a downtrend, a relief rally to a 50% Fib level that coincides with an overbought RSI reading (above 70) is a strong hint that the rally is running out of gas.
Reading Candlesticks at Key Levels
Finally, the most immediate confirmation comes from price action itself, specifically candlestick patterns. A Fibonacci level is a zone of potential reversal, but a candlestick pattern is the market confirming that the reversal is actually happening.
When the price arrives at a key retracement level, you need to stop and watch how it behaves. Don't just place a blind order. Instead, look for classic reversal signals forming right on or near your Fib line.
Some of the most powerful patterns to look for are:
- Hammer or Doji: At a support level (like the 50% or 61.8% Fib), a hammer shows that sellers tried to push the price down but buyers stepped in aggressively, closing the price near its high.
- Bullish or Bearish Engulfing: An engulfing pattern at a key Fib level is a very strong signal. A bullish engulfing candle at support shows that buying pressure has completely overwhelmed the previous selling pressure, often marking a decisive turning point.
By waiting for candlestick confirmation, you let the market show its hand before you commit your capital. This patience can dramatically improve your timing and reduce the risk of entering too early, only to see the price blow right through your level.
Building a simple checklist can help you spot these high-probability setups more consistently.
Confluence Checklist for High-Probability Fibonacci Trades
| Confirmation Signal | What to Look For | Strength of Signal |
|---|---|---|
| Moving Averages | A key MA (50, 100, 200) aligns with a Fib level (38.2%, 50%, 61.8%). | Strong |
| Previous S/R | The Fib level coincides with a prior swing high or low. | Strong |
| Trendlines | An established trendline touches the same price point as the Fib level. | Strong |
| Oscillator Divergence | Price makes a new low into a Fib level, but RSI/Stochastic makes a higher low. | Medium-Strong |
| Oversold/Overbought | RSI dips below 30 (oversold) at Fib support or rises above 70 (overbought) at Fib resistance. | Medium |
| Candlestick Pattern | A clear reversal pattern (Hammer, Engulfing, Doji) forms directly on the Fib level. | Medium |
| Volume Spike | A surge in volume as price tests the Fib level, indicating a battle between buyers and sellers. | Medium |
Combining Fibonacci levels with these confirmation signals transforms your chart from a map of possibilities into a strategic plan for action.
Automating Your Analysis with ChartsWatcher
Drawing Fibonacci retracements by hand is the best way to get a feel for how they work, but let's be honest—it's not a scalable strategy for an active trader. To go from just drawing lines on a chart to building a dynamic, responsive trading system, you need to bring in automation.
This is where a professional platform like ChartsWatcher becomes your workhorse. It helps you monitor dozens of potential setups without being glued to your screen all day. By automating the grunt work, you can shift your focus from endless searching to analyzing high-probability trades. Let's walk through how to set up alerts, build market scans, and save templates to make the Fibonacci tool a core part of your trading engine.
Setting Up Real-Time Fibonacci Alerts
There's nothing more frustrating than a missed opportunity. You map out your levels perfectly, step away for a bit, and come back to see the price tagged the 61.8% level and bounced exactly as you predicted—without you on board. Real-time alerts put an end to that.
Instead of just watching the chart and waiting, you can tell ChartsWatcher to ping you the second the price interacts with one of your key Fibonacci zones.
Getting it set up is simple:
- Draw your levels on a clear swing high and swing low, just like you normally would.
- Right-click directly on the Fib line you want to watch, like the 50% or 61.8% level.
- Define the condition, such as "Price Crossing" or "Price Touching" that specific level. You can fine-tune it to trigger once per bar or on every single tick.
- Set your notification (a pop-up, sound, or email) and hit activate.
Now, ChartsWatcher is your personal trading assistant. It will let you know the moment your condition is met, freeing you up to research other stocks or manage existing trades. You can relax, knowing you won't miss an entry signal on a setup you've already vetted.
The real power here isn't just convenience; it's discipline. Setting an alert forces you to wait for the market to come to your price, which is a massive help in avoiding those impulsive, badly timed trades.
Creating Custom Scans for Fibonacci Setups
Why would you hunt for setups one chart at a time when a scanner can search the entire market for you in seconds? With ChartsWatcher, you can build a custom scan to find stocks that are in the middle of a pullback to a key Fibonacci zone. It’s a game-changer for building a daily watchlist.
Let's say you want to find every stock in the S&P 500 that's in an uptrend but is currently pulling back toward the "golden pocket"—the area between the 61.8% and 78.6% levels.
Your scan criteria in ChartsWatcher could look like this:
- Universe: S&P 500 Stocks
- Condition 1: Price is in a daily uptrend (e.g., Price > 50 SMA).
- Condition 2: The current price is within 2% of its 61.8% Fibonacci retracement level, calculated over the last 20 trading days.
The platform's dashboard lets you pull together complex filters like these and see the results update live as the market moves.
This screenshot gives you an idea of the kind of dynamic workspace you can create. A custom Fibonacci scan would feed directly into one of these windows, giving you a constantly refreshed list of potential trades that fit your exact strategy.
Building and Saving Personalized Templates
Every trader develops their own preferences. Maybe you like to add the 78.6% level, change the colors to match your chart theme, or get rid of the levels you never use. Having to reconfigure the Fibonacci tool every single time you apply it is a waste of time.
That's why saving a template in ChartsWatcher is so useful.
- Customize Your Tool: Apply the Fibonacci tool to a chart and open up its settings. Tweak everything—the levels, colors, line styles, and labels—until it's perfect.
- Save as a Template: Look for the "Save Template" option in the settings window and give it a memorable name, like "My Default Fibs."
- Apply with One Click: Next time you draw a retracement, just select your saved template. All your custom settings will be applied instantly.
It’s a simple feature, but it saves a surprising amount of clicking and ensures total consistency across your analysis. When every chart uses the same visual language, you can interpret price action faster and trade with more confidence. By layering alerts, scans, and templates, you transform a manual drawing tool into a systematic, scalable trading strategy.
Answering Your Top Fibonacci Questions
Once you start pulling up live charts and trying to apply Fibonacci retracements, the real questions begin. Moving from a textbook example to the chaotic reality of a moving market always brings up a few head-scratchers. Let's tackle the most common ones I hear from traders, so you can draw your levels with more confidence.
Knowing the theory is one thing, but applying it when the price is whipping around is a completely different skill. Let's clear up the confusion.
What Is the Best Timeframe to Use?
This one comes up all the time: "Do Fibs work better on the 5-minute or the daily chart?"
The honest answer? They work on all of them. Fibonacci is a fractal concept, meaning the same patterns and ratios appear on a one-minute chart for a scalper as they do on a weekly chart for a long-term investor. The "best" timeframe is simply the one that matches your trading style.
That said, there's a practical rule of thumb to follow.
- Higher Timeframes (4-Hour, Daily, Weekly): Levels drawn on these charts are far more significant. Why? Because they're based on major, sustained market moves. Big institutions and a massive pool of traders are all watching these same levels, which gives them more weight and reliability.
- Lower Timeframes (1-Minute, 5-Minute, 15-Minute): Fibs are still useful here, but the levels are much more susceptible to market "noise." They can get blown through pretty easily. It's best to use these for pinpointing entries within the context of a bigger trend identified on a higher timeframe.
A solid strategy is to anchor your analysis on a daily chart to find the major support/resistance zones, then zoom into a 1-hour chart to fine-tune your entry as price approaches those key levels.
What Is the Difference Between Retracements and Extensions?
Getting this right is absolutely critical. They both use Fibonacci ratios, but they serve opposite purposes. Mixing them up is a surefire way to mess up your trade plan.
Fibonacci Retracements: These measure how deep a pullback is likely to go within a larger trend. They help you find potential buy-the-dip spots in an uptrend or short-selling opportunities in a downtrend. You're looking for where the correction might end so the original trend can resume.
Fibonacci Extensions: These project where the price might go after the pullback is over. Think of them as profit targets. Once the trend continues, extensions give you logical price levels beyond the previous high or low where you might consider taking profits.
To see how they work together as a complete system, check out our deep-dive guide to mastering both Fibonacci retracement and extension levels.
In short: Retracements help you get in, and extensions help you get out.
Should I Use the Wick or the Body of the Candle?
When you're choosing your swing high and swing low, do you click on the flat part of the candle (the body) or the pointy tip (the wick)?
The standard, most consistent approach is to always use the absolute highest and lowest points of the entire move, which means you must include the wicks.
The wicks represent the full range of prices where buyers and sellers battled it out during that period. If you ignore them, you're missing part of the story and not capturing the true extremes of supply and demand. For your levels to be as accurate as possible, anchor your tool from the very tip of the highest wick down to the very bottom of the lowest wick. This ensures your analysis is based on the complete price action.
Ready to stop missing trades and start automating your analysis? ChartsWatcher provides the advanced scanning and real-time alerting tools you need to find high-probability Fibonacci setups across the entire market. Build your first custom Fibonacci scan today at chartswatcher.com
