How to Draw Fib Retracements A Professional Trader's Guide
Before you even think about drawing Fibonacci lines on a chart, you need to get your head around why they even work. This isn't just some random tool that spits out arbitrary lines. It’s a visual map of market psychology, with roots in a mathematical sequence that pops up everywhere—from nature to the financial markets themselves.
Why Fibonacci Retracements Actually Work
At its heart, the magic of the Fibonacci tool isn't magic at all. It's a classic self-fulfilling prophecy, all driven by the collective psychology of traders.
Think about it: when thousands of traders, analysts, and institutional algorithms are all staring at the exact same key percentage levels, their actions become predictable. Buy and sell orders naturally cluster around these zones, and just like that, they morph into powerful areas of support and resistance.
The whole idea comes from Leonardo of Pisa, a 13th-century mathematician who laid out the famous Fibonacci sequence. You’ve probably seen it before: each number is just the sum of the two that came before it (0, 1, 1, 2, 3, 5, 8, 13…). From this simple pattern, we get the key ratios that are the bedrock of the entire retracement tool.
The most famous of these is the 61.8% level, often called the "golden ratio." This isn't just a trading gimmick; this ratio appears in natural patterns all over the place, from the spiral of a galaxy to the shell of a nautilus. For traders, it represents a deep pullback that can often signal a last-chance entry before a trend roars back to life.
The Key Levels and What They Tell You
The Fibonacci retracement tool is built around a handful of key percentages that traders watch like hawks to spot potential support and resistance.
Here's a quick breakdown of the core Fibonacci levels and what they generally signal about what the market is thinking.
| Fibonacci Level | Percentage | Market Interpretation |
|---|---|---|
| 23.6% | 23.6% | A very shallow pullback. Often seen in a brutally strong, fast-moving trend. |
| 38.2% | 38.2% | The first significant support/resistance zone. A common bounce area in a healthy trend. |
| 50% | 50% | Not a true Fib ratio, but a key psychological halfway point. Represents an equilibrium price. |
| 61.8% | 61.8% | The "golden ratio." A deep pullback and a critical test of the trend's strength. |
| 78.6% | 78.6% | A "last chance" deep retracement level before a potential trend reversal. |
Each of these levels tells a slightly different story about the ongoing tug-of-war between buyers and sellers. We dive much deeper into the mechanics in our guide on what Fibonacci retracements are and how they're explained.
So, how do you read these in real-time?
- A bounce off the 23.6% level signals an incredibly strong trend. The market barely took a breather before continuing on its way.
- A pullback to the 38.2% level is more standard. It's a healthy correction, suggesting the trend has solid momentum.
- A dip all the way to the 61.8% level is a major test. If the price turns around here, it’s a powerful confirmation that the original trend is still very much in play. Empirical data shows that roughly 65% of trends that hit this level either reverse or lose significant steam.
Trader's Insight: Don't treat Fibonacci levels as razor-thin lines. Think of them as "zones of probability." Price action doesn't have to pivot on the exact tick. You're looking for signs of a reaction in that area—slowing momentum, consolidation, or classic reversal candlestick patterns.
From Ancient Math to Modern Market Psychology
So, why does a mathematical concept from centuries ago have any relevance in today's high-speed markets? It all comes down to human nature.
Markets are fueled by two raw emotions: fear and greed. These feelings create the big waves of buying (uptrends) and selling (downtrends). The smaller pullbacks, or retracements, within those waves are where traders either cash in their profits or look for a new spot to jump in.
Fibonacci levels give traders a logical roadmap for making these decisions. When a stock in a monster uptrend pulls back to the 38.2% level, buyers who missed the first run-up see a potential bargain and start buying, creating support. If it drops further to the 61.8% level, the "deep value" crowd steps in, reinforcing that zone even more.
This is the collective action that gives these levels their predictive muscle. When you plot them on a platform like ChartsWatcher, you're literally watching these psychological battles play out chart by chart.
Drawing Retracements Accurately in Any Market
Alright, let's get down to the practical side of things: taking the Fibonacci concept from theory and putting it to work on your live charts. Knowing how to draw these levels correctly is what separates a clean, professional analysis from a messy chart full of meaningless lines. The entire process hinges on one critical skill—nailing the right swing points.
Your success with this tool depends entirely on anchoring it to significant price moves. If you attach it to minor, insignificant market "noise," the levels it generates will be completely useless. The goal here is to capture a primary trend's impulse move so you can measure the depth of its inevitable pullback.
Identifying Swing Points in an Uptrend
In a market that’s clearly marching higher, making a series of higher highs and higher lows, your job is to find the beginning and end of the most recent, significant upward thrust.
To draw the levels for an uptrend, you connect the swing low to the swing high.
- Find the Swing Low: This is the definitive bottom of the price move, the point where the uptrend truly began. It should be a clear trough right before a sustained rise.
- Find the Swing High: This is the peak of that same move, the highest point reached before the price started to pull back or go sideways.
Once you’ve locked in these two points, you’ll click your Fibonacci tool on the swing low (this is your 100% or 1 level) and drag the cursor up to the swing high (your 0% or 0 level). Your charting platform, like ChartsWatcher, will automatically plot the retracement levels in between.
This whole process has its roots in a natural mathematical sequence that translates directly into key ratio zones on a chart.
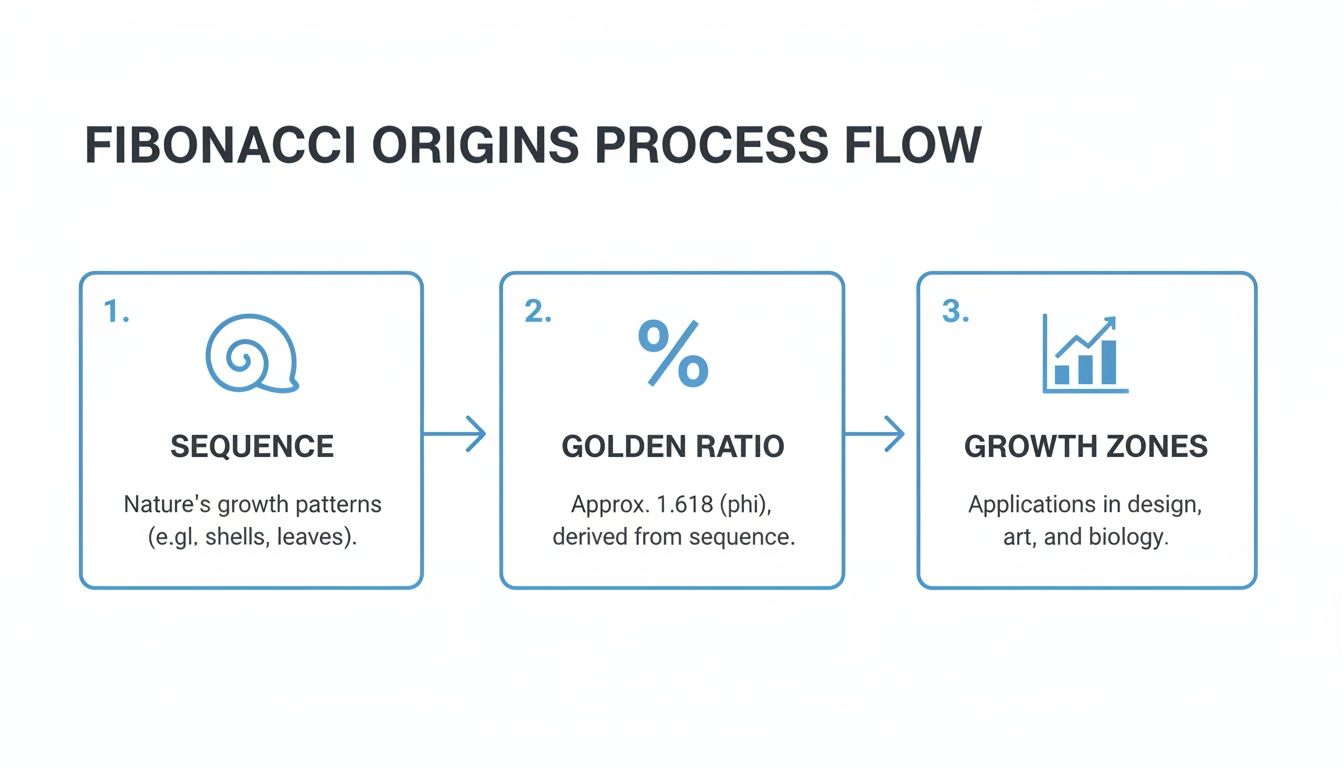
The graphic above shows the journey from that raw sequence to the golden ratio, which ultimately defines the high-probability zones traders watch for support and resistance.
Drawing Levels in a Downtrend
For a downtrend, you just flip the logic. In a market making lower lows and lower highs, you're measuring the potential bounce (or retracement) within a bearish move.
For a downtrend, you connect the swing high to the swing low.
- Find the Swing High: This is the obvious peak where a major sell-off kicked off.
- Find the Swing Low: This is the bottom of that bearish impulse, the lowest point the price hit before it started to bounce back up.
You'll click the Fibonacci tool on that swing high (the 100% or 1 level) and drag it down to the swing low (the 0% or 0 level). The levels that appear will now act as potential resistance zones where the bullish bounce might run out of steam, allowing the primary downtrend to resume.
Pro Tip: Always draw your Fibonacci levels from left to right. For an uptrend, this means drawing from the bottom-left to the top-right. For a downtrend, you'll go from the top-left to the bottom-right. This simple habit keeps things straight and prevents a lot of confusion.
Distinguishing Major Swings from Market Noise
This is where a lot of new traders get tripped up. They see a small wiggle on a 5-minute chart and immediately slap a Fibonacci retracement on it. The key is to anchor your tool to swings that are structurally significant for the timeframe you’re trading.
Ask yourself these questions:
- Does this swing point represent a clear change in market direction?
- Was the impulse move strong and decisive, or was it choppy and weak?
- Would other traders looking at this chart also view this as a significant high or low?
A powerful technique on platforms like ChartsWatcher is to simply zoom out. Before you draw levels on an hourly chart, take a look at the daily to identify the major trend and its primary swing points. This higher-level context helps confirm that the move you're analyzing is the real deal and not just random volatility.
The entire workflow, from identification to execution, is a systematic process. You start by finding that significant price swing. Then, you apply the tool—low to high in uptrends, high to low in downtrends. The next stage is crucial: monitoring how price reacts to each level. The 23.6% is often the first test, but the deeper levels hold more weight. This analysis then informs where you might set a stop-loss (just below a key Fib level) or a take-profit target (at a previous high or a Fibonacci extension). You can discover more insights about these implementation steps on Axiory.com.
Turning Fibonacci Levels Into a Trading Strategy
Alright, you've got clean Fibonacci levels drawn on your chart. Now the real work begins. It’s time to shift from just analyzing the chart to actually trading it by building a structured plan around these zones. Seeing the lines is one thing; knowing how to act on them with confidence and a clear plan is what separates the pros from the amateurs.

This isn't just about slamming the buy button the second price touches a line. It’s about reading the market's reaction at each level, confirming your ideas with other signals, and managing your risk like a hawk.
Interpreting Reactions at Key Retracement Zones
Let's be clear: not all Fib levels are created equal. While you might see a small reaction anywhere, experienced traders really zero in on the zone between the 38.2% and 61.8% retracements. This area is often the sweet spot for a trend-continuation trade—a pullback deep enough to offer a great entry price but not so deep that it kills the original trend.
-
The 38.2% Level: Think of this as the first line of defense for a really healthy trend. A bounce here screams strength. It tells you buyers are aggressive and chomping at the bit to get in.
-
The 50% Level: Even though it’s not an official Fibonacci ratio, the halfway point is a massive psychological barrier. A reaction here represents a perfect equilibrium between the big impulse move and the correction that followed.
-
The 61.8% "Golden Ratio" Level: This is arguably the most watched level of them all. A deep pullback to this zone is a make-or-break test for the trend. A sharp, decisive reversal off the 61.8% level is a high-conviction signal for many traders that the original trend is back in business.
The 61.8% Fibonacci level has the highest statistical reliability. Some research suggests this golden ratio produces reversals around 40% of the time in trending markets. When price pulls back here during a strong trend, it’s often the last best chance to get in before the next big move. If the price slices through it and heads for 78.6%, that’s a major red flag that the trend might be running out of gas.
Building a Complete Trade Plan
Fibonacci levels give you the "where," but a real trading plan needs more. You need clear rules for your entry, your stop-loss, and your exit. Once you've identified your key Fib levels, the next step is building them into a full strategy, which absolutely must include planning your exit strategy.
Here’s a simple framework for structuring a trade around these zones:
1. Define Your Entry Trigger: Never, ever enter a trade just because the price touched a Fib level. That’s a rookie mistake. Instead, you need to wait for price action to confirm your idea. Look for specific bullish or bearish candlestick patterns that show you momentum is shifting right at your chosen level. A hammer, a bullish engulfing pattern, or a doji right on the 61.8% support is a much, much stronger signal than the level by itself.
2. Set a Logical Stop-Loss: Your stop-loss is non-negotiable. Fibonacci levels make this easy and logical. A common practice is to place your stop just beyond the next key Fib level. For example, if you go long at the 50% retracement, you could place your stop just below the 61.8% level. This gives your trade some breathing room while clearly defining your risk.
3. Identify Profit Targets with Extensions: Just as retracements show you where a pullback might stop, Fibonacci extensions help project where the price might go next. After you enter, use the extension tool to map out potential profit targets. Common extension levels like 127.2% and 161.8% are popular spots where traders will look to take some or all of their profits off the table.
The Importance of Confirmation Signals
Relying on Fibonacci levels alone is a dangerous game. The best traders use them as one piece of a bigger puzzle, looking for "confluence" where multiple signals all point to the same outcome.
Key Takeaway: Fibonacci levels identify high-probability areas for a trade. Confirmation signals—like candlestick patterns, volume spikes, or indicator readings—provide the timing and validation to actually pull the trigger.
Imagine a stock in an uptrend pulls back to its 61.8% retracement. That's interesting. Now, imagine that same 61.8% level lines up perfectly with the 200-day moving average, and just as it hits, trading volume surges and a perfect bullish hammer candle forms. That’s not just interesting anymore—that’s an A+ setup. The more confirming factors you have, the higher your odds. Our detailed guide explores several powerful Fibonacci trading strategies for 2025 that are built on this exact principle of confluence.
Combining Fibonacci With Other Indicators for Confirmation
Drawing clean Fibonacci levels is a huge step forward, but let's be honest: trading them in isolation is a classic recipe for getting chopped up. A single line on a chart, no matter how perfectly placed, is just a suggestion from the market.
To turn that suggestion into a high-probability trade, you need to hunt for confluence. This is where a key Fib level lines up perfectly with another, totally independent technical signal. It's the secret to filtering out weak setups and focusing only on the A+ opportunities.
When multiple, unrelated indicators all point to the same price zone, your odds of a successful trade skyrocket. Think of it like getting a second, third, and even fourth opinion that all agree on the same diagnosis. You're no longer just hoping a level holds; you're trading a zone the market has confirmed as significant for several different reasons.
Aligning Fib Levels With Key Moving Averages
One of the most powerful and straightforward ways to find confluence is by pairing Fibonacci retracements with major moving averages (MAs). MAs are dynamic lines of support and resistance that reflect the average price over a set period, and you can bet that big institutional traders are watching them like a hawk.
When a Fib level intersects with a widely-followed MA, that price zone becomes supercharged with significance.
- The 50-Day Moving Average: This is often seen as a medium-term trend bible. A bounce from the 50-day MA that also happens to align with the 38.2% or 50% Fib level is a textbook trend-continuation signal.
- The 200-Day Moving Average: The big one. This is the long-term trend benchmark. A pullback to the 200-day MA that coincides with the deep 61.8% "golden ratio" retracement can be an incredibly strong buying opportunity in a healthy bull market.
Picture this: a stock in a strong uptrend finally pulls back. You draw your Fibs and notice the 61.8% retracement lands squarely at $150. At the same time, you see the 200-day MA is also creeping up to that exact $150 level. That isn't just a Fib level anymore; it's a fortress of potential support.
Stacking Confluence With Support, Resistance, and Volume
Moving averages are just the beginning. You can stack your Fibonacci analysis with other structural elements right on the chart. Old-school static support and resistance lines—those horizontal price levels where the market has pivoted hard in the past—are perfect candidates. When a Fib level lands on one of these proven battlegrounds, its power is amplified.
For a more advanced take, look at the Volume Profile. This tool shows you exactly where the most trading volume has occurred over a period. A high-volume node (HVN) acts like a price magnet. If your 50% retracement level lines up with a major HVN, you've found a zone where the market has a strong "price memory," making a reaction there highly likely.
Trader's Insight: No single indicator is a crystal ball. The goal of confluence isn't to find a "perfect," risk-free trade, but to build a compelling case. The more evidence you can stack in your favor at a specific price, the more confidence you can have when it's time to pull the trigger.
Using Oscillators to Time Your Entry
Confluence isn't just about finding where to trade; it's also about finding when to trade. This is where oscillators like the Relative Strength Index (RSI) or the Moving Average Convergence Divergence (MACD) become your best friends. These tools are all about measuring momentum.
Let's say the price is dropping into a strong confluence zone you've identified—maybe that 61.8% Fib level that's also sitting on the 200-day MA. As it approaches, you glance at your RSI for confirmation.
If the price is making a new low into that support zone, but the RSI is showing a bullish divergence (making a higher low), that's a massive clue. It tells you that the downside momentum is drying up right at your key level, giving you the final piece of the puzzle to time your entry.
For traders using a platform like ChartsWatcher, you can put this entire process on autopilot. Instead of staring at charts all day waiting for the stars to align, you can set up alerts to notify you when price enters a pre-identified confluence zone. For example, create an alert for when a stock's price is within 1% of both its 50-day MA and your target 50% Fib level. This lets the A+ setups come directly to you, saving a ton of time and mental energy.
Common Mistakes to Avoid When Using Fibonacci Retracements

Learning to draw Fibonacci retracements correctly is a huge first step, but what truly separates a novice from an experienced trader is knowing which mistakes to avoid. Many traders learn the mechanics but fall into the same traps over and over, leading to frustrating losses and a total lack of confidence in a genuinely powerful tool.
These aren't super-complex errors; they're usually fundamental misunderstandings of context and when to actually use the tool. Once you recognize these common pitfalls, you can clean up your charts, sharpen your focus, and start using Fibonacci levels with the precision they demand.
Anchoring on Insignificant Market Noise
The single most destructive mistake is anchoring the tool to the wrong swing points. I see this all the time: traders get lost in the short-term wiggles, attaching their Fib levels to minor, meaningless fluctuations on a low-timeframe chart.
When you do this, the resulting levels are essentially random and hold zero predictive power. The whole point of the tool is to measure a pullback relative to a significant, impulsive market move. If the move you're measuring is just noise, the retracement levels it generates will be noise, too.
Always start by identifying a clear, impulsive price leg—a strong, directional move that marks a real shift in the market. Before you even think about drawing on a 15-minute chart, zoom out to the 4-hour or daily view to find the primary trend and its most important swing points. This context is everything.
Forcing Retracements on a Choppy Market
Let's be clear: Fibonacci retracements are a trend-following tool. Period. They are built to identify potential entry points within an established uptrend or downtrend. One of the quickest ways to bleed your account is to force them onto a chart that’s just bouncing around sideways.
In a ranging or choppy market, there is no primary trend to retrace from. Trying to draw levels in this environment creates a confusing mess of lines that will get you whipsawed by unpredictable price action.
Trader's Rule: If you can't easily spot a series of higher highs and higher lows (for an uptrend) or lower lows and lower highs (for a downtrend), put the Fibonacci tool away. It’s simply the wrong instrument for the job.
Treating Fib Levels as Exact Lines
This one is critical. Many traders view Fibonacci levels as perfect, razor-thin lines of support or resistance. They'll place a limit order at the exact 61.8% level and then get frustrated when the price turns just a few ticks before or after it.
The market is an auction driven by human emotion and order flow, not a perfect mathematical formula. You have to think of these levels not as precise points but as zones of probability. Price action often reacts in the area surrounding a level, not at the exact price itself.
A more professional approach is to wait for confirmation within these zones. Let the price enter a key Fib area, then look for a compelling candlestick reversal pattern, a spike in volume, or a momentum shift on an oscillator before you even consider putting on a trade. Patience pays.
To help you sidestep these common issues, I've put together a quick reference table. Think of it as a cheat sheet for keeping your Fibonacci analysis clean and effective.
Common Fibonacci Mistakes and Their Solutions
| Common Mistake | Why It's a Problem | How to Fix It |
|---|---|---|
| Drawing in the Wrong Direction | Generates completely invalid levels and leads to trading against the primary trend. | Always draw left to right. In an uptrend, anchor from the swing low to the high. In a downtrend, anchor from the high to the low. |
| Ignoring Higher Timeframes | Anchoring to minor swings leads to unreliable levels that get ignored by the market. | Always start your analysis on a higher timeframe (e.g., Daily) to identify the major trend and swing points before drilling down. |
| Using Fibs in Isolation | Without confirmation, Fibonacci levels are just lines on a chart with a 50/50 chance of holding. | Look for confluence where a Fib level aligns with other signals like a moving average, a past support/resistance level, or an oscillator divergence. |
By internalizing these fixes, you'll not only draw your levels more accurately but also develop the contextual awareness needed to trade them successfully.
Of course. Here is the rewritten section, formatted to match the provided examples with a human, expert tone.
Common Questions on Fibonacci Retracements
Even when you feel like you've got the hang of drawing Fibonacci levels, a few practical questions always pop up in the real world. Let's dig into some of the most common ones I hear from traders. Getting these details right can be the difference between a decent setup and a great one.
What Is the Best Timeframe to Use?
You can drop a Fib tool on any chart, but its reliability really shines on higher timeframes. Think 4-hour, daily, and weekly charts. These longer-term views filter out a massive amount of market "noise," giving you swing points that represent significant, macro trends.
When a swing high or low is formed on a daily chart, it means a much larger pool of market participants is watching. The resulting support and resistance zones carry more weight because more money and attention are focused on them.
On the flip side, trying to use Fibs on a 5-minute or 15-minute chart can be frustrating. The price action is far more volatile, and the swing points you pick might be more random than meaningful, which leads to less reliable levels.
Pro Tip: One of the best ways for day traders to approach this is with multi-timeframe analysis. Start by drawing your primary Fibonacci retracement on a 1-hour or 4-hour chart. This identifies the major, high-probability zones. Then, you can drill down to a shorter timeframe to hunt for precise entry signals as the price tests those key macro levels.
Can Fibonacci Levels Predict the Exact Reversal Point?
Absolutely not, and it’s critical to understand this. Fibonacci levels don't pinpoint exact reversal prices. Think of them as zones of high probability—areas where the market is likely to slow down, find support or resistance, and potentially turn around.
A classic rookie mistake is blindly placing a market order the second the price tags a specific Fib level. That’s not how the pros play it. Instead, they wait for confirmation. They look for clues in the live price action that a reversal is actually starting to take shape.
What does confirmation look like?
- Bullish or Bearish Candlestick Patterns: A crisp hammer, doji, or engulfing candle right at a key level is a powerful tell.
- Oscillator Divergence: Seeing bullish divergence on the RSI as price hits a support zone suggests that downside momentum is fading.
- Volume Spikes: A big jump in trading volume shows a fight is happening between buyers and sellers, and real conviction is entering the market.
The levels give you the map, but it's the price action that gives you the green light.
How Can I Integrate Fibonacci Signals Into My ChartsWatcher Scans?
This is where you can get really efficient with a platform like ChartsWatcher. While you can't build a scan that automatically finds a manually drawn "61.8% retracement," you can use the alert system to create a killer workflow around your analysis.
The process is simple. First, do your homework. Manually draw your Fibonacci levels on the key stocks from your watchlists. Once you've marked the most important price zones—maybe a confluence area where the 50% retracement lines up with the 200-day moving average—you can turn that insight into an actionable trigger.
From there, create specific price-level alerts in ChartsWatcher. You'll get an instant notification the moment a stock approaches one of your hand-picked Fibonacci zones. You could even organize these pre-vetted charts into a dedicated watchlist called "Fib Setups" to keep them front and center in your dashboard. This way, you stop chasing the market and let the highest-probability opportunities come directly to you.
Ready to stop guessing and start building a data-driven trading strategy? ChartsWatcher provides the powerful scanning, alerting, and charting tools you need to find high-probability setups based on Fibonacci confluence and more. Explore the platform and take control of your market analysis by visiting https://chartswatcher.com.
