How to draw a fibonacci retracement: A practical guide
To draw a Fibonacci retracement, you simply identify a recent, clear price trend and anchor the tool from its start to its end. For an uptrend, you connect the lowest point (Swing Low) to the highest point (Swing High), and for a downtrend, you do the opposite. Your charting software then automatically plots the key retracement levels where a price reversal might occur.
The Core Mechanics of Drawing Fibonacci Levels
At its heart, using the Fibonacci retracement tool is all about identifying the boundaries of a single, significant price move. This isn't about complex calculations; it's about pinpointing the start and finish of a market impulse. Once you establish these two points, the tool does the heavy lifting, projecting horizontal lines that function as potential support or resistance.
Think of it like this: a stock rallies from $100 to $150. This $50 move is your defined trend. By drawing the Fibonacci tool from the $100 low to the $150 high, you're essentially asking, "If this price pulls back, where are the most probable turning points?"
Identifying the Key Anchor Points
The entire accuracy of your analysis hinges on selecting the correct anchor points. It's the most critical part of the process.
- For an Uptrend: Locate the absolute bottom of the recent price surge (the Swing Low) and click. Then, drag your cursor and click again on the absolute peak of that same surge (the Swing High).
- For a Downtrend: The process is simply reversed. You start by clicking the peak of the recent price drop (the Swing High) and then drag down to click the bottom of that move (the Swing Low).
Getting these anchors right is everything. A misplaced anchor point renders the entire set of levels useless.
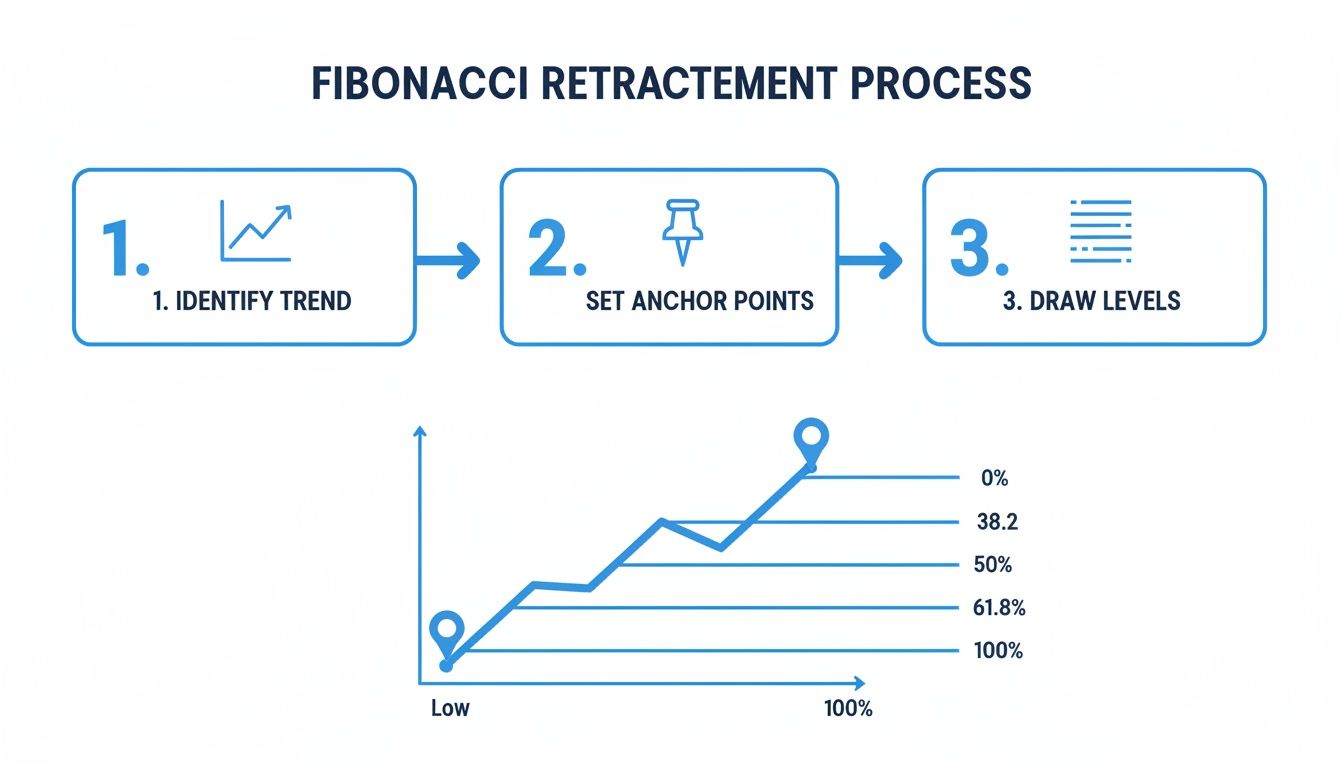
As the diagram shows, the process boils down to finding the trend, anchoring the tool to its extremes, and then analyzing the levels that appear.
Automatic Level Plotting
Once you've anchored the tool, the magic happens automatically. Your charting platform instantly projects the horizontal levels between those two prices you selected. The most widely watched levels are 23.6%, 38.2%, 50%, and 61.8% of the prior move.
Platforms like ChartsWatcher automate this instantly, plotting every ratio with high precision the moment your two anchor points are set. You can find more details on how different advanced platforms handle these tools at atfx.com.
The most common Fibonacci levels act as a roadmap for potential price reactions. Here’s a quick breakdown of what each one often signals to traders.
Understanding Key Fibonacci Retracement Levels
| Fibonacci Level | What It Suggests | Common Trader Action |
|---|---|---|
| 23.6% | A shallow pullback, often indicating a very strong trend. | Monitor for a quick bounce; may not offer a deep enough entry. |
| 38.2% | A moderate and common retracement level. | Look for signs of reversal here as a first potential entry point. |
| 50% | Not a true Fibonacci number, but a key psychological level. | Often acts as strong support/resistance; a significant turning point. |
| 61.8% | The "golden ratio," considered a very strong potential reversal zone. | A high-probability area for entries, often with tight stop-losses. |
These levels provide a framework, but they are zones, not exact lines. Price can pierce a level slightly before reversing, so it's best to look for confirmation rather than trading blindly.
The goal isn't to guess which level will hold. It’s to map out the battlefield and watch how the price reacts at these mathematically significant zones before making a decision.
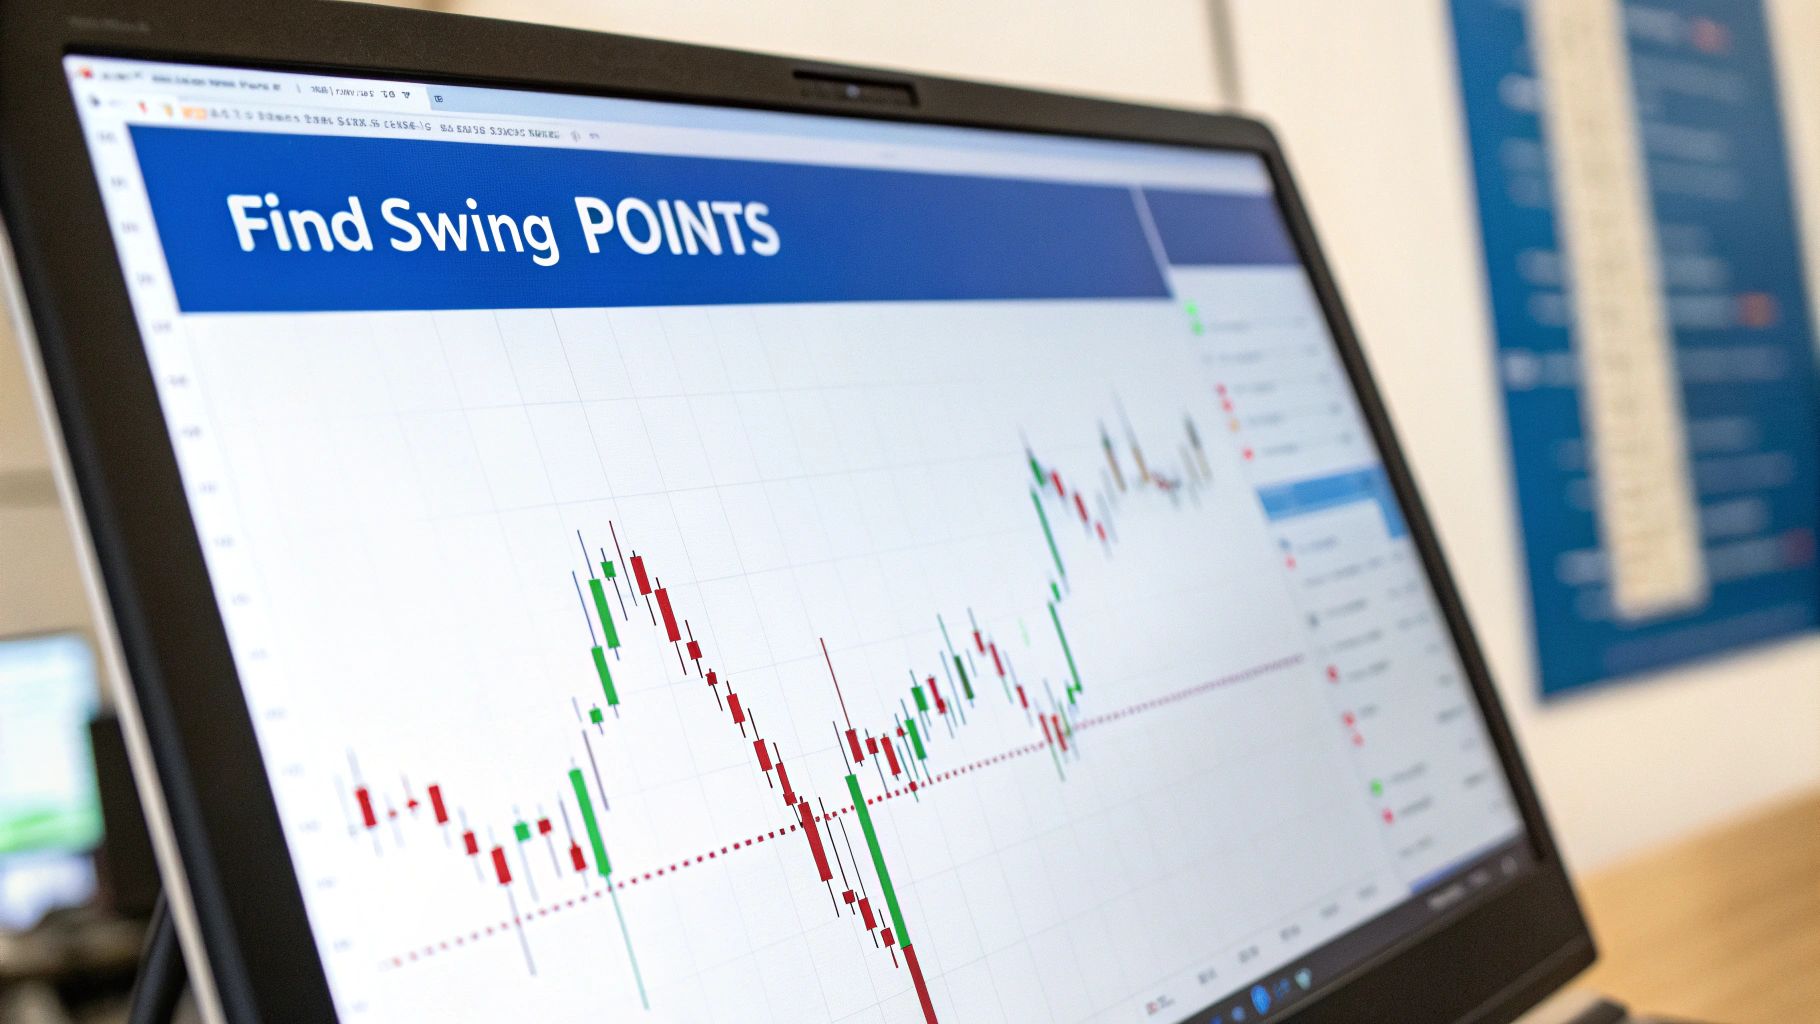
Finding Reliable Swing Highs and Lows
Here’s a hard truth: your Fibonacci levels are only as good as the anchor points you choose. If you draw your lines between insignificant price blips, you'll end up with meaningless levels and a string of frustrating trades.
The whole game is about identifying truly significant swing highs and lows. These are the points that define the real beginning and end of a trend, not just the random noise that fills up the chart.
A reliable swing point isn't just any old peak or valley. It has to represent a clear, decisive shift in market momentum. Think of it as the most extreme price hit right before a definitive reversal or a deep pullback kicked off. Anything less is just a little consolidation wobble inside a much larger move.
What Makes a Swing Point Valid?
So how do you separate a major swing from a minor one? Most traders use a simple technical rule to filter out the noise. A swing high is a candle that has a higher high than a specific number of candles before and after it—usually three to five. The same logic applies to a swing low, but in reverse.
This simple definition forces you to zero in on price points that actually stand out from the crowd.
- Swing High Criteria: The peak of a candle must be higher than the highs of the candles immediately surrounding it. A common setup is to look for a high that is the highest point in a five-candle cluster.
- Swing Low Criteria: The bottom of a candle must be lower than the lows of the candles on either side.
Following this methodical approach is the first step in learning how to draw Fibonacci retracements with confidence. It keeps you from anchoring your tool to flimsy price action and grounds your entire analysis in solid market structure.
Look for Confirmation with Volume
Once you've spotted a potential swing high or low, you need to validate it. One of the best ways to do this is by checking the trading volume.
A major price peak that forms on a huge spike in volume is a powerful signal. It tells you there was strong selling pressure and real conviction from other traders. Likewise, a bottom that forms on a surge in volume can signal capitulation—the moment when sellers finally give up and aggressive buyers rush in.
This volume confirmation adds a crucial layer of confidence. It proves your chosen anchor point wasn't just random, but a place where a significant market event took place.
A swing point backed by high volume is a sign that a real battle between buyers and sellers took place. These are the powerful pivots you want to anchor your Fibonacci levels to.
Let's say a stock has been rallying and finally puts in a new peak. Before you draw anything, glance down at the volume bars. If you see one of the highest volume days of the entire trend occurred right at that peak, you have strong evidence of a valid Swing High.
This potent combination of price and volume is often the signature of institutional activity, and it makes your Fibonacci levels far more reliable. This is how the pros do it.
Translating Fibonacci Levels into Trading Decisions
Drawing the lines is the easy part. The real skill is learning how to read the story the price tells as it interacts with these levels. Each line represents a psychological and mathematical zone where the battle between buyers and sellers is about to get real.
These aren't just random lines on a chart; they are areas where large market orders often cluster. This creates a kind of self-fulfilling prophecy where the levels become significant simply because enough traders believe they are. Your job is to read the price action at these zones to figure out what the market might do next.
Decoding the Key Retracement Zones
Think of the primary Fibonacci levels as checkpoints in a trend's journey. How the price reacts at each one offers clues about the trend's strength and whether it's likely to continue. Getting this right is crucial, and it's a core concept behind many features found in building robust fintech applications.
Each level has its own personality:
- The 38.2% Level (The Shallow Pullback): When a price only pulls back to the 38.2% level before rocketing off again, it's a huge tell. This suggests the trend is incredibly strong, and buyers are practically falling over themselves to get in. It’s a sign of a fast-moving, powerful trend with almost no hesitation.
- The 50% Level (The Halfway Point): While not technically a Fibonacci number, the 50% mark represents the dead center—the equilibrium point of the previous move. A reaction here signifies a perfectly balanced tug-of-war. A decisive bounce or break from this level often dictates the trend's fate.
- The 61.8% Level (The Golden Ratio): This is the one everyone watches. A pullback to the "golden ratio" of 61.8% represents a deep—but still healthy—correction. This zone is a classic spot for trend reversals, offering what many traders consider a prime, high-reward entry point to rejoin the primary trend.
By watching for consolidation, hesitation, or a decisive breakout at these levels, you transform lines on your chart into an actionable narrative about where the market is likely headed.
Turning Lines into an Actionable Narrative
The key is to pay attention to how the price arrives at a level. Does it slice right through the 38.2% line like it's not even there? That signals extreme momentum. Does it grind to a halt and start chopping sideways at the 50% level? That tells you there’s indecision and a big fight ahead.
Let’s say a stock is in a monster uptrend and pulls back to the 61.8% level. Don't just blindly buy. Watch the candlesticks. A big, fat bullish engulfing candle forming right on that line is the confirmation you’re looking for. It suggests buyers have stepped in with overwhelming force.
This is how you translate a simple line into a high-probability trading decision. If you want a deeper dive, our guide on what Fibonacci retracements are can give you even more context.
Combining Fibonacci with Other Indicators
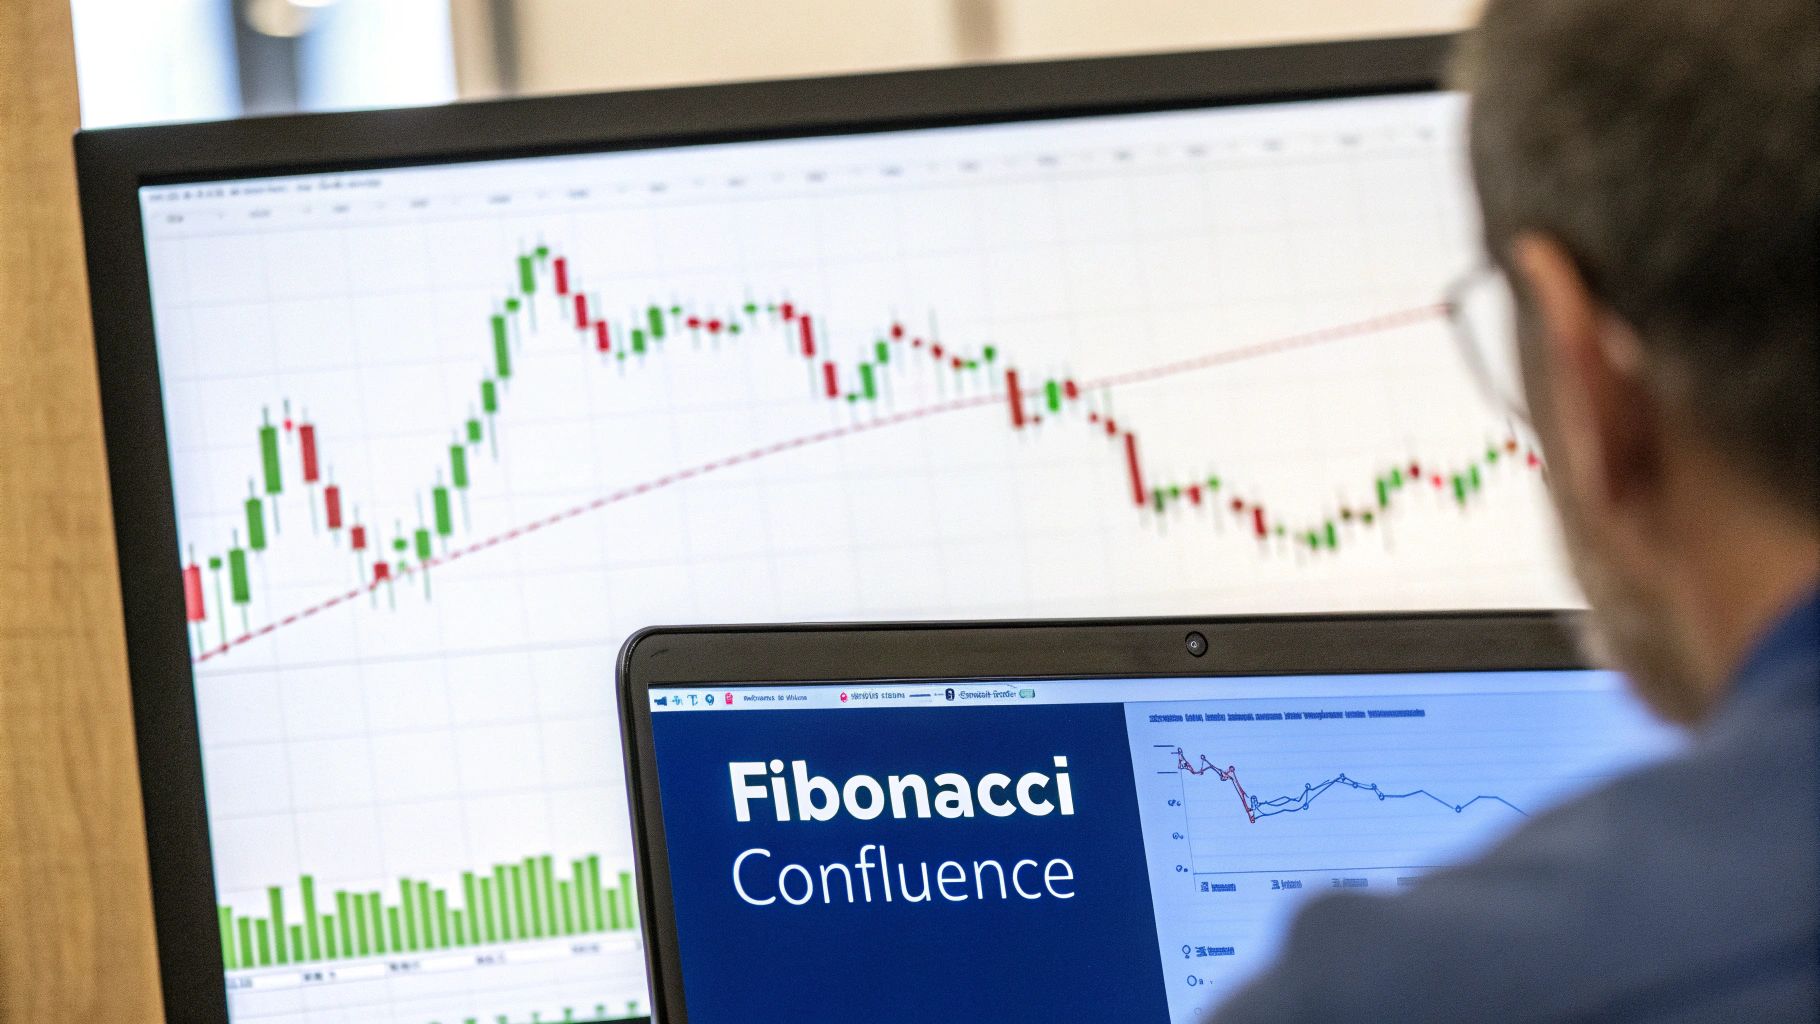
A standalone Fibonacci level is a good starting point—an area of interest—but it's not a complete trading signal on its own. To really elevate your analysis, you need to hunt for confluence. This is the powerful intersection where multiple, independent technical signals all point to the same conclusion.
When you learn how to draw a Fibonacci retracement and then layer it with other tools, you transform a simple probability into a high-conviction setup.
Think of it like building a legal case: a single witness is interesting, but three witnesses all telling the same story is compelling. Confluence is the art of finding those corroborating witnesses on your chart to build a stronger case for a trade.
Building a Case with Confluence
Imagine a stock in a strong uptrend finally pulls back to its 61.8% "golden ratio" retracement level. By itself, that’s a decent reason to pay attention.
But what if that exact price level also aligns perfectly with the 200-day moving average? And what if it's a historically significant support zone, and the RSI is flashing an oversold reading? Now we're talking.
This is confluence in action. The probability of a bounce from that level has just increased dramatically because multiple, unrelated analytical methods are all in agreement.
To find these setups, start layering your favorite tools over your Fibonacci levels and look for the overlaps. Some of the most effective combinations I've seen include:
- Moving Averages: A key Fibonacci level that coincides with a major moving average (like the 50-day or 200-day) creates an incredibly strong support or resistance zone.
- Support and Resistance: Previous price peaks and troughs are powerful psychological levels. When a Fibonacci level lands squarely on an old support line, it reinforces its strength tenfold.
- Relative Strength Index (RSI): A pullback to a Fibonacci support level combined with an RSI reading below 30 (oversold) is a classic bullish reversal signal that traders have relied on for decades.
This approach requires patience. You're no longer just looking for a single signal but waiting for several to align just right.
Checklist for High-Confluence Fibonacci Setups
I use a quick mental checklist to gauge the strength of any potential Fibonacci trade. The idea is to systematically look for layered signals to filter out weak setups and focus only on the highest-probability trades.
| Confirmation Signal | Example | Why It Strengthens the Trade |
|---|---|---|
| Significant Level | The pullback hits the 38.2%, 50%, or 61.8% level. | These are the most-watched levels, meaning more traders are likely to react to them. |
| Structural Alignment | The Fib level lines up with a previous high/low or a major trendline. | This shows the price has been respected at this level before, adding historical weight. |
| Indicator Confirmation | An oscillator like RSI shows oversold/overbought conditions. | This signals that the recent move may be exhausted and due for a reversal. |
| Candlestick Pattern | A bullish engulfing or hammer candle forms right at the confluence zone. | This provides immediate price action confirmation that buyers are stepping in. |
By running through this checklist, you can quickly separate the A+ setups from the maybes. A trade with three points of confluence is inherently stronger than a trade with only one.
Key Takeaway: The goal is to stack the odds in your favor. A trade with three points of confluence is inherently stronger than a trade with only one.
This is where a powerful platform like ChartsWatcher really shines. You can create custom scans that automatically hunt for assets meeting your specific confluence criteria—like a 61.8% retracement landing on a 200-day moving average with an oversold RSI. It does the heavy lifting for you.
To see which other indicators pair best, check out our detailed guide to day trading technical indicators.
Using ChartsWatcher for Advanced Fibonacci Analysis
Drawing Fibonacci levels by hand works, but it's slow. If you want to trade like a pro, you have to move past manual chart markup and start thinking about automation. This is where a platform like ChartsWatcher becomes your workhorse, letting you build a repeatable system around your Fibonacci strategy.
Think about it: instead of dragging lines and setting your preferred colors every time, you can create custom templates. It's a simple step, but it saves an incredible amount of time and keeps your analysis consistent from chart to chart. With one click, your go-to Fibonacci setup—maybe with the "golden pocket" between the 61.8% and 78.6% levels highlighted—is ready to go.
Create Real-Time Fibonacci Alerts
Here’s where you really start to gain an edge. Turn your analysis into live, actionable alerts. Let's say you've spotted a strong uptrend and you're just waiting for the price to pull back to the 50% retracement level. Instead of getting glued to your screen for hours, you just create an alert in ChartsWatcher. The platform will ping you the second the price hits your level.
This single feature frees you up from the screen and makes sure you never miss a high-probability entry again. You can set these alerts across dozens of different stocks or crypto pairs, essentially building your own personal market monitor based on your exact Fibonacci strategy.
- Price Level Alerts: Get a notification the moment a stock, crypto, or forex pair touches a key Fib level.
- Multi-Condition Alerts: Don't just rely on price. Combine a Fibonacci level with another trigger, like an oversold RSI, to get a much stronger signal.
- Cross-Asset Monitoring: Apply your alerts to an entire watchlist to find the best opportunities across the market.
Automating your monitoring with alerts shifts your entire trading mindset. You stop being reactive, hunting for setups, and become proactive. The best opportunities are brought straight to you.
Backtest Your Fibonacci Strategy
How can you be sure your Fibonacci strategy actually works over time? You backtest it. This isn't just a "nice-to-have"; it's essential. The backtesting engine in ChartsWatcher lets you apply your Fibonacci rules to historical price data to see exactly how they would have performed.
You can tweak different parameters to find what really works. Which retracement levels produce the best results? Does your strategy kill it on the 4-hour chart for tech stocks but fail miserably on the 15-minute chart for currencies? This is how you find out.
This data-driven approach removes the guesswork and emotion from your trading, replacing it with cold, hard performance data.
Build a Custom Fibonacci Scanner
The final piece of the puzzle is building your own custom "Fibonacci Scanner." This is a screen you set up in ChartsWatcher to do one thing: hunt for your ideal setups across the entire market in real-time. Instead of clicking through charts one by one, your scanner does the heavy lifting for you.
For instance, you could build a scanner that finds:
- Stocks that are in a confirmed uptrend on the daily chart.
- Which are currently pulling back into the zone between the 50% and 61.8% Fibonacci retracement levels.
- And are showing increasing buy volume.
This transforms your trading from a manual, chart-by-chart grind into an automated opportunity engine. The scanner finds the setups, and you just have to analyze the curated list it gives you. This is how you gain a real, sustainable edge in the markets.
Answering Your Top Questions on Drawing Fibs
Once you start using Fibonacci retracements, a few questions always seem to pop up. Trust me, I've heard them all. Getting these sorted out is the key to moving from fumbling with the tool to drawing your levels with real confidence.
Let's break down the most common sticking points traders run into.
What’s the Best Timeframe for Drawing Fibonacci Retracements?
The right timeframe is entirely dictated by your trading style. There's no magic number here, but whatever you choose, you absolutely must be consistent.
- Day Traders: If you're in and out of the market on the same day, you'll want to stick to shorter-term charts like the 5-minute or 15-minute. This is where you'll find the intraday trends that matter for your strategy.
- Swing Traders: For those holding positions for a few days or weeks, the bigger picture is what counts. Think 4-hour, daily, or even weekly charts. These timeframes allow you to analyze the major market swings that define your trades.
Here's the golden rule: stay consistent. If you spot your main trend and draw your Fib levels on a daily chart, don't suddenly jump down to a 1-minute chart to look for an entry. That's a classic rookie mistake that introduces a ton of noise and will make you second-guess an otherwise solid plan.
Do Fibonacci Levels Work in Any Market?
Nope. And this is a big one. Fibonacci retracements are built for one thing: trending markets. They come alive when there's a clear direction—a steady march of higher highs and higher lows in an uptrend, or the opposite in a downtrend.
If the market is just chopping sideways in a range, the tool is practically useless. Trying to draw retracements when there's no major trend to "retrace" from just creates arbitrary lines on your chart. You'll get whipsawed by one false signal after another.
So before you even reach for the tool, ask yourself: is there a clear trend here? If the answer is yes, Fibs are your best friend. If not, leave them in the toolbox for another day.
How Do I Know Which Level Is Going to Hold?
This is the million-dollar question, isn't it? And the honest answer is, you don’t. But that’s okay. The point isn’t to predict the future with a crystal ball; it’s to react to what the market is telling you right now.
Instead of gambling on which level will be the magic turning point, professional traders wait for clues. They watch how the price reacts as it approaches each key zone.
A pro trader doesn’t try to predict which level will hold. They wait for confirmation from the market at a specific level and then execute based on that evidence. This simple shift turns guessing into a high-probability strategy.
For example, a quick, shallow pullback that finds instant buyers at the 38.2% level often signals a beast of a trend that’s ready to keep running. On the other hand, a deeper move down to the 61.8% golden ratio can set up a fantastic risk-reward entry, but you need to see the buyers step in.
The trick is to wait for that confirming signal. Maybe it's a powerful bullish candlestick pattern, like a hammer or an engulfing candle, forming right on a key Fib level. That price action is your green light—it turns a simple line into a validated, high-probability trade setup.
Ready to stop drawing lines by hand and start automating your analysis? With ChartsWatcher, you can set instant alerts on specific Fibonacci levels, backtest entire strategies, and find the best setups across the market in real-time. Start your analysis with ChartsWatcher today.
