How to Choose Stocks for Day Trading A Professional Guide
Choosing the right stocks for day trading isn't about chasing hot tips or getting lucky. It comes down to a systematic search for three core traits: high liquidity, predictable volatility, and a reasonable float.
Think of it as developing a repeatable process that filters the entire market down to only the stocks with the specific DNA required for successful intraday moves. Mastering this selection process is the first, and most critical, step toward building any kind of consistency.
The Blueprint for Finding Your Ideal Day Trading Stocks
Jumping into the market without a plan is a recipe for disaster. The sheer number of stocks can feel overwhelming, but professional traders aren't just picking names out of a hat. They apply a strict set of criteria to whittle thousands of options down to a handful of high-potential candidates each morning. This is the foundational skill that separates disciplined traders from the crowd.
The brutal reality is that very few day traders make it. Only 13% manage to stay consistently profitable over six months, and a mere 1% find long-term success over five years. A huge reason for this staggering failure rate is poor stock selection. Data shows that a shocking 72% of traders lose money annually simply because they ignore liquidity, getting trapped in positions they can't exit without taking a huge hit on slippage. You can dig into the numbers in this in-depth analysis of trader statistics.
This is why having a system isn't just a good idea—it's non-negotiable.
Core Traits of a Day Tradable Stock
Before you even glance at a chart or look for a pattern, the stock itself has to pass a few basic tests. These are the non-negotiables that ensure you can actually get in and out of a trade efficiently and safely.
-
High Liquidity: This is your number one priority, period. A liquid stock trades a high volume of shares daily, typically over one million. This heavy volume ensures there are always buyers and sellers ready to trade, allowing you to enter and exit your positions instantly at a fair price without your own order moving the market against you.
-
Predictable Volatility: Volatility is the engine that creates day trading opportunities. You need stocks that actually move. A stock that barely budges a few cents all day is a waste of time and capital. Look for stocks with a healthy Average True Range (ATR) that shows they have a consistent daily price movement you can capitalize on.
-
Reasonable Float: The float is the number of shares actually available for public trading. Low-float stocks can be explosive, but they're also dangerously volatile and easily manipulated. For most traders, mid-to-high float stocks offer a much better balance of meaningful movement and relative stability.
Key Takeaway: Your goal isn't just to find any moving stock. It's to find stocks that move predictably and have enough trading activity to support your strategy without adding unnecessary risk.
To give you an idea of how this works in practice, here is a summary of these core criteria.
Core Criteria for Selecting Day Trading Stocks
| Criterion | What It Means | Why It Matters for Day Trading |
|---|---|---|
| High Liquidity | The stock trades a high volume of shares daily (e.g., >1 million). | Ensures you can enter and exit trades quickly at predictable prices with minimal slippage. |
| Predictable Volatility | The stock has a consistent daily price range (measured by ATR). | Provides enough price movement to generate profit opportunities within a single trading day. |
| Reasonable Float | The number of publicly available shares is not excessively low. | Balances potential for big moves with stability, reducing the risk of extreme, unpredictable spikes. |
These metrics form the foundation of any good day trading watchlist, helping you filter out the noise and focus only on the stocks that offer a genuine edge.
A modern trading platform makes filtering for these criteria incredibly simple. For example, a dashboard in a tool like ChartsWatcher can help you visualize and scan for these essentials in real-time.
This kind of view allows traders to instantly spot the day's top movers, filter by volume, and keep an eye on multiple watchlists at once. It turns the abstract concept of scanning into a concrete, actionable process.
Of course, beyond the strategy for stock selection, the technical gear supporting your trading is just as crucial. For activities that demand split-second execution, like forex, ensuring minimal latency and maximum uptime often means looking into reliable VPS solutions for high-speed trading.
Building Your Custom Stock Screener That Works
Knowing the theory behind liquidity and volatility is great, but putting it into practice to find real, actionable trades is what actually makes you money. This is where a powerful stock screener becomes your most valuable tool. Forget the generic, pre-built scans. We're going to build a custom screener from the ground up, designed to sift through thousands of stocks and hand you a manageable list of high-potential candidates that perfectly match your day trading criteria.
This whole process turns what can feel like an overwhelming task into a systematic, repeatable part of your daily routine. By setting precise parameters, you cut through all the market noise and focus only on stocks with the highest probability of making a move.
This simple flowchart breaks down the core filtering process, starting broad and narrowing down to the best opportunities.
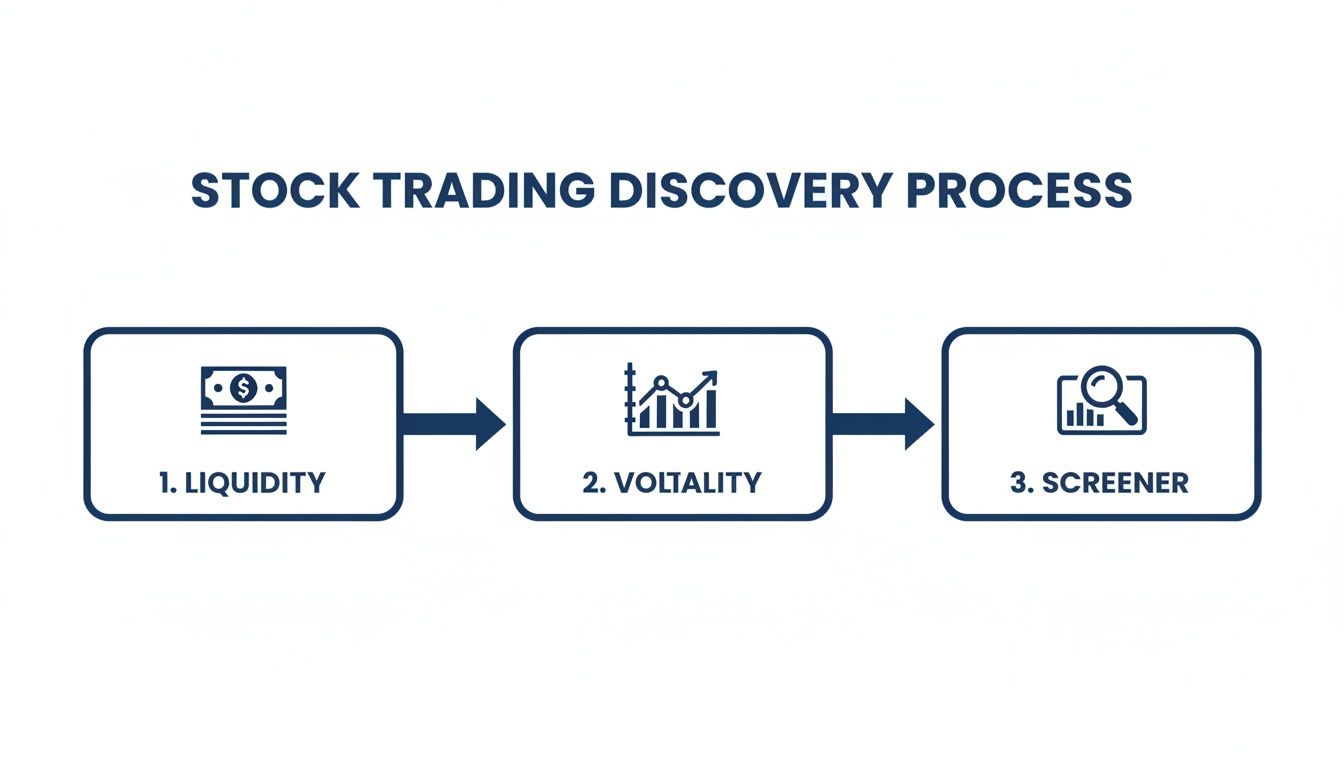
As you can see, it's a logical workflow. First, you confirm a stock has enough liquidity to get in and out cleanly. Next, you check for enough volatility to make a trade worthwhile. Finally, you apply your custom screener to pinpoint the exact setups you’re looking for.
Setting Your Core Filter Criteria
The main job of your screener is to automatically throw out any stock that doesn't meet your non-negotiable requirements for day trading. Let's walk through setting up a solid baseline scan in ChartsWatcher that you can tweak to fit your own style.
We’ll build this around three key pillars:
- Liquidity Filter: Set the Average Daily Volume to be greater than 1,000,000 shares. This is your first and most important cut. It instantly gets rid of the illiquid, dangerous stocks you don’t want to touch.
- Price Range Filter: Define a price range between $5 and $100. This immediately excludes the wild, unpredictable penny stocks and the expensive blue-chips that tie up too much capital for a single day trade.
- Volatility Filter: Use the Average True Range (ATR) as a percentage and set it to be greater than 3%. This makes sure every stock on your list actually has a history of moving enough to be profitable within a single trading day.
A well-configured screener is your first line of defense against bad trades. It forces discipline by making sure every single stock you even look at has already passed your foundational tests for liquidity and volatility.
Example Scan: The Pre-Market Gapper
Okay, let's build a practical, real-world scan that you can use tomorrow morning. This one is designed to find stocks making big moves overnight, usually because of news or some other catalyst. The "Pre-Market Gapper" is a favorite among day traders because it flags stocks that are already "in play" before the opening bell even rings.
Here are the exact settings you’d plug into your ChartsWatcher screener:
- Market Session: Set this to Pre-Market. This is critical—you only want to see what's happening before the regular session starts.
- Price Change %: Set to Greater than +5%. This will instantly find stocks that have gapped up significantly from where they closed yesterday.
- Pre-Market Volume: Set to Greater than 50,000 shares. This is your confirmation filter. It proves there’s real interest and volume behind the move, not just a few small, random orders.
When you combine these criteria with our core liquidity and price filters, you get a clean, focused list of stocks gapping up on meaningful volume. This list becomes your primary watchlist to analyze in that final hour before the market opens. If you want to dive deeper into setups like this, check out our guide on creating the ultimate stock screener for day trading.
For traders who want to take their data game to the next level, some build custom solutions. A more advanced technique involves Scraping Yahoo Finance for Stock Data to feed their own proprietary models, but this definitely requires some technical skill.
By the end of this process, you’ll have a powerful, replicable tool that fits your personal trading style and systematically finds opportunities for you every single morning.
Finding Stocks in Play with News and Catalysts
Technical screeners are fantastic for slicing and dicing the market by the numbers, but let's be honest—the best day trading opportunities almost always have a story behind them. A stock with high volume is good. A stock with high volume, volatility, and a compelling reason for all the sudden attention? That’s where the real money is made.
This is where news and catalysts enter the picture. A catalyst is just a fancy word for the "why" behind a big price move. It's the specific event that gets everyone hitting the buy or sell button at the same time. Learning to spot these events in real-time is what separates the pros from the crowd, as it lets you anticipate moves instead of just reacting to them.
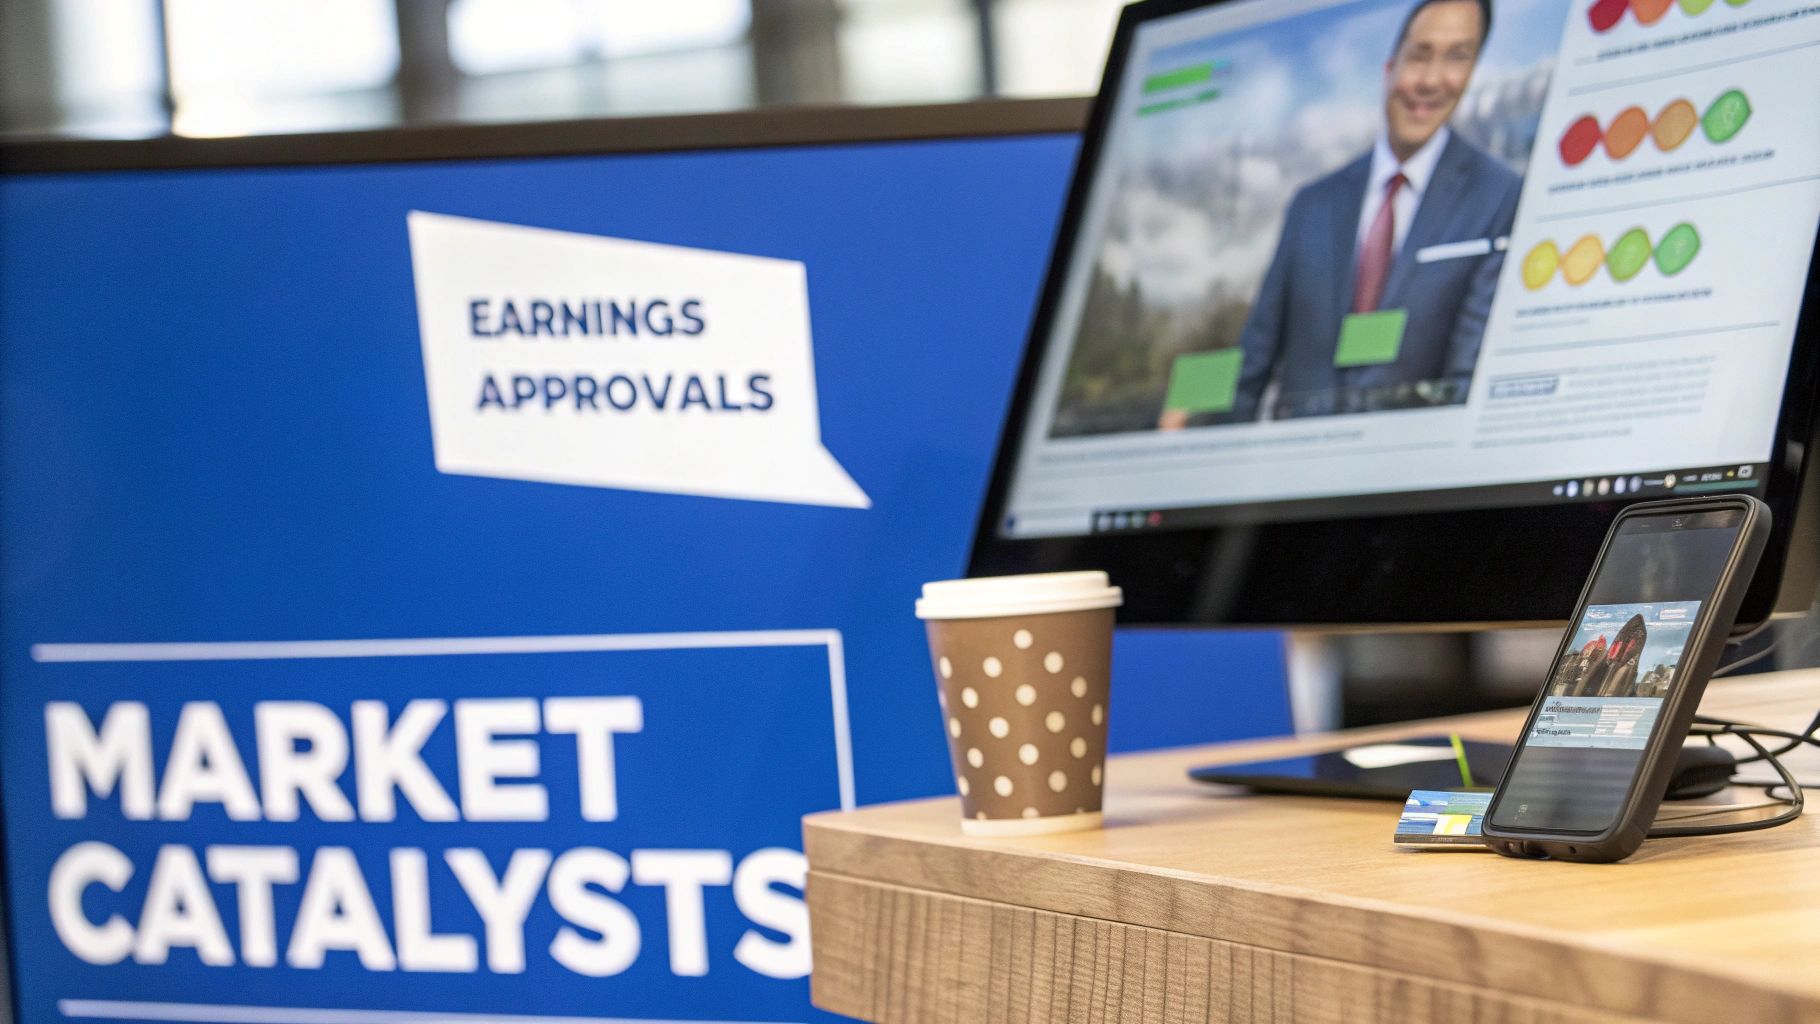
Key Types of Market-Moving Catalysts
Not all news moves the needle. An announcement that sends one stock up 50% in pre-market might barely cause a ripple in another. The trick is knowing which headlines matter.
Here are the big ones I’m always watching for:
- Earnings Reports: This is the classic. A company crushes earnings expectations—what we call an "earnings surprise"—and the stock can take off. On the flip side, a big miss can create a fantastic opportunity on the short side.
- FDA Approvals/Denials: If you trade biotech or pharma, news from the Food and Drug Administration is everything. An approval can literally double a stock's price overnight. A rejection can be absolutely brutal.
- Mergers and Acquisitions (M&A): When you hear that one company is buying another, the target company's stock almost always gaps up to somewhere near the buyout price. It's one of the more predictable catalysts.
- Product Launches and Partnerships: A game-changing new product or a surprise partnership with a huge company can create a tidal wave of speculative buying.
Trader's Insight: The market's reaction is more important than the news itself. A stock might have "good" news but fail to move higher. Always wait for price action and volume to confirm that other traders are reacting to the catalyst before you jump in.
Configuring a Newsfeed for Real-Time Alerts
By the time you read about a catalyst on a major financial news website, you're an hour late. The big move is over. Professional day traders use tools that deliver this info instantly, letting them react in seconds. A dedicated, real-time newsfeed isn't a luxury; it's essential.
On a platform like ChartsWatcher, you can set up a newsfeed window and link it directly to your watchlist or screener results. This creates a killer workflow. A stock pops up on your radar, and you can instantly see the headline that's causing the move.
Imagine your "Pre-Market Gapper" scan flags a stock that's already up 15%. With a quick glance at your synced newsfeed, you see the headline: "$XYZ announces FDA approval for its new cancer drug." Boom. You immediately have the context you need. You know it's a fundamental catalyst driving the action, not just random pre-market noise.
Case Study: A Biotech Breakout
Let's walk through how this plays out. Say a small biotech company, "BioGen Innovations" ($BGIN), closes Tuesday at $10 a share. Then, at 7:00 AM EST the next morning, they drop a press release announcing a surprise Phase 3 trial success for a new Alzheimer's drug.
The news hits the wire, and pre-market volume explodes. By 8:30 AM, $BGIN is trading at $18, a massive 80% gap up on over 500,000 shares of volume before the market even opens. This stock is now officially "in play."
Traders who caught this catalyst early would be mapping out key pre-market support and resistance levels. When the opening bell rings, they’re watching for a clear entry signal—like a clean breakout above the pre-market high—to ride the momentum that this incredible news created.
Understanding these dynamics is central to consistent performance. While a big win is exciting, successful day traders realistically target 1-4% monthly returns. This breaks down to just 0.033-0.13% per day, achieved by meticulously selecting stocks with the right mix of liquidity and volatility in major markets. Focusing on sectors with fresh catalysts is a pro tip; post-earnings, roughly 40% of S&P stocks gap over 4%, creating perfect momentum plays. You can explore more on these day trading profit expectations and see how professionals approach the market. This disciplined approach, supported by tools like ChartsWatcher, is what separates the few who succeed from the many who don't.
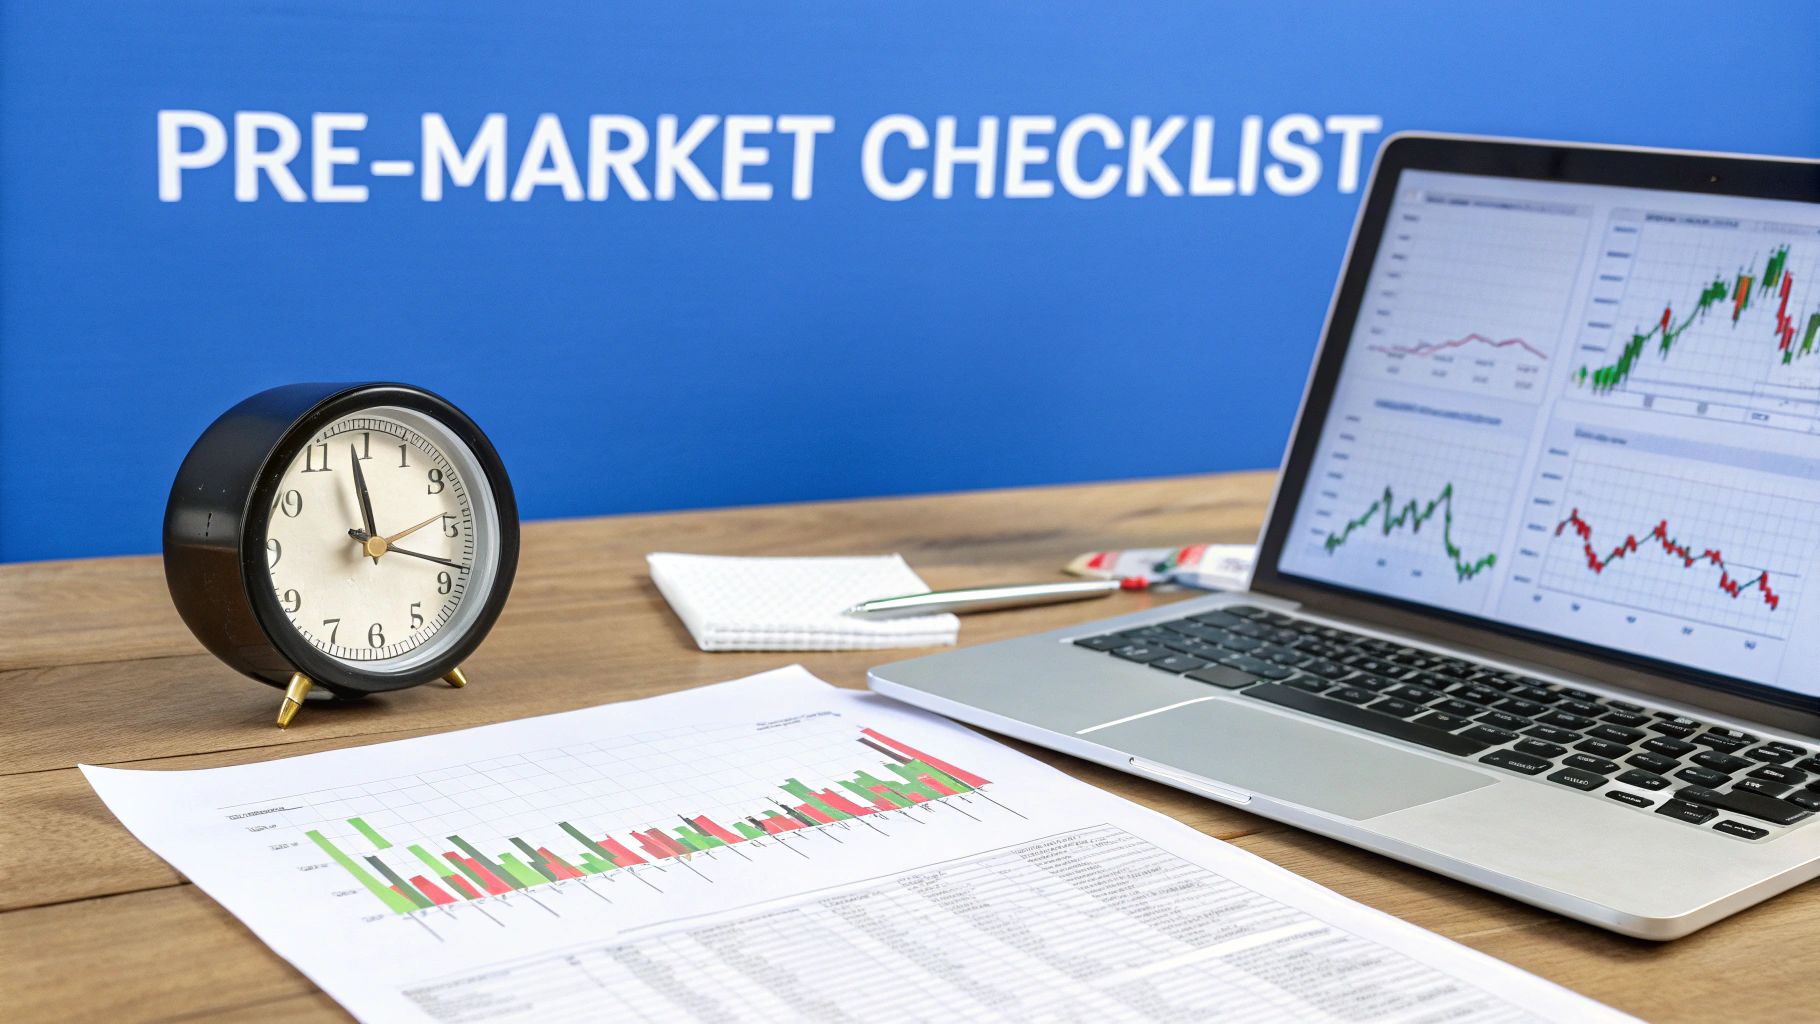
Your Pre-Market Checklist for a Winning Morning
Discipline is what separates the consistently profitable traders from the gamblers. For me, the most important work of the day happens long before the opening bell, in that quiet, focused window between 8:00 AM and 9:30 AM EST. This pre-market routine isn’t just about finding stocks; it’s about building a game plan, filtering out the noise, and getting my head right to execute flawlessly.
A solid pre-market analysis flips the script. Instead of chasing every little pop and drop like a rookie, you become a proactive trader who anticipates opportunities and waits for the perfect setup. This is where you lay the groundwork for a winning session.
Running Your Scans and Building a Candidate List
First things first: I run my custom screeners, especially my "Pre-Market Gapper" scan. This is my first pass at the market, designed to catch stocks that are already showing unusual strength or weakness. The goal here isn't quality, it's quantity. You're casting a wide net just to see what’s moving.
This initial scan might spit out a list of 15-20 stocks. Think of this as your raw material for the morning—a list of potential candidates, not a final trading plan. Now, the real work begins as I start digging into the charts and news for each one.
Analyzing Pre-Market Charts and Volume
With that initial list in hand, it’s time to get into the charts. The pre-market chart, even though it’s often thin on volume, tells a crucial story. I’m looking for clean, orderly price action, not some chaotic, spiky mess.
Here’s what I focus on:
- Key Price Levels: I immediately identify and mark the pre-market high and low. These levels are magnets for price right after the open and often act as critical support or resistance. A stock breaking its pre-market high on big volume is a classic long signal.
- Volume Patterns: Is the volume building consistently into the open, or did it all happen in one quick spike an hour ago? A gradual increase suggests real, sustained interest—a much healthier sign.
- The Catalyst: For every gapper, you absolutely must know the "why." Is there an earnings report? FDA news? A sector-wide event? A stock moving for no apparent reason is unpredictable, and frankly, it's just dangerous.
Professional Tip: A stock that gaps up and then holds those gains in a tight, orderly range during the pre-market is showing immense strength. This is the exact kind of setup that often explodes for a powerful continuation move at the bell.
Crafting Your Final Watchlist
After going through each candidate, the final task is to get ruthless. I narrow down that initial list of 15-20 stocks to a highly curated, focused watchlist of just 3-5 names. This is probably the most critical skill you can develop. Trying to watch too many tickers is a classic rookie mistake that just leads to missed trades and sloppy execution.
My final list consists only of the "A+" setups—the stocks with a clear catalyst, clean pre-market action, and significant volume. For each stock on this final list, I have a basic if/then plan ready: "If XYZ breaks above the pre-market high of $52.50, I'm looking to buy. My stop will go right below VWAP."
This level of preparation strips the emotion and hesitation out of the process when the market opens and things get crazy.
Finally, I take a quick glance at the overall market sentiment. I'll check the index futures for the S&P 500 (ES) and Nasdaq (NQ). Is the broader market gapping up or down? Pushing a bullish setup is a heck of a lot easier on a day when the entire market is ripping higher. Trading with the wind at your back can dramatically increase your odds of success.
Validating Your Strategy Without Risking a Dime
Having a brilliant strategy on paper is one thing. Proving it actually works with real, unforgiving market data is a whole different ball game. This is the crucial bridge between theory and performance, and skipping this step is probably the #1 reason so many new traders blow up their accounts.
Before you even think about putting a single dollar on the line, you have to put your stock selection method through its paces. This means two things: backtesting against historical data and then paper trading in a live, simulated environment. Each one serves a critical purpose in sharpening your edge.
Backtesting Your Stock Selection Criteria
Think of backtesting as your personal time machine. It lets you take your custom screener settings and run them against market data from the past to see how they would have held up. It's the only objective way to answer the question, "Would my method for picking stocks have actually made money last year, or last month?"
A solid platform like ChartsWatcher gives you the tools to run your scans against all sorts of market conditions. For instance, you can see how your "Pre-Market Gapper" scan performed during a choppy, bearish month versus a quiet, bullish one. This is where you find the cracks in your system.
- Dig into the Performance Metrics: You need to look at the hard numbers—win rate, average gain per trade, and especially the maximum drawdown.
- Find the Weak Spots: Did your scan throw up a bunch of false signals when the market got choppy? Maybe your volatility filter is too loose.
- Tweak, Rinse, and Repeat: Use what you learned from the data to adjust your screener settings, and then run the backtest all over again.
This constant cycle of testing and refining is absolutely priceless. To really get into the weeds on this, check out our deep-dive guide on how to backtest trading strategies like a pro.
The Critical Role of Paper Trading
Once your backtests show that your strategy has a legitimate historical edge, it's time to step into a live simulation. This is paper trading, and it's far more than just "practice." It’s where you build the mechanical skill and emotional grit needed to execute your plan perfectly when real money is flying around.
Paper trading throws you into the chaos of the live market without the financial sting. You'll learn what it feels like to manage multiple positions, react to a sudden news spike, and—most importantly—honor your stop-loss rules under real pressure. This is where you iron out all the execution kinks and build the muscle memory for fast, decisive action.
Trader's Reality Check: The market is a brutal teacher. The stats are grim: something like 97% of day traders lose money over 300 days, with just a tiny sliver of traders ever finding consistent success. This just hammers home why a systematic approach to picking stocks and validating your strategy is completely non-negotiable.
This whole validation process—combining objective backtesting with hands-on simulated trading—is what truly gets you ready for the big leagues. It’s your final checkpoint, making sure your strategy isn't just a good idea, but a viable plan that can actually work in the real world.
Answering Your Questions About Stock Selection
Even with the best scanner setup, the real world of trading throws curveballs. Building a solid process is an ongoing journey, and knowing how to navigate the common pitfalls is what separates consistently profitable traders from the rest.
Let's break down some of the most common questions I hear from traders who are dialing in their stock selection process.
How Many Stocks Should I Have on My Watchlist?
This is a classic for a reason, and my answer is almost always, "Fewer than you think." A huge mistake I see traders make is loading up a watchlist with 20 or 30 different stocks. The thinking is that more tickers mean more opportunities. But in practice, it just creates analysis paralysis and leads to sloppy, FOMO-driven trades.
For most traders, especially if you're still working on consistency, the sweet spot is between three and five stocks a day.
This tight focus is a game-changer. It forces you to truly understand the price action, volume patterns, and order flow for each name. You have time to map out the key support and resistance levels, digest the news catalyst, and build a clear "if-then" plan for every stock without feeling rushed or overwhelmed.
Expert Tip: Quality over quantity is the golden rule here. It's far more profitable to know five stocks inside and out than to have a surface-level glance at twenty. A smaller watchlist builds discipline and forces you to only take the highest-quality setups.
What’s the Real Danger With Low-Float Penny Stocks?
Ah, the siren song of low-float penny stocks (usually anything under $5). They're incredibly tempting, I get it. The potential for those explosive, 100%+ moves in a single day can look like a shortcut to a massive P&L.
The hard truth? They're also one of the fastest ways to blow up a trading account. Here’s why:
- Violent Volatility: The volatility you see in penny stocks isn't the healthy, predictable kind. It’s erratic. They can scream up 50% in a few minutes and then collapse just as fast, stopping you out for a huge loss before you can even blink.
- Hidden Liquidity Traps: Sure, the volume might look high, but the liquidity is often dangerously thin. This creates huge gaps between the bid and ask prices (a wide "spread"), which means your entry and exit prices are terrible. It's terrifyingly common to get stuck in a position you can't unload without taking a massive hit.
- Rampant Manipulation: Let's be blunt: these stocks are a playground for manipulation. The infamous "pump-and-dump" schemes are alive and well in this dark corner of the market, and they're designed to lure in unsuspecting retail traders and leave them holding the bag.
While a few highly specialized traders can navigate this minefield, the vast majority of day traders are far better off sticking to stocks priced above $5 with a healthy float. The risk-reward is just so much more manageable.
How Should I Change My Scans for a Bear Market?
Your screening criteria can't be set in stone. The strategy that prints money in a raging bull market will get you absolutely steamrolled when the bears take over. But you don't need to reinvent your entire approach—you just need to flip your perspective.
When the overall market is weak and selling pressure is high, here’s how you adapt:
- Scan for Gap Downs: Instead of just hunting for pre-market gappers, run scans for stocks gapping down. I look for names that are down -5% or more on heavy volume. These are your prime short-selling candidates right from the open.
- Hunt in the Weakest Sectors: Pinpoint which sectors are leading the market lower. If big tech is getting hammered, for example, your watchlist should be full of the weakest tech stocks that are cracking below key support levels.
- Adjust Your Expectations: In a bear market, bullish moves are often short-lived "dead cat bounces." Be much quicker to take profits on any long trades you attempt. Conversely, expect downside moves on your short trades to have more power and follow-through.
The core principles—liquidity, volume, a catalyst—all still apply. You’re just shifting your focus from finding strength to finding weakness.
What Are the "Golden Hours" for Day Trading?
The market definitely has a rhythm. It isn't a non-stop action movie all day. There are specific windows where volume and volatility surge, creating the best, highest-probability setups. Pro traders live by these windows and often sit on their hands the rest of the day.
The absolute most important time to be at your screen is the first 90 minutes after the open (9:30 AM to 11:00 AM EST). This is chaos, but it's organized chaos. All the overnight news gets priced in, big institutional orders are flying, and the primary trends for the day are often forged in this fire. The price action is clean and the volume is incredible.
The second key window is the final hour of trading (3:00 PM to 4:00 PM EST), often called the "Power Hour." Volume swells again as day traders flatten their positions and institutions rebalance into the close. This period is fantastic for catching late-day momentum bursts and trading closing range breakouts.
What about the time in between? The midday session, from roughly 11:00 AM to 3:00 PM EST, is notoriously quiet. Volume dries up, and stocks tend to drift sideways in choppy, frustrating patterns. Many pros call this the "lunchtime lull" and simply walk away from their desks. It's a low-probability meat grinder. Focus your energy on the open and close to trade in sync with the market's natural pulse.
Ready to stop guessing and start building a systematic, data-driven approach to finding high-potential stocks? ChartsWatcher provides the powerful, real-time scanning, charting, and backtesting tools you need to execute your strategy like a professional. Build your custom screeners, spot news catalysts instantly, and validate your edge with historical data.
