How to Backtest Trading Strategies Like a Pro
So, you've got a killer trading idea. Before you throw real money at it, you need to know if it actually has a chance of working. That’s where backtesting comes in. It’s the process of running your trading rules against historical market data to see how your strategy would have performed in the past.
This isn't just an academic exercise. It's a critical, risk-free simulation that helps you validate an idea before risking real capital. This is how you separate a hopeful guess from a statistically sound trading plan.
Why Backtesting Is Your Most Critical Edge
Every successful trader I know validates their ideas before risking a single dollar. Think of backtesting as a flight simulator for your trading strategy—it’s an essential stress test against the wild, unpredictable nature of past market behavior. It’s this process that reveals a strategy’s true character, warts and all.
Running a historical simulation takes your idea from abstract theory to hard, objective evidence. It forces you to answer the tough questions:
- Is it actually profitable? Over a long enough timeline, does the strategy actually make money?
- How much could I lose? What's the biggest drop from a peak to a trough, known as the maximum drawdown? This tells you the kind of pain you might have to endure.
- When does it work (and when doesn't it)? Does it shine in trending markets but get chopped to pieces when things go sideways?
Understanding these dynamics builds the discipline and confidence you absolutely need to stick with your plan when a losing streak hits—and trust me, it will.
Gaining a Statistical Advantage
The whole point of learning how to backtest trading strategies is to find a genuine statistical edge. In the financial markets, guesswork and gut feelings are a fast track to an empty account. A proper backtest replaces emotion with cold, hard data, giving you a clear picture of what you can realistically expect.
You’re not just looking for a handful of winning trades. To get a statistically significant sample size, traders often test their strategies over at least 100 to 200 trades on historical data. This reveals key metrics like your win rate, profit factor, and max drawdown. For example, if your backtest shows a profit factor of 2, it means your strategy historically made $2 for every $1 it lost. That's a strong signal. For more on using historical data effectively, check out the insights over at Afterpullback.com.
Backtesting is the closest you can get to trading in the past. It allows you to make your mistakes on paper, learn from them, and refine your approach without the financial—or emotional—cost of real-world losses.
From Raw Idea to Refined Plan
At the end of the day, backtesting is what turns a rough idea into a polished, data-driven plan. It forces you to define every single rule with surgical precision—your entry triggers, exit points, position sizing, and risk management. This systematic approach uncovers hidden flaws you’d never spot otherwise.
It shows you whether your performance is consistent or just propped up by a few lucky outlier trades. It prepares you mentally for the length and depth of potential drawdowns, which is crucial for surviving in the live market. This preparation isn’t optional; it's what separates professionals who manage risk from amateurs who just chase hope.
Gathering Your Tools and Data

Any backtest is only as solid as the foundation you build it on. Before you even think about hitting "run" on a simulation, you have to get your hands on high-quality data and lock in your strategy's rules with absolute clarity. This is the pre-flight checklist. Skipping a step here is the fastest way to get results that are not just wrong, but dangerously misleading.
It all boils down to that old saying: "garbage in, garbage out." If you feed your backtest spotty data or fuzzy rules, the output is worthless. It can give you a false sense of confidence in a bad strategy or, just as bad, convince you to ditch a potential winner. Let's make sure that doesn't happen.
Choosing Your Historical Data
The quality and detail of your historical data are everything. The data you need is completely dependent on the type of strategy you're running. What a long-term position trader needs is useless for a scalper who lives and dies by the minute.
You'll generally run into three main types of data:
- End-of-Day (EOD) Data: This gives you one snapshot per day—the open, high, low, and close prices. It’s perfectly fine for swing or position trading strategies that play out over days, weeks, or even months.
- Intraday Data: Think 1-minute, 5-minute, or 1-hour bars. This is non-negotiable for day traders. If your strategy makes decisions based on moves happening during the trading day, you need this level of granularity. Testing a 5-minute chart strategy on daily data is a recipe for disaster.
- Tick Data: This is the most granular you can get, recording every single trade that happens. It’s a beast to process but absolutely necessary for high-frequency strategies or systems that are sensitive to the bid-ask spread and order flow.
Here’s a practical example: a simple moving average crossover might look fantastic on a daily chart using EOD data. But when you drill down into the intraday data, you might discover that the "buy" signal usually fired after a huge price spike. Your real-world entry price would have been far worse than what the daily close suggested.
Defining Your Trading Rules with Precision
Once your data is sorted, you have to define your strategy's rules as if you're programming a robot. There can be zero room for ambiguity or "gut feel" during a backtest. That stuff comes later, maybe. For the simulation to be valid, your system must be 100% mechanical.
A backtest doesn't test your intuition; it tests your rules. If you can't write it down as a clear, non-negotiable set of instructions, you don't have a testable strategy.
Your trading playbook needs to spell everything out. No exceptions.
- Entry Triggers: What exact conditions must be met to open a trade? Is it a specific indicator value (e.g., RSI below 30)? A candlestick pattern? A breakout above a specific price?
- Exit Rules (Profit Taking): How do you get out of a winning trade? Is it a fixed price target, a trailing stop, or an opposite signal from your entry indicator?
- Stop-Loss Placement: Where does your initial stop-loss go? This defines your maximum risk. Be precise—is it a percentage of the entry price, a multiple of the Average True Range (ATR), or below a recent swing low?
- Position Sizing: How much are you putting on the line for each trade? A standard approach is risking a fixed percentage, like 1% or 2% of your total account balance, on every single position.
Nailing these down removes the guesswork and makes sure your backtest is an honest reflection of the strategy itself. Our essential guide to backtesting a trading strategy dives even deeper into how to structure these rules for total clarity.
Manual vs. Automated Backtesting Platforms
With your data and rules ready, you need a way to actually run the simulation. Your choice usually comes down to doing it by hand or using specialized software.
| Method | Pros | Cons |
|---|---|---|
| Manual (Spreadsheet) | It's free and forces you to deeply understand your strategy's mechanics. | Incredibly time-consuming, easy to make human errors, and impossible to scale. |
| Automated Software | Blazing fast, mathematically precise, and can test countless ideas. | Can have a cost and a learning curve (like with ChartsWatcher). |
Going through a backtest manually in a spreadsheet is a fantastic learning experience. Seriously. It forces you to live every single trade. But for any serious trader who wants to test multiple variations of a strategy or run it across dozens of assets, automated software is the only realistic option. It eliminates math errors and turns what would be weeks of manual labor into just a few minutes, freeing you up to focus on analyzing results, not punching numbers.
You've got your data lined up and your strategy rules defined. Now for the fun part: putting it all into motion. This is where we stop theorizing and start simulating, letting our trading idea loose on historical market data to see how it would have actually performed.
To walk you through it, we’ll use a classic example that almost every trader tries at some point: the moving average (MA) crossover. The goal isn't to prove this is a world-beating strategy. Instead, I want to show you a repeatable, logical workflow for setting everything up. Once you get this process down, you can adapt it to any strategy you cook up.
Setting Up a Moving Average Crossover Test
Let's get specific. We're going to build a simple, mechanical strategy that's perfect for a first run because its rules are crystal clear.
Here's the playbook:
- Asset: We'll run this on the S&P 500 index ETF (SPY), using daily data.
- Timeframe: Let's look at ten years of price history to give us a good stretch of varied market conditions.
- Entry Signal: We'll trigger a buy order when the faster 50-day simple moving average (SMA) crosses above the slower 200-day SMA. You've probably heard this called a "Golden Cross."
- Exit Signal: And we'll sell when the 50-day SMA crosses back below the 200-day SMA—the infamous "Death Cross."
This is a straightforward, long-only system. We're either in the market with a long position, or we're on the sidelines in cash. No shorting.
A backtest is only as good as its rules. If there's any room for you to second-guess a signal ("Hmm, should I take this one?"), then the rules aren't tight enough. Your entry and exit signals need to be so black-and-white that a machine could follow them without a single question.
Configuring Realistic Simulation Parameters
Running a simulation without accounting for real-world costs is just wishful thinking. To get an honest picture of your strategy's potential, you have to factor in all the little frictions that chip away at your returns.
Before we hit "run," we need to define these crucial details:
- Initial Capital: We'll start our hypothetical account with $100,000. This gives us a solid baseline to measure returns and drawdowns against.
- Position Sizing: To keep it simple, we'll go all in, investing 100% of our capital on every buy signal. When we get a sell signal, we'll exit the entire position.
- Commissions: Even with "commission-free" trading being common now, it’s smart to factor in some cost. We’ll use $1 per trade—one for the entry and one for the exit.
- Slippage: This is the small but inevitable difference between the price you think you'll get and the price you actually get filled at. We'll simulate this by adding 0.05% in slippage to every trade.
These numbers might look tiny, but over dozens or hundreds of trades, they add up. A strategy that looks like a home run without them can easily turn into a dud once reality is factored in.
This visual breaks down the simple workflow we're following: define the rules, run the simulation, and log the results.
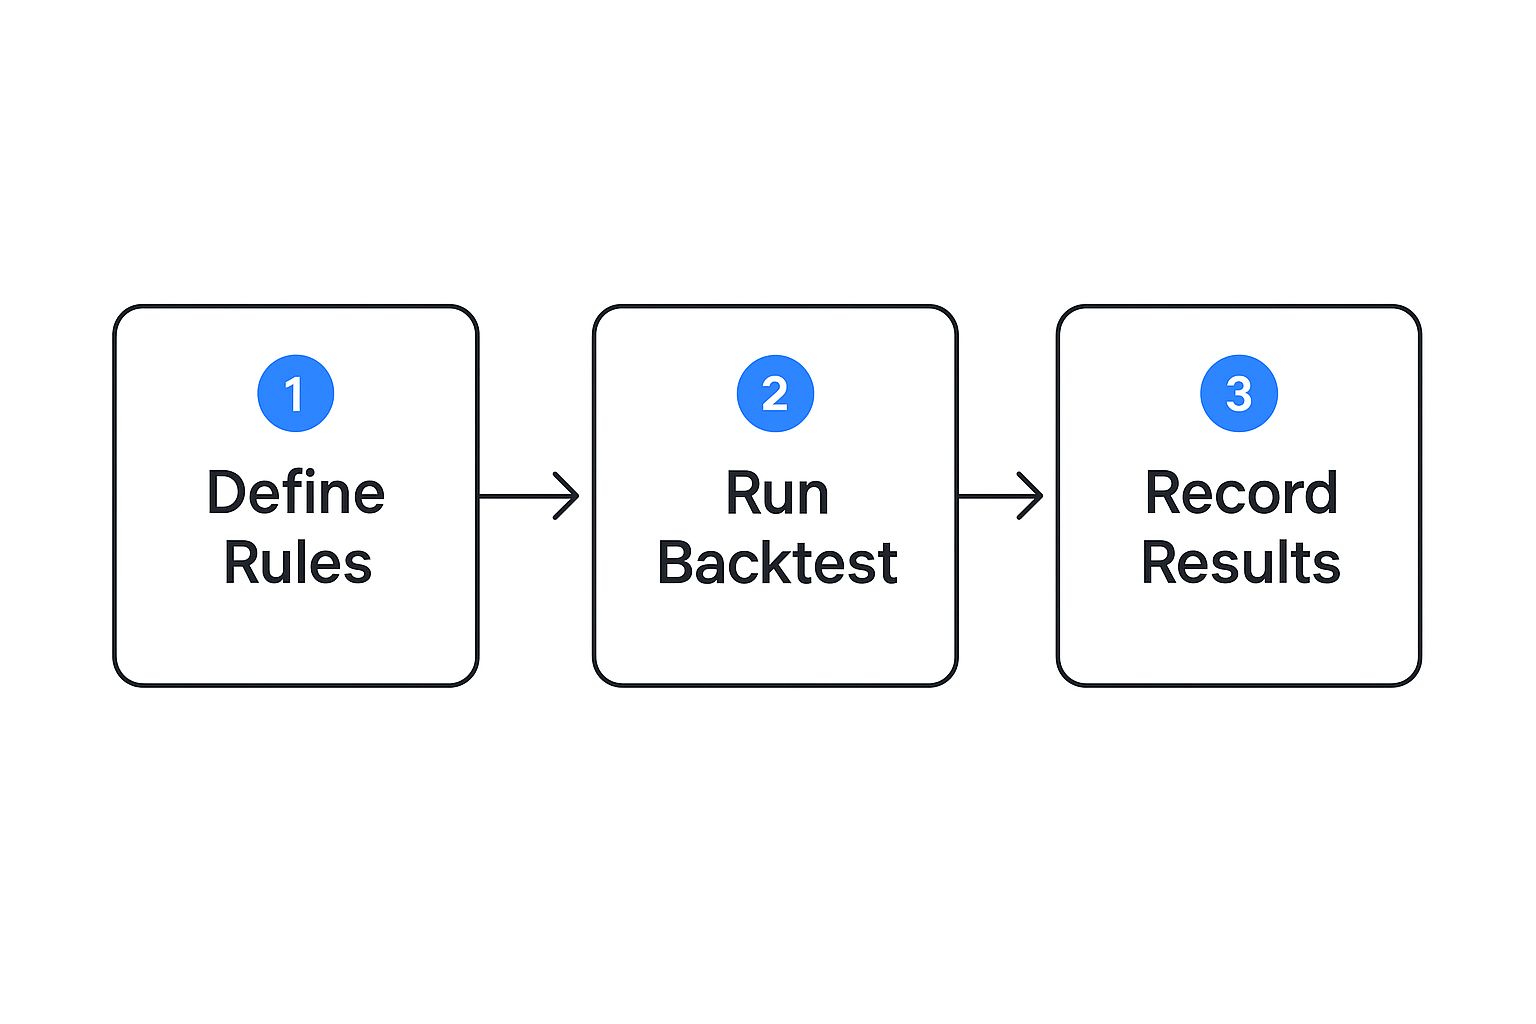
Following this clean, three-stage process keeps every test you run consistent, structured, and easy to compare later on.
Executing the Test and Documenting Assumptions
Okay, time to plug everything into our software. In a platform like ChartsWatcher, we'll input our strategy rules and simulation parameters, then let it run. The software will meticulously churn through ten years of SPY data, day by day, executing trades exactly as we've defined them.
While the computer does the heavy lifting, your job isn't over. You need to document everything. I can't stress this enough. Keep a detailed log for every single backtest variation.
Backtest Log Example
| Parameter | Setting | Rationale |
|---|---|---|
| Strategy Name | 50/200 SMA Crossover | Baseline trend-following test. |
| Asset & Timeframe | SPY, Daily, 10 years | Tests strategy on a major index over a long period. |
| Initial Capital | $100,000 | Standard starting point for analysis. |
| Commissions | $1 per trade | Conservative estimate for transaction costs. |
| Slippage | 0.05% | Accounts for minor execution price differences. |
Why is this so critical? Because backtesting is rarely a one-shot deal. It's a loop: you test, you analyze, you tweak, and you test again. Without a detailed log, you'll forget which changes led to which outcomes, and your progress will grind to a halt.
This disciplined approach is what separates random experimentation from a structured, scientific method. You're building a process you can trust and, over time, a library of robust, well-documented strategies.
When you start running more complex tests on multiple assets, look for ways to automate repetitive tasks. This will make your workflow far more efficient, freeing you up to spend less time on setup and more time analyzing the results.
In a few moments, the simulation will finish and spit out a report full of metrics. This is the raw data we'll use to dissect our strategy's behavior in the next step, turning a wall of numbers into real, actionable insights.
Making Sense of Your Backtest Results
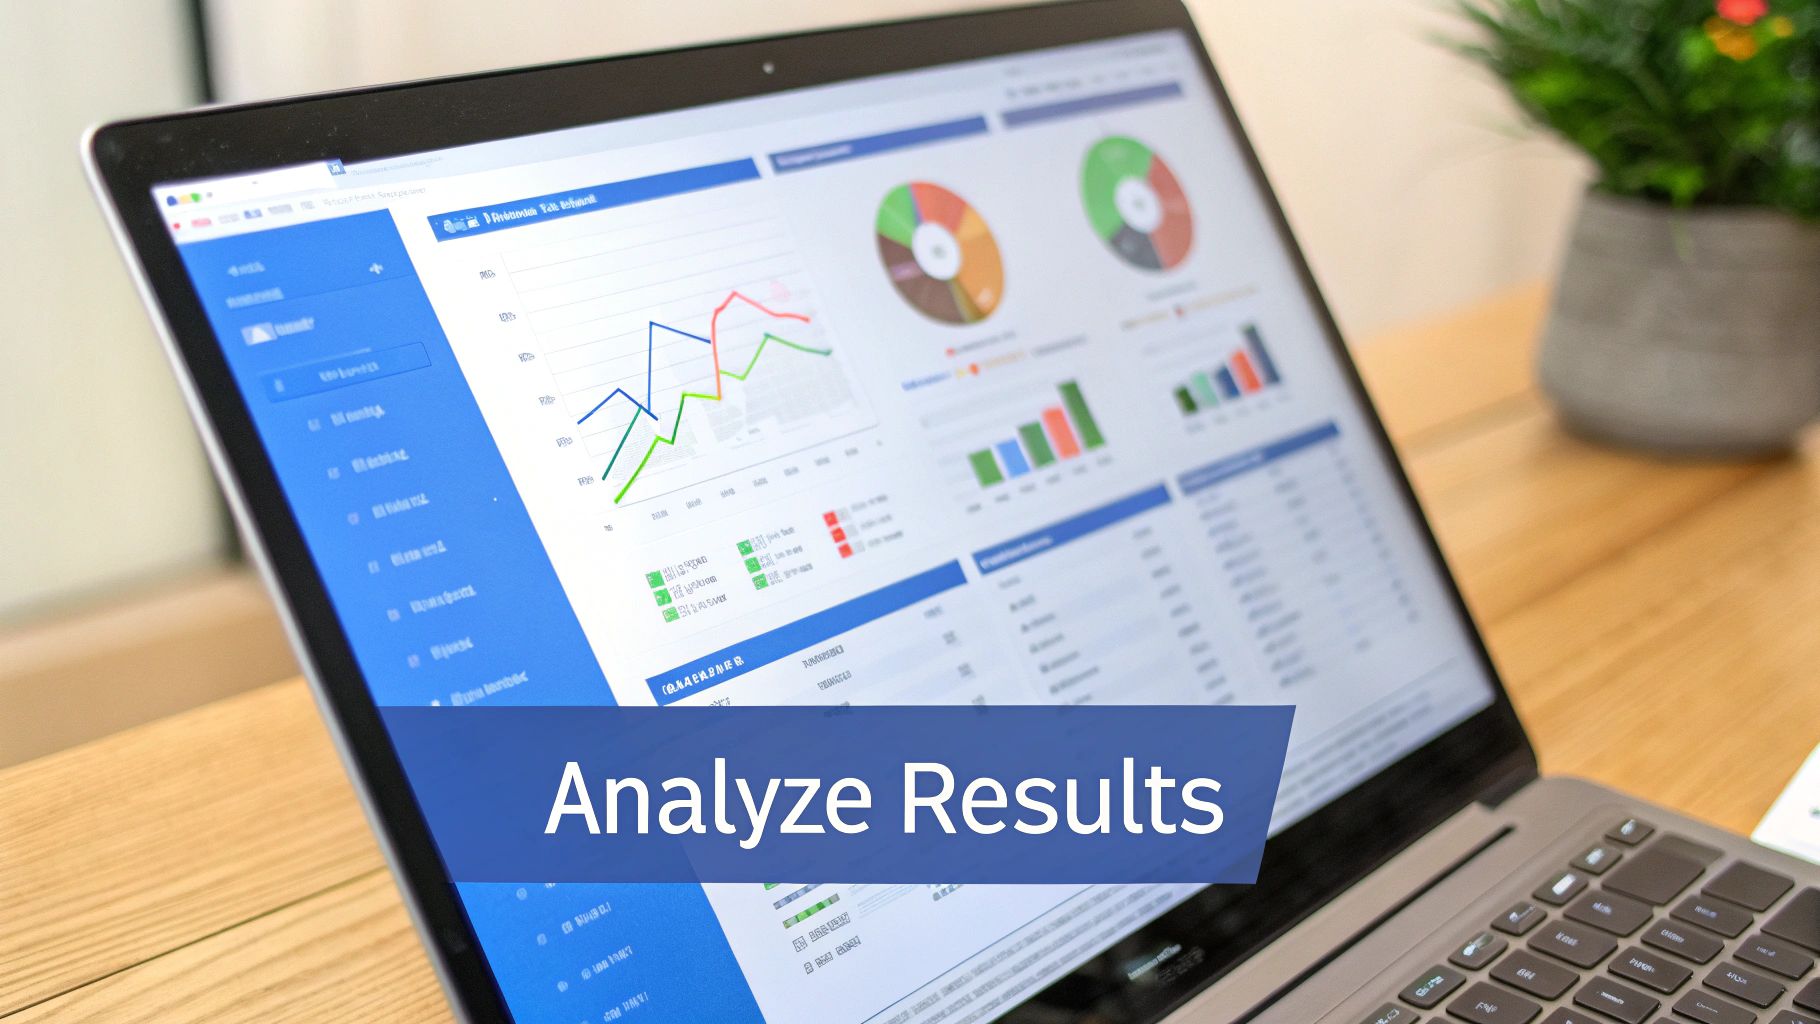
Running the simulation is just the first lap. Now comes the real work: turning that mountain of raw data into trading intelligence. A backtest report is far more than just a final profit number; it’s the story of your strategy's personality, its quirks, and—most importantly—its breaking points.
This is where you switch hats from system designer to data detective. Your mission is to look past the shiny, surface-level metrics and dig into the "why" behind the numbers. A strategy that looks like a winner at first glance might be hiding risks that could easily wipe you out in a live market.
Your Equity Curve Tells the Story
The very first place your eyes should go is the equity curve. This chart is a visual timeline of your account balance over the entire test period, and it tells you almost everything you need to know in a single glance.
A healthy equity curve should climb steadily from the bottom left to the top right. What you’re looking for is a smooth, consistent rise, not a jagged, volatile line that looks like an EKG during a heart attack. That kind of volatility signals a rollercoaster ride you probably don't have the stomach for in the real world.
The equity curve doesn't just show you if the strategy made money; it shows you how it made money. A choppy, erratic curve, even if it ends up profitable, often points to a system that’s either too risky or a poor fit for your trading psychology.
Also, be on the lookout for long, flat periods. These are known as stagnation periods, where the strategy essentially went nowhere for months or even years. Ask yourself honestly: could you handle not hitting a new equity high for that long without losing faith?
Key Metrics Beyond Net Profit
Once you've absorbed the story of the equity curve, it’s time to drill down into the numbers that define your strategy's performance and risk. Net profit is nice, but it's just one piece of a much larger puzzle.
Here are the non-negotiable stats you need to dissect:
- Maximum Drawdown: This is the most sobering number on the report. It measures the biggest drop your account took from a peak to a trough, shown as a percentage. If your backtest shows a max drawdown of 40%, could you have really sat through losing that much of your capital without panicking and pulling the plug?
- Profit Factor: This is your total gross profit divided by your total gross loss. A profit factor of 1.0 is breakeven. Anything over 1.5 is generally solid, and if you see a number north of 2.0, you might have a very robust strategy on your hands.
- Sharpe Ratio: This metric gauges your return against the risk you took to get it. A higher Sharpe ratio (typically above 1.0) means you're getting more bang for your buck in terms of risk. It's a fantastic way to compare different strategies on an even playing field.
Don't be fooled by a high win rate. A strategy with a 90% win rate looks incredible on the surface, but if those 10% of losing trades are big enough to erase all the gains and then some, the system is a total failure. You have to look at these metrics together.
The Truth About Win Rate and Average Trade
Your win rate simply tells you what percentage of your trades made money. But that number is totally useless without its partner: the average win versus the average loss.
Let's look at two different strategies:
- Strategy A: Wins only 40% of the time. But its average winning trade is $1,000, while its average losing trade is just $200.
- Strategy B: Wins a whopping 80% of the time. But its average winner is only $100, and its average loser is $500.
Strategy A, despite the lower win rate, is a highly profitable system. Strategy B is a fast track to the poorhouse. This is precisely why you can never, ever judge a strategy by its win rate alone. The relationship between how much you win when you're right and how much you lose when you're wrong is infinitely more important.
This kind of deep-dive performance analysis was once the exclusive domain of institutional investors. For decades, hedge funds have used extensive backtesting to validate their models, placing huge emphasis on metrics like the Sharpe ratio and maximum drawdown. You can get a sense of how institutional backtesting has evolved at Stonex.com. Their rigorous approach underscores the importance of quality data and realistic assumptions—a standard all serious traders should aim for.
In the end, analyzing your backtest is about building an objective, intimate understanding of your strategy's DNA. It’s about knowing its strengths, weaknesses, and risk profile so well that when you inevitably face a drawdown in the live market, you have the data-backed confidence to stick with the plan.
A backtest with flawed results is worse than no backtest at all. That’s not an exaggeration. A bad backtest gives you a false sense of confidence, tricking you into risking real money on a strategy that’s fundamentally broken.
Learning how to backtest properly means knowing how to spot and neutralize the hidden biases that can completely invalidate your results.
These traps are subtle but deadly. They can make a worthless strategy look like the holy grail, only for it to fall apart the second it hits a live market. Let's pull back the curtain on the most common pitfalls and give you practical ways to sidestep them.
The Allure of Overfitting
Overfitting, also known as curve-fitting, is easily the most common trap. This happens when you tweak your strategy’s parameters so perfectly that it looks incredible on your historical data, but it's so specifically tailored to that past data that it fails on anything new.
Imagine you're designing a strategy for a stock that had a massive, multi-year bull run. You might discover that a specific 13-day and 47-day moving average crossover produced amazing returns. The problem? Those exact parameters are likely just statistical noise—a random combination that happened to work perfectly for that one unique historical period. It has zero predictive power.
A strategy that has been over-optimized is like a key filed down to fit only one specific, antique lock. It's a perfect fit for that single instance, but it's completely useless for any other lock you encounter.
To fight back against overfitting, you have to test your strategy's robustness.
- Use Out-of-Sample Data: The gold standard. Split your historical data into two chunks. Build and optimize your strategy on the first part (the "in-sample" data), then test its final performance on the second, untouched part (the "out-of-sample" data). If it collapses on the new data, you've almost certainly overfit it.
- Keep It Simple: Strategies with fewer rules and parameters are almost always more robust. If your strategy needs ten different indicators to line up just right, it’s probably too fragile for the real world.
The Illusion of Look-Ahead Bias
Look-ahead bias is a sneaky error where your simulation uses information that wouldn't have been available at the moment of the trade. It’s like letting your backtest cheat by peeking at the future.
A classic example is using a day's closing price to decide to buy at that same day's open. In reality, you wouldn't know the closing price until hours later. Another subtle version involves using indicators that "repaint"—meaning their past values change as new data comes in.
This bias creates an unrealistically perfect performance picture because the simulated trades are based on impossible knowledge. To keep your results honest, you must ensure your backtest only uses data that was available at the exact moment a trading decision was made.
The Danger of Survivorship Bias
Survivorship bias happens when your backtest only includes assets that "survived" over the test period. This means you’re completely ignoring all the companies that went bankrupt, were delisted, or got acquired.
For instance, if you test a strategy on the current components of the S&P 500 over the past 20 years, your results will be artificially inflated. You've conveniently excluded all the underperforming companies that were kicked out of the index along the way. Your test is only running on the historical winners.
To avoid this, you need a high-quality, point-in-time historical dataset that includes delisted stocks and reflects historical index compositions as they actually were. This ensures your strategy is tested against the market as it truly was, not just a cherry-picked list of its success stories.
Recognizing and Mitigating Backtesting Biases
These biases can feel abstract, but they have very real consequences. Here’s a quick-reference table to help you spot them in the wild and know exactly what to do about them.
| Bias Type | What It Looks Like | How to Prevent It |
|---|---|---|
| Overfitting / Curve-Fitting | A strategy with amazing backtest results but poor live performance. Often has many complex rules or very specific parameter values. | Use out-of-sample and forward testing. Keep the strategy logic as simple as possible. Test a range of parameters, not just one "perfect" setting. |
| Look-Ahead Bias | The backtest uses future data. For example, using a day's closing price to execute a trade at the open of the same day. | Ensure your code or platform only accesses data that would have been known at the time of the trade decision. Be wary of indicators that repaint. |
| Survivorship Bias | Your test dataset only includes currently active stocks, ignoring those that were delisted or went bankrupt. | Use a high-quality, point-in-time dataset that includes delisted assets and historical index constituents. |
Avoiding these common errors is non-negotiable for creating a strategy you can actually trust. Taking the time to build a robust testing process is what separates consistently profitable traders from those who chase phantom profits.
For a deeper look into creating more robust simulations, our guide on how to master backtesting trading strategies offers more advanced techniques.
Common Backtesting Questions Answered
Even when you feel like you have a handle on the process, questions always come up. Backtesting is full of nuance, and getting the right answers can be the difference between a reliable simulation and a dangerously misleading one. Let's walk through some of the most common questions I hear from traders.
Think of these as the practical queries that take you from just knowing the theory to applying it with confidence.
How Much Historical Data Do I Really Need?
This is the classic question, and the only honest answer is: it completely depends on how often your strategy trades. There's no magic number that works for every single system. The goal is to get enough data to see how your strategy would have survived different market personalities.
- Day Trading Strategies: If you’re in and out of trades within minutes or hours, you absolutely need several years of intraday data. Think 1-minute or 5-minute bars. You need that high resolution to generate enough trades for the results to mean anything.
- Swing or Position Trading: For strategies holding for days, weeks, or even months, a great starting point is 10-20 years of daily data.
Ultimately, you want to capture multiple market cycles. Your strategy needs to be tested through a roaring bull market, a nasty bear market, and those long, frustrating sideways grinds. A good rule of thumb is to aim for a backtest that produces at least 100-200 trades. Anything less, and you risk the results being a statistical fluke.
What's the Difference Between Backtesting and Forward Testing?
People often use these terms interchangeably, but they are two completely different—and equally critical—stages of validating a trading strategy.
Backtesting is running your strategy on purely historical data. It’s your lab. This is where you can rapidly test ideas, tweak parameters, and see what might have worked in the past.
Forward testing, also known as paper trading, is what you do next. You take your finalized strategy and apply it to the live market in real-time, but without putting any actual money down. It's the final dress rehearsal before the big show. This proves your strategy works in the current market, with all its unique quirks and conditions.
A strategy has to prove itself in both the rearview mirror (backtesting) and through the live windshield (forward testing). If you skip one, you're driving with a massive blind spot. Don't even think about putting real capital on the line until it passes both tests.
If a Backtest Is Profitable, Is That a Guarantee of Future Success?
Not a chance. And it's critical to burn this into your brain. A profitable backtest is a fantastic sign that your strategy might have a genuine statistical edge, but it is never a guarantee of future profits.
Markets are living, breathing things. They evolve. Relationships that held true for the last decade can break down tomorrow. What a backtest does tell you is whether an idea is worth pursuing at all.
The reverse is almost always true: a strategy that bombs a properly run backtest has virtually zero chance of making money in a live account. Think of backtesting as a filter, not a crystal ball. It's incredibly effective at helping you throw bad ideas in the trash quickly.
What Is a Good Profit Factor?
The profit factor is a simple but powerful metric: it’s your total gross profit divided by your total gross loss. Anything over 1.0 means the strategy made more than it lost, at least historically.
While there's no single "perfect" number, here's a rough guide I use:
- 1.0 – 1.5: It’s okay, but maybe not strong enough to survive real-world costs like commissions and slippage. It's on the edge.
- 1.5 – 2.0: Now we're talking. A strategy in this range is generally considered solid and is definitely worth a closer look.
- Above 2.0: This is often a sign of a very strong system with a potentially powerful edge.
A word of caution: never judge a strategy by its profit factor alone. I've seen systems with a stellar profit factor of 3.0 that had a terrifying drawdown or were based on only a dozen trades. Always look at it alongside other key metrics to get the full story of its performance and risk.
Ready to stop wondering and start testing? With ChartsWatcher, you can run detailed backtests, analyze every metric that matters, and refine your strategies with professional-grade tools. Validate your ideas with real data, not guesswork. Start your free trial today.
