Finding the Best Stock Trading Software for Your Strategy
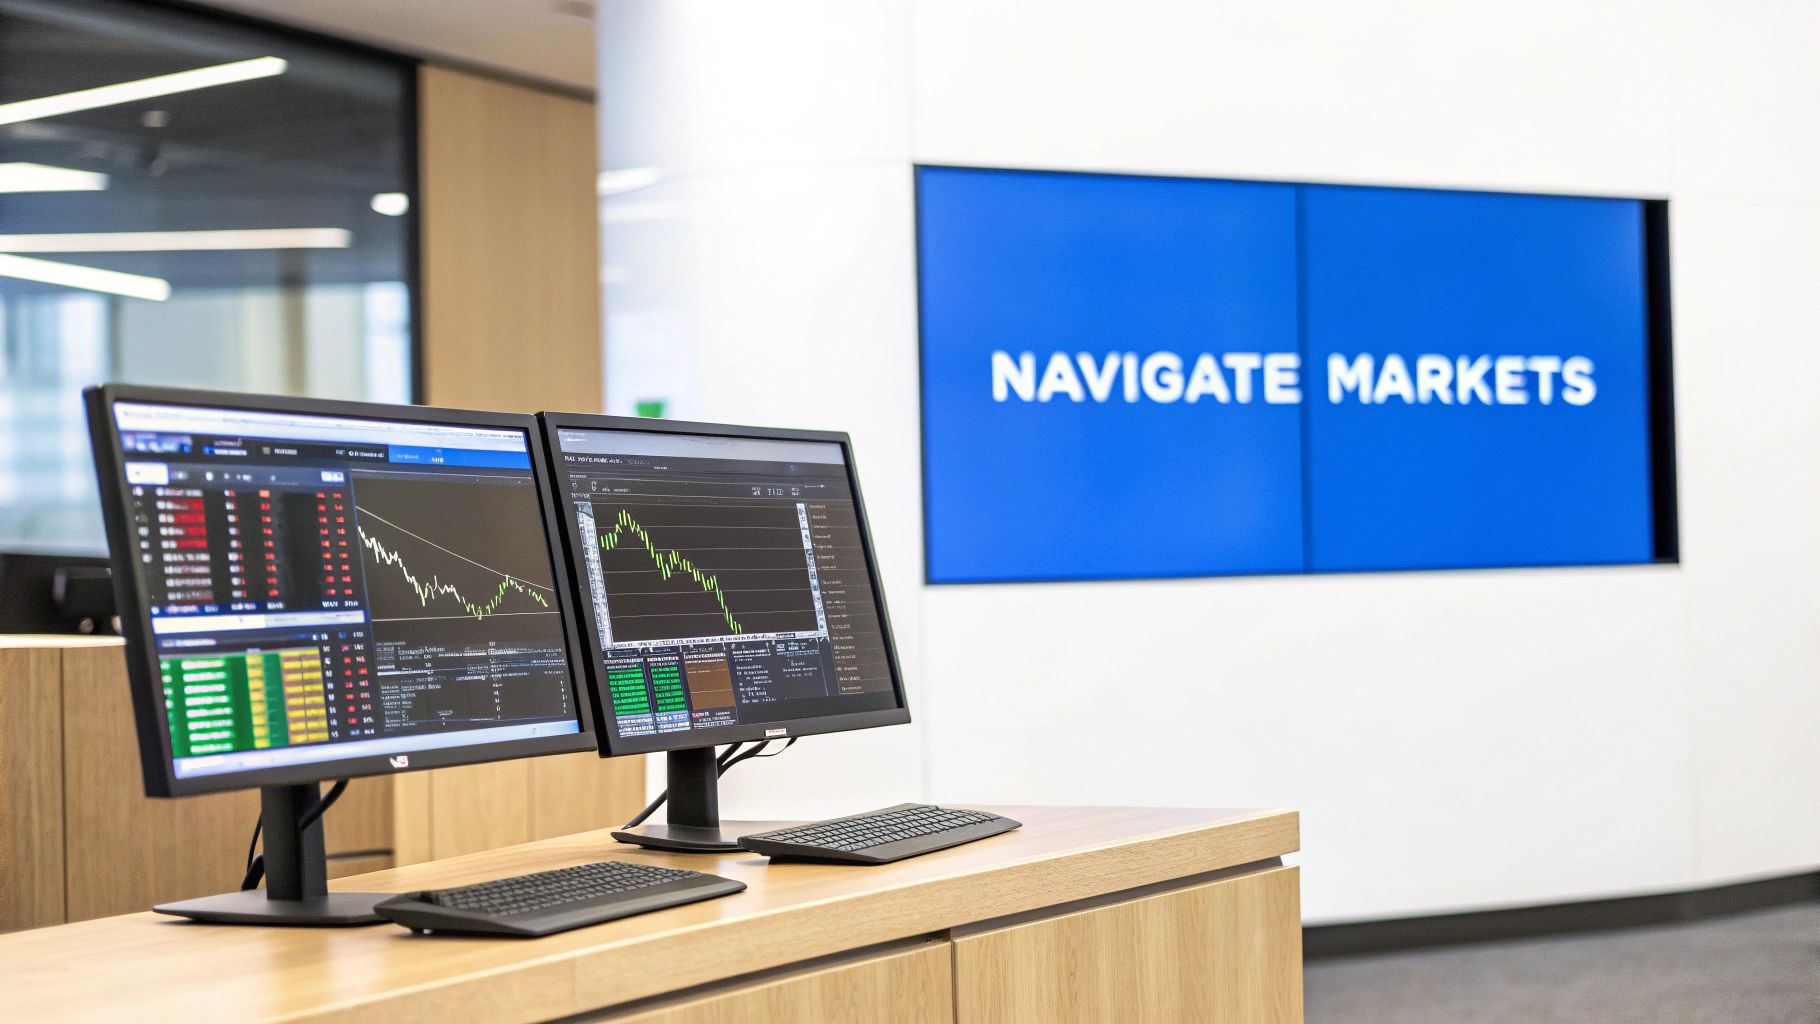
Finding the best stock trading software for your specific strategy is crucial, and a few names consistently rise to the top: ChartsWatcher, Trade Ideas, and TradingView are perennial leaders thanks to their powerful scanning, real-time data, and deep analytical tools. Think of the right platform as your command center—it’s the machine that translates raw market data into genuinely actionable trading opportunities.
Navigating the Modern Trading Landscape
In today's market, picking the right software isn’t just a nice-to-have; it's a critical part of gaining a competitive edge. The market is flooded with sophisticated tools that were once exclusive to professional trading desks, making the choice feel overwhelming. This guide is designed to cut through that noise and help you land on a decision you feel confident about.
We’ll break down the essential criteria every trader should consider—from data latency and scanning power to alert systems and backtesting capabilities. A balanced, in-depth comparison will help you find the perfect software that fits your trading style like a glove.
The Shift to Digital Trading Tools
The online trading platform market has seen explosive growth and is on track to hit a staggering USD 44.29 billion by 2035. This surge highlights the massive shift toward digital tools that give traders unprecedented access to global markets. North America was at the forefront of this movement in 2025, claiming a dominant 39% market share, driven by powerhouse exchanges like the NYSE and NASDAQ.
In this fast-paced financial world, your ability to process information faster is what separates success from failure. The sheer volume of data means your software can't just display information; it has to help you interpret it in a split second.
But even the most powerful platform is useless if it doesn't align with your strategy. Every trader is different, and so are their software needs:
- Day Traders live and die by speed. They need sub-second data latency and highly customizable, real-time alert engines to pounce on fleeting opportunities.
- Swing Traders play a longer game. They prioritize advanced backtesting features and powerful end-of-day scanners to validate strategies that unfold over several days or weeks.
- Long-Term Investors couldn't care less about real-time price action. Their focus is on fundamental data screeners and robust portfolio analysis tools.
Knowing your own methodology is the first step. This guide will give you the context needed to connect your personal trading style directly to the right solution.
Establishing Your Core Evaluation Criteria
Choosing the right stock trading software can feel like an impossible task, with every platform promising to give you some kind of unbeatable edge. The first step is to cut through the marketing fluff and build a clear framework for what actually matters to you. This isn't about finding the software with the longest feature list; it’s about identifying the tools that directly support and amplify your specific trading style.
A disciplined evaluation starts with the non-negotiables of a professional-grade platform. Think of these core criteria as a filter. They’ll help you quickly discard the pretenders and focus on the real contenders built for the demands of active trading. Without this foundation, you’ll either end up paying for features you never use or, far worse, miss a critical function that could make or break your entire strategy.
Data Latency and Quality
First and foremost: data is everything. For an active trader, the gap between real-time and delayed data is the gap between a winning trade and a missed opportunity. A 15-minute delay might be fine for a long-term investor, but for a day trader, it's an eternity.
When you’re looking at software, check for direct data feeds from the exchanges. This is the only way to ensure you're getting tick-by-tick information with the lowest possible latency. If you’re running strategies that depend on speed for precise entries and exits, anything less is a serious compromise.
Scanners Versus Screeners
It's easy to get these two mixed up, but they serve completely different purposes. A basic stock screener typically uses end-of-day data to filter stocks based on fundamentals like P/E ratios or market cap. It’s useful for finding long-term investment ideas, but it’s completely useless for spotting intraday moves.
An advanced stock scanner, on the other hand, is a dynamic, real-time beast. It’s constantly watching the entire market for conditions you define—like stocks hitting new intraday highs, seeing unusual volume spikes, or smashing through key technical levels. The best platforms offer multi-factor scanners that let you combine dozens of technical and real-time metrics to find setups that perfectly match your trading plan.
A screener helps you find stocks to watch over the next few months. A scanner helps you find stocks to trade in the next few minutes. Understanding this distinction is fundamental to choosing the right tool for your timeline.
Customizable Alerts and Notifications
You can't have your eyes on every stock, every second of the day. A powerful alert system is your automated partner, pinging you the moment a predefined condition is met. This goes way beyond simple price pings.
Top-tier platforms let you build complex, multi-conditional alerts based on your scanner criteria. Imagine setting an alert for any S&P 500 stock that crosses its 50-day moving average on more than 300% of its average volume. That level of customization automates your opportunity flow, freeing you up to focus on analysis and execution instead of just staring at charts.
The Power of Backtesting
An idea is just a guess until you prove it with data. Backtesting is how you apply your trading strategy to historical market data to see how it would have actually performed. For any serious trader building a consistent, rules-based approach, this is one of the most important features a platform can offer.
A robust backtesting engine lets you validate your strategies, find their weak spots, and tweak your parameters before you risk a single dollar of real capital. To get a better handle on what this involves, you can learn more by reviewing the 12 best backtesting software for stocks in 2025. Without this capability, you’re just flying blind and trading on gut feelings instead of data-driven evidence.
A Detailed Comparison of Top Trading Platforms
Now that we've laid out the essential criteria, it's time to put the leading platforms under the microscope. Picking the best stock trading software isn’t about finding one “perfect” tool for everyone. It’s about matching a platform’s strengths to your unique trading style. What feels intuitive and razor-sharp to a high-frequency scalper might seem clunky and overwhelming to a swing trader focused on technical patterns.
This comparison goes beyond simple feature checklists. We'll dig into the nuances between top contenders like ChartsWatcher, Trade Ideas, TradingView, and Benzinga Pro. I'll break down how each one handles critical tasks—real-time data, scanning, and backtesting—to give you a clear sense of who really benefits from their specific approach.
The North American market is the engine driving most of the innovation here. It’s no surprise, really. North America dominates the trading software landscape, holding the largest market share at roughly 40% in 2024. This is fueled by the world's biggest stock exchanges, the NYSE and NASDAQ, which are the global epicenters for high-frequency and algorithmic trading. The entire trading software market is projected to grow at a CAGR of 6.344% from 2025 to 2033, showing that traders' appetite for better tools isn't slowing down.
This infographic shows the core workflow that any elite platform has to nail, from ingesting raw data to pushing out actionable alerts.
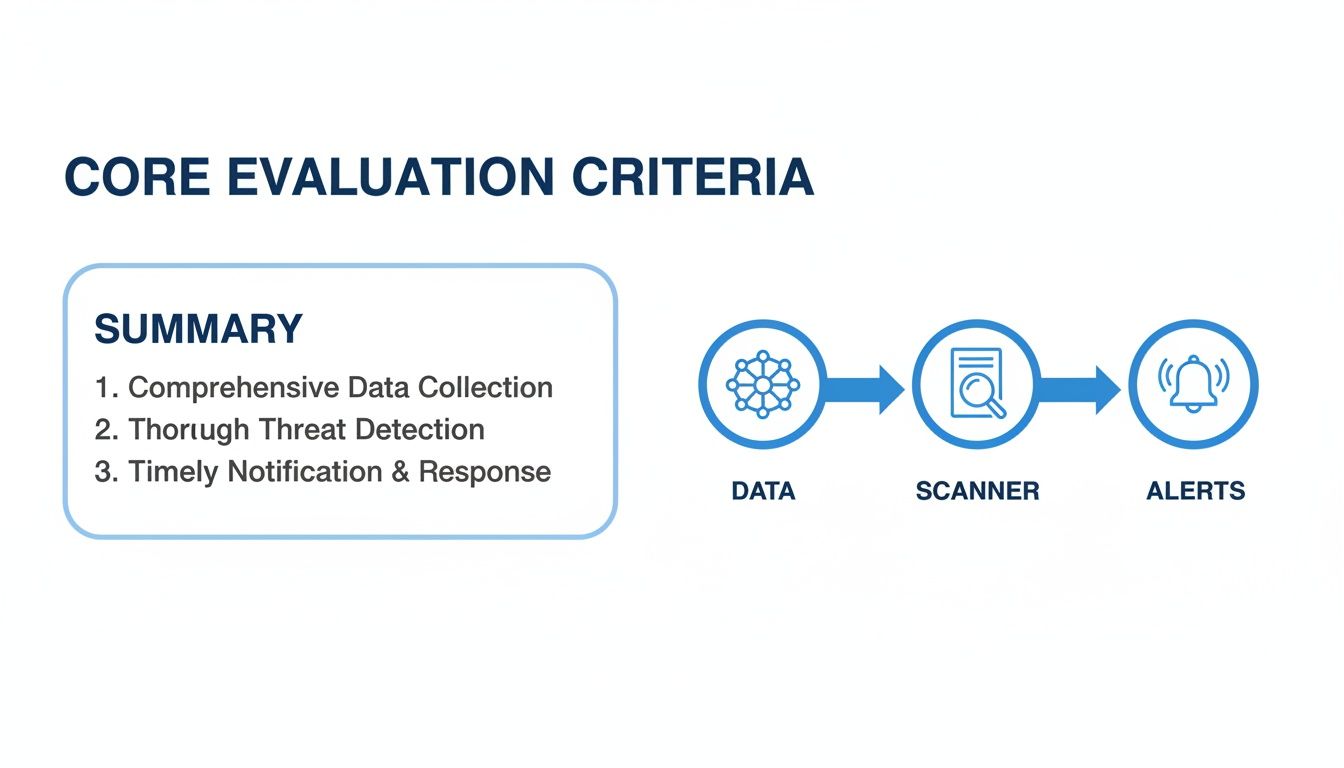
What this really highlights is that the best platforms aren't just a collection of features. They shine in how seamlessly they integrate data, scanning, and alerting into one cohesive, efficient process.
Real-Time Data and Scanning Engines
For any active trader, the speed and quality of your data are everything. A platform's ability to not only serve up low-latency data but also give you the power to sift through it effectively is what separates the good from the great.
Trade Ideas is often seen as the gold standard for its AI-powered scanning. Its main draw is its proprietary AI, "Holly," which generates algorithmically-driven trade signals by hunting for statistical opportunities. This is a massive plus for traders who want to offload some of the heavy lifting and get curated ideas. The downside? The interface can feel a bit dated, and building your own complex scans from scratch has a much steeper learning curve than some of the more modern UIs.
TradingView, on the other hand, wins on its incredibly intuitive charting and massive community. Its scanners are solid and easy to get started with, which is why it's a go-to for technical traders who live and die by their charts. While its data is quick, its true strength is in visualization and social collaboration, not the raw, multi-factor scanning muscle you'll find in more specialized tools.
This is where ChartsWatcher carves out its niche. It was built from the ground up with total user control and modularity in mind. Its scanning engine is designed for traders who build strategies from scratch, allowing you to create incredibly complex, multi-conditional scans that can be saved, tweaked, and linked directly to your charts and alerts. This makes it a beast for systematic traders who need to test and deploy very specific criteria without being boxed into pre-set configurations. The platform's German engineering really comes through in its emphasis on data reliability and precision.
Alert Systems and Customization
A great alert system is more than just a price notification; it’s your automated opportunity scout. The depth of customization is what determines how effectively you can put your opportunity pipeline on autopilot.
Benzinga Pro really stands out with its real-time news alerts and the "Squawk" feature—an audio broadcast of breaking market news and analysis. For traders who focus on news-driven catalysts, this is invaluable. Its alerts are heavily weighted toward fundamentals and news triggers, so it's probably not the best fit if you're running purely technical setups.
TradingView has a super versatile alert system that you can attach to almost anything on a chart. You can get pinged when a price crosses a trendline, an RSI level gets breached, or a moving average crossover happens. This chart-centric approach is extremely intuitive for technical analysts.
The most powerful alert systems are not just notification tools; they are integrated components of your scanning engine. An alert should trigger precisely when your predefined, multi-factor scan conditions are met, creating a seamless workflow from discovery to execution.
ChartsWatcher takes this idea a step further. Its alerts are a direct extension of its custom scanning engine. Any complex scan you dream up can be turned into a real-time alert with a single click. This creates a powerful feedback loop: you define a precise market condition (like a stock breaking its opening range on 5x average volume), and the platform tells you the instant it happens. It frees you from having to manually stare at dozens of charts. For a closer look at charting tools, check out our guide on the top 10 best stock chart software for 2025 to make smarter trades.
Backtesting and Strategy Validation
Backtesting is what separates data-driven strategies from pure guesswork. For any serious trader, the ability to stress-test an idea against historical data is non-negotiable.
Trade Ideas has a unique tool for this called the "Oddsmaker." It lets you backtest specific scanner settings and events to see how they would have performed historically. It’s excellent for validating the statistical edge of a particular scanning strategy over a long period.
TradingView offers a strategy tester that works with its native Pine Script language. This gives you immense flexibility to code and backtest intricate custom strategies right on your charts. The catch, of course, is that it requires you to learn a scripting language, which can be a hurdle for some traders.
ChartsWatcher integrates backtesting directly into the scanner workflow itself. You build a custom scan and then simply run it against historical data to see which stocks would have met your criteria in the past. It’s a highly practical approach because it directly validates the effectiveness of the exact scanning parameters you plan to use in the live market. It's less about coding complex algorithms and more about testing the real-world performance of your filters and triggers.
When looking at different platforms, it's vital to understand what they offer beyond just placing trades. For a wider view of tools that help with decision-making, you might want to explore the best portfolio analysis tools.
Feature and Pricing Comparison of Leading Trading Software
To make things easier, this table gives you a quick, side-by-side summary of how these top platforms compare on the most important criteria. It's a great way to see at a glance where each one shines.
| Software | Key Feature Highlight | Real-Time Data Level | Custom Scanners | Backtesting | Ideal For | Starting Price |
|---|---|---|---|---|---|---|
| ChartsWatcher | Highly modular UI and integrated scanner-alert system | Level 2 (Pro) | Advanced, multi-conditional | Integrated scanner backtesting | Systematic and technical traders | Free (Basic) |
| Trade Ideas | AI-driven trade signals and event-based backtesting | Level 2 | AI-powered and custom | Strategy "Oddsmaker" | AI-assisted and momentum traders | $118/mo |
| TradingView | Superior charting and social/community features | Level 1 & 2 Add-on | Good, chart-based | Pine Script strategy tester | Technical chartists, all levels | Free (Basic) |
| Benzinga Pro | Real-time news alerts and audio "Squawk" | Level 2 | Fundamental and news-based | Limited / N/A | News-driven and catalyst traders | $197/mo |
This breakdown should help you pinpoint which platform not only fits your budget but, more importantly, aligns with the way you trade.
Matching Trading Software to Your Strategy
A high-powered trading platform is useless if it doesn’t mesh with your actual strategy. What a high-frequency day trader needs is worlds apart from the toolkit of a long-term technical investor. The key is to find software that feels less like a tool and more like an extension of your own mind.
Choosing software before you’ve defined your strategy is like buying a race car for a grocery run—it’s overkill, impractical, and just plain inefficient. Your goal should be to find a setup that amplifies your strengths and gets out of your way, rather than adding friction to your decision-making.
Let's break this down by looking at a few distinct trader profiles. This isn't about reciting feature lists; it's about seeing how specific tools solve real-world problems for different kinds of traders.
The High-Frequency Day Trader
For the high-frequency day trader, every millisecond is money. This trader is in and out of the market dozens, sometimes hundreds, of times a day, trying to scalp tiny price movements. Their entire game is built on speed, precision, and a flawless stream of real-time data.
The software requirements here are intense and completely non-negotiable:
- Sub-Second Data Latency: They need a direct pipeline to the exchanges. A one-second lag isn't a minor annoyance—it's the difference between a winning scalp and a losing one.
- Level 2 Data: Seeing the order book is everything. It’s how they read supply and demand on the fly. Any platform that only provides Level 1 quotes is a non-starter.
- Deeply Customizable Alerts: Their alerts have to be as fast and smart as their scanners. They need to set up complex, multi-layered conditions that fire instantly—like a stock hitting a new 5-minute high while volume is 400% above average.
- Hotkeys and Fast Execution: The ability to fire off orders with a single keystroke, directly from a chart or scanner, is absolutely critical for getting the best entry and exit.
For this trader, a platform like ChartsWatcher becomes their cockpit. They’ll run a multi-monitor setup: one screen dedicated to real-time scanners hunting for momentum, another showing Level 2 data for their live trades, and a third with charts linked to hotkeys for instant execution.
The Technical Swing Trader
The technical swing trader operates on a completely different clock, holding positions for days or even weeks. Their goal is to capture bigger moves by identifying trends and classic technical patterns on daily or weekly charts. Here, analytical power trumps raw speed.
Their software needs are all about research, validation, and analysis:
- Advanced Charting Tools: They live and die by their charts, so they demand a full suite of technical indicators, drawing tools, and the flexibility to save different layouts and templates for various setups.
- Powerful End-of-Day Scanners: Their most important work often happens after the market closes. They need to run scans on the entire market to find stocks setting up perfectly for the next day or week, like a bull flag forming or a stock coiling near its 52-week high.
- Robust Backtesting Capabilities: Before putting real money on the line, a swing trader needs to know if their strategy actually works. Software that lets them test a scanner's logic against years of historical data is priceless.
A swing trader using ChartsWatcher would lean heavily on its integrated backtesting engine. They could build a scan to find stocks crossing their 50-day moving average on huge volume, then run that exact strategy against the last five years of market data. This data-driven process is what builds confidence and refines an edge over time.
For a swing trader, the software's job is not just to find opportunities but to provide the historical context needed to confirm a strategy's edge. Backtesting turns a trading idea into a validated system.
The Part-Time Investor
Finally, let's look at the part-time investor or long-term portfolio manager. This person might check their holdings once a week and makes decisions based on fundamentals and broad market trends. For them, real-time data and intricate scanners are just noise.
Their software needs are much simpler, but just as specific:
- Fundamental Screening: They need to filter the universe of stocks based on metrics like P/E ratio, dividend yield, and revenue growth. This is their starting point.
- Portfolio Analysis Tools: The software should make it easy to track their positions, visualize performance, and get a quick snapshot of their portfolio's health.
- Clean User Interface: Since they aren't glued to the screen all day, they need an intuitive platform that’s easy to navigate without a steep learning curve.
This type of investor would likely find a high-end professional platform overwhelming. A more streamlined tool, or even a basic plan on a powerful platform like ChartsWatcher, would be perfect. It would give them the ability to run their fundamental screens and manage a watchlist without getting bogged down in features built for hyperactive traders.
Why Serious Traders Gravitate Toward ChartsWatcher
Sooner or later, every serious trader hits a wall with generic, one-size-fits-all platforms. You realize you need a tool built not just for viewing markets, but for completely deconstructing them. This is exactly where ChartsWatcher comes in, moving past rigid layouts to offer a truly modular and analytical trading environment.
At its core, ChartsWatcher is built for precision and control. Its absolute standout feature is a highly adaptable interface that lets you build a completely custom trading dashboard from scratch. You're not locked into a fixed structure; you can create multiple screen layouts, each one designed for a specific strategy or market condition.
For a professional, this level of control is a complete game-changer. You could have one dashboard dedicated to pre-market scanning, another for tracking live trades with linked Level 2 data, and a third for your end-of-day analysis. This modularity means every single pixel on your screen serves a purpose in your workflow.
Unified and Synchronized Analytics
The real magic happens when you start linking these modular windows together. Imagine clicking a stock in your real-time scanner. Instantly, your chart, news feed, and alerts windows all sync to that specific ticker. This creates a holistic, real-time view of any opportunity without you having to lift a finger.
This synchronized ecosystem removes the friction and delay that comes from juggling separate, disconnected tools. It lets you move from discovery to analysis to execution in one fluid motion. For traders who live and die by speed and efficiency, this integrated approach is invaluable.
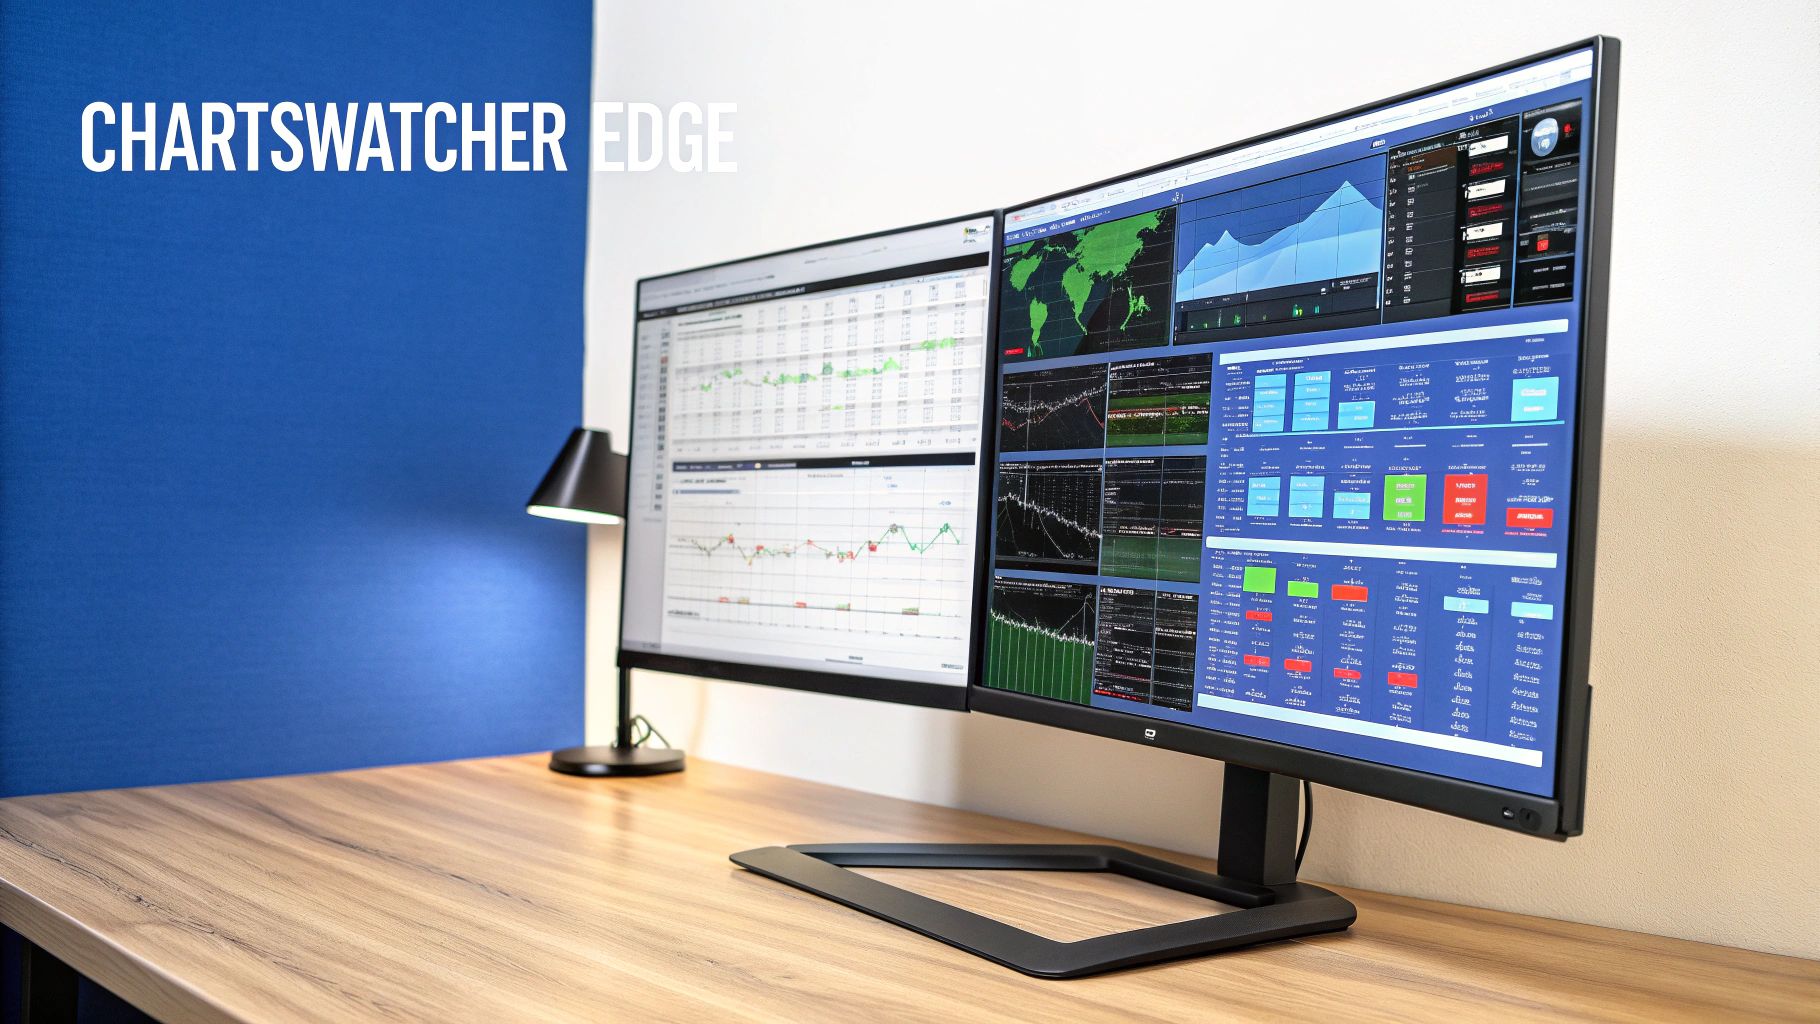
The screenshot below gives you a glimpse of how a trader can set up multiple, synced windows for a comprehensive market overview. You can see how the charts, watchlists, and scanners all work in concert, a direct reflection of the platform’s focus on user-defined workflows.
Advanced Filtering and Strategy Validation
Beyond its slick interface, ChartsWatcher packs a powerful analytical engine. The platform’s scanner isn't just a simple screener; it’s a full-blown workshop for building complex, multi-conditional trading strategies from the ground up. You can layer dozens of technical and real-time filters to pinpoint the exact market setups you’re hunting for.
Better yet, this engine is directly tied to an integrated backtesting feature. Once you’ve built a custom scan, you can immediately run it against historical data to see how it would have performed. This gives you a practical, data-driven way to answer the most important question any trader has: "Does my strategy actually have an edge?"
The ability to create a precise scan and immediately test its historical performance within the same interface is a critical workflow for any systematic trader. It transforms a trading idea into a statistically validated strategy before risking capital.
The platform's German engineering also shines through, providing the kind of quality and reliability you need for data integrity and stable performance under intense market conditions.
Accessible for All Trader Levels
Despite its professional-grade power, ChartsWatcher doesn't lock anyone out. The free Basic plan is a surprisingly powerful entry point, letting new traders get familiar with the core features without any financial commitment. From there, the plans scale up to provide the advanced tools that full-time professionals demand.
This tiered approach means the platform can grow with you as your trading evolves. Whether you're just developing your first strategy or managing a sophisticated, multi-asset workflow, ChartsWatcher has the tools you need. This combination of deep customization, integrated analytics, and scalable access makes it a compelling choice for any trader serious about mastering their craft.
Answering Your Key Questions About Trading Software
Picking the right trading software usually boils down to a handful of critical questions. Before you pull the trigger, you need real clarity on the differences between core features and what’s truly essential for your specific strategy. Let's clear up any lingering uncertainties so you can make a final decision.
Confidence in your platform comes from deeply understanding its capabilities. Let's tackle some of the most common points of confusion to make sure you invest in a tool that actually helps you hit your trading goals.
What Is the Difference Between a Stock Screener and a Stock Scanner?
This is a common mix-up, but screeners and scanners serve completely different purposes. A stock screener is a filtering tool. It typically works with static, end-of-day data to find companies that match specific fundamental or technical criteria. Think of it as a research assistant for long-term investors who want to find stocks based on P/E ratios or dividend yields.
A stock scanner, on the other hand, is alive. It operates in real-time, constantly watching the market for dynamic conditions you set—like stocks hitting new intraday highs or seeing a sudden, unusual surge in volume. This makes it an absolutely essential tool for active day traders who need to spot and react to opportunities the second they appear.
Do I Really Need Real-Time Data for Trading?
Whether you need real-time data depends entirely on your trading timeline. If you're running active strategies like day trading or scalping, where decisions happen in seconds, real-time data is non-negotiable. Even a tiny delay can mean a missed entry or a painful loss.
For swing traders or long-term investors, the pressure is lower. A 15-minute delay might be perfectly fine for strategies that play out over days or weeks. Still, even for these styles, having access to real-time information gives you a serious advantage for timing your entries and exits with precision.
Backtesting is the process of turning a trading hypothesis into a data-driven strategy. It provides the statistical evidence needed to trade with confidence, manage risk effectively, and refine your edge before deploying real capital.
How Important Is Backtesting in Trading Software?
For any trader trying to build a systematic, rules-based approach, backtesting is critical. It’s the function that lets you take your trading rules and run them against historical market data to see how they would have performed.
This process is invaluable for a few reasons. It helps you find the flaws in your logic, tweak parameters to improve performance, and understand how your strategy might hold up under different market conditions. Software with strong backtesting tools provides a massive analytical edge, separating methodical traders from those just going with their gut.
Can I Succeed with Free Stock Trading Software?
Free software can be a great way for beginners to get their feet wet with charting and basic analysis. But these tools almost always come with serious limitations, like delayed data, a very limited set of technical indicators, and scanners that are barely functional.
While they're useful for learning the ropes, these constraints make it tough to compete seriously. When you're trading for real, you need speed, accuracy, and advanced analytics. Investing in a professional-grade platform isn't a luxury—it's what you need to maintain a competitive edge.
Ready to move beyond the limitations of basic tools? ChartsWatcher provides the professional-grade scanning, backtesting, and modular dashboards you need to build and execute a winning strategy. Explore our powerful features and find the plan that fits your trading style at https://chartswatcher.com.
