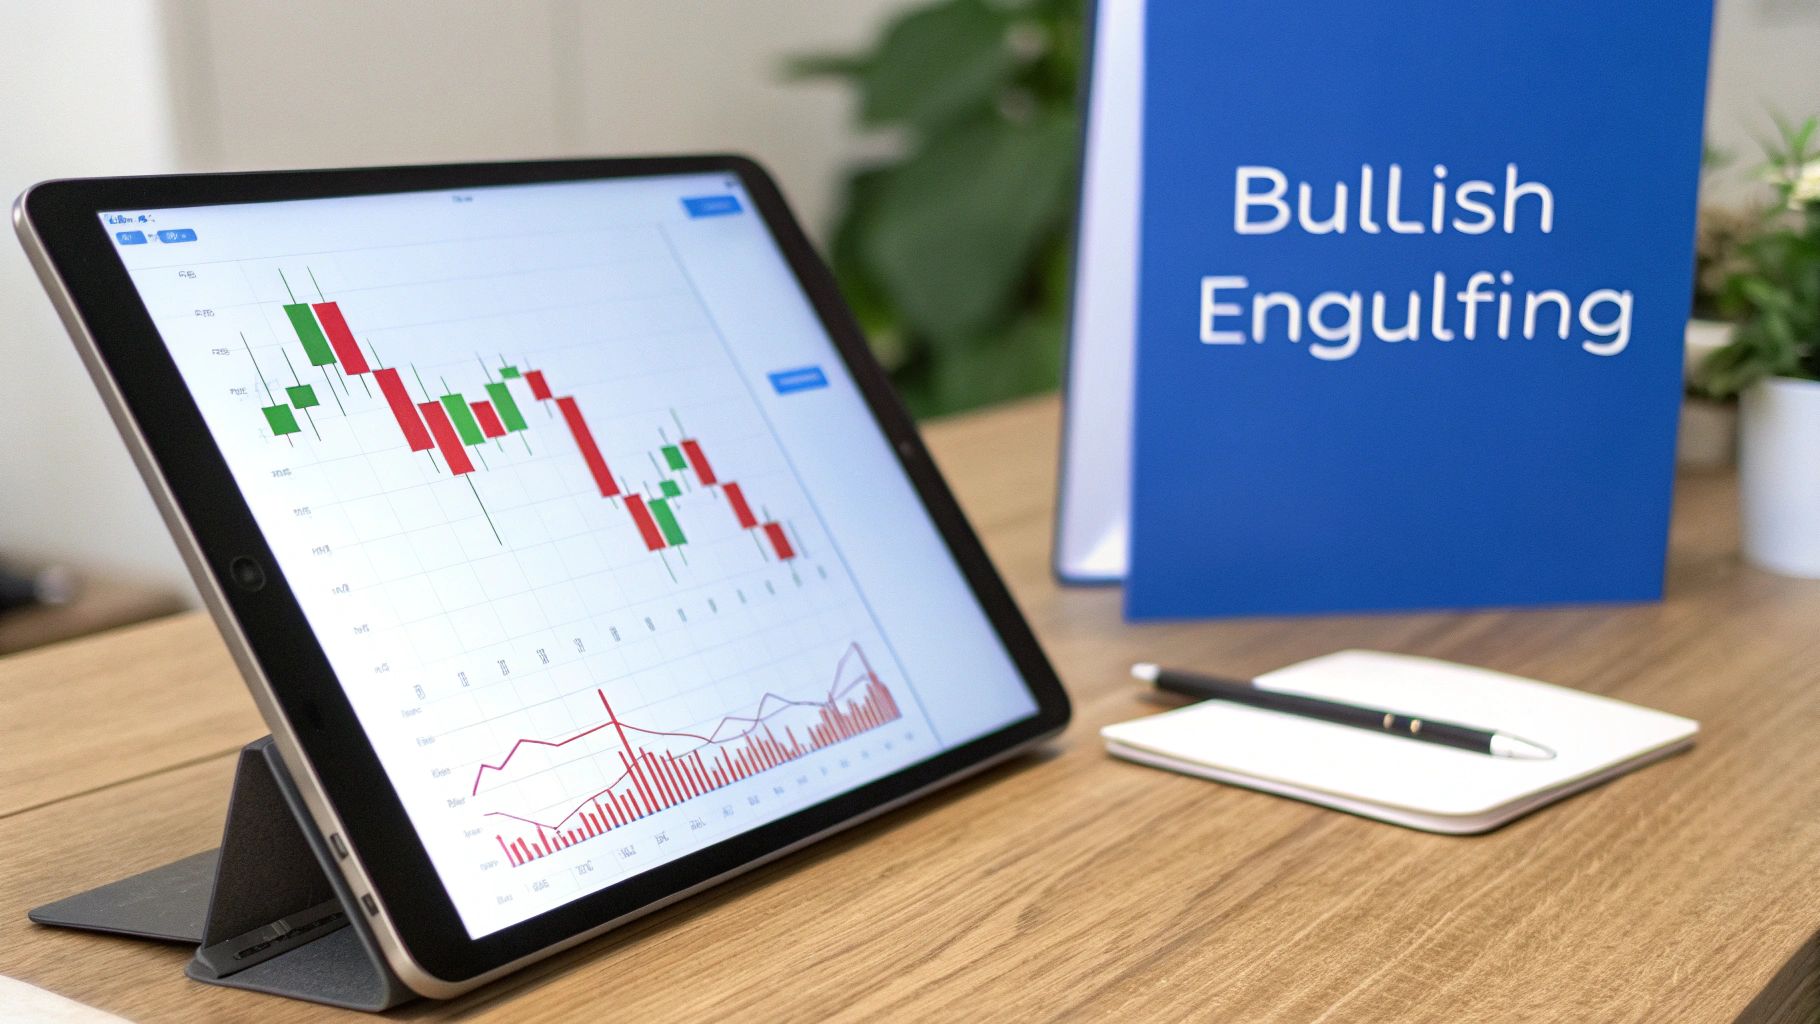
Engulfing Bullish Pattern: Master the engulfing bullish pattern
A bullish engulfing pattern is one of the most classic and visually powerful signals in a trader's toolkit. It’s a two-candle formation that can scream, "Hey, the trend is about to change!"
In simple terms, this pattern shows up when a big green (bullish) candle completely swallows or "engulfs" the entire body of the smaller red (bearish) candle that came right before it. When you see this, it’s a strong hint that the buyers have just stormed the field and completely overwhelmed the sellers, signaling a potential shift from a downtrend to an uptrend.
Decoding the Market's Power Shift
Think of it like a tug-of-war. The sellers (bears) have been winning, pulling the price down, leaving a trail of red candles. Then, one last, small red candle forms. The sellers are still in charge, but maybe they're getting a little tired.
Then, out of nowhere, the next candle opens lower but then explodes upward. This new, big green candle doesn't just stop the sellers—it completely reverses all their recent progress and then some, closing way above where the previous red candle even started. This dramatic takeover is exactly what the engulfing bullish pattern is telling you.
The Anatomy of the Signal
To really get this pattern right, you have to know its two key parts. Each candlestick tells a piece of the story, and their roles are crucial. (If you need a refresher on the basics, our guide on understanding candlestick charts for traders is a great place to start).
Here's the two-candle sequence broken down:
-
Candle 1 (The Bearish Setup): The first candle has to be red (bearish) and appear during a clear downtrend. Its size isn't super important, but its presence confirms the sellers were in control just before the big shift.
-
Candle 2 (The Bullish Takeover): This is the main event. It must be a green (bullish) candle, and its body—the thick part between its open and close price—has to completely cover the body of that first red candle.
This second candle is the visual proof of a decisive power shift. It opens near or even below the prior candle's close and then rallies hard to close above its open. That's a huge surge of buying pressure that not only erased the last session's losses but pushed prices even higher.
Key Takeaway: The bullish engulfing pattern isn't just a random shape on a chart. It’s a story of fading sellers getting crushed by a sudden flood of confident buyers.
Why This Pattern Matters to Traders
Traders love the bullish engulfing pattern because it’s often one of the first clear signs that a stock might be bottoming out. It suggests the downtrend has run out of gas and a new uptrend could be just around the corner.
This isn't just a technical fluke; it’s a map of market psychology. The small red candle shows sellers are losing steam or getting indecisive. The massive green candle that follows shows buyers are back with a vengeance. When you spot this pattern after a long slide, it can be a fantastic trigger for a long trade—though, as always, it's wise to look for a little more confirmation before jumping in.
To give you a quick reference, here are the essential details of the pattern in one place.
Bullish Engulfing Pattern At a Glance
| Characteristic | Description | What It Signals |
|---|---|---|
| Structure | A two-candle pattern appearing in a downtrend. | A potential trend reversal from bearish to bullish. |
| First Candle | A small bearish (red) candle. | Shows existing bearish momentum is weakening. |
| Second Candle | A large bullish (green) candle that "engulfs" the first. | A powerful surge in buying pressure overwhelming sellers. |
| Psychology | From seller exhaustion to buyer conviction. | A significant and sudden shift in market sentiment. |
| Ideal Location | At the bottom of a downtrend or near a support level. | Increases the probability of a successful reversal. |
This table helps distill the pattern down to its core elements, making it easier to spot and interpret in real-time market action.
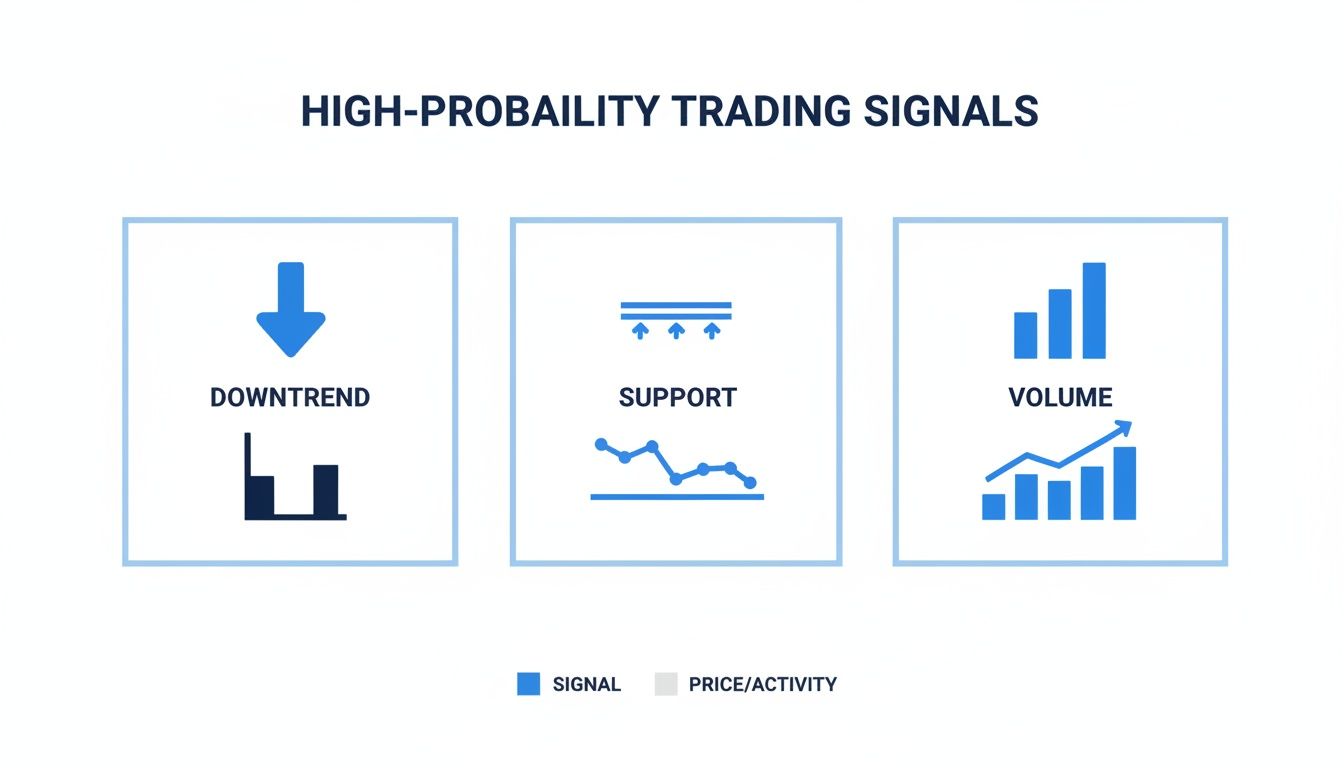
How to Spot a High-Probability Trading Signal
Seeing a bullish engulfing pattern pop up on your chart is a good start, but it's just that—a start. The hard truth is that not all of these patterns are created equal. Some are powerful signs of an impending reversal, ready to launch a new uptrend. Others? They're just market noise, perfectly designed to trap traders who jump the gun.
Learning to tell the difference is what separates consistently profitable traders from the rest. Think of the basic pattern as a single spark. That spark might just fizzle out. But if it lands in a pile of dry tinder, you get a roaring bonfire. For traders, that "tinder" is all about market context—the specific conditions that turn a simple pattern into a high-conviction setup.
Market Context is Everything
If you take only one thing away from this guide, let it be this: location matters more than anything else. The bullish engulfing pattern is a reversal signal. That means it must show up after a clear, sustained downtrend. When you see one form in the middle of choppy, sideways price action, it’s basically meaningless. Ignore it and move on.
Before you even consider a trade, ask yourself these two critical questions:
- Is there a real downtrend? Look for a classic series of lower highs and lower lows. The pattern is far more potent when it puts a stop to a period of relentless selling.
- How long has the stock been falling? A bullish engulfing that appears after a steep, multi-week decline carries a ton of weight. One that forms after a minor two-day pullback? Not so much.
A strong downtrend means sellers have been in charge for a while, and they're likely getting exhausted. The bullish engulfing acts like a final knockout punch, signaling that buyers have finally found the perfect moment to step in and seize control.
Adding Layers of Confirmation
Once you've confirmed the pattern showed up in the right place (after a downtrend), it's time to hunt for more evidence. Think of these confirming factors like a jury. Each piece of evidence adds more weight to the verdict that a reversal is about to happen. A setup with multiple confirmations is always the strongest.
Here are the three most important confirmations to look for:
-
A Spike in Trading Volume: This is a huge one. A big jump in volume on the day of the engulfing candle tells you the move has conviction. It shows that the buying pressure was backed by a flood of participation, which often means big institutions are getting involved. High volume is the fuel that powers a real trend reversal.
-
Formation at a Key Support Level: When a bullish engulfing pattern prints right on a major support level, its reliability goes through the roof. Support is an area on the chart where buyers have stepped in before. Seeing this pattern here signals that the historical floor is holding firm and buyers are actively defending their territory.
-
The Follow-Through Candle: The candle that forms after the pattern is your final piece of confirmation. You want to see strong follow-through—meaning the next candle closes above the high of the engulfing candle. This proves the newfound buying momentum wasn't a one-day fluke.
Trader's Insight: A high-probability setup is never about one pattern in isolation. It's about the confluence of factors: the pattern, its location, the volume, and the market's immediate reaction. The more of these align, the stronger your signal.
Backtested data on the bullish engulfing pattern really highlights its power in short-term trading. Under the right conditions, win rates can climb above 70%. This high success rate is most common when the pattern appears after 3 or more consecutive red candles, capturing powerful momentum shifts in major markets like U.S. equities or forex. You can explore more of these real-market observations over at altFINS.
By building a disciplined checklist that includes these elements, you can learn to filter out the weak signals and focus only on the setups that give you a true statistical edge. This is how you turn pattern trading from a guessing game into a methodical, repeatable strategy.
Understanding The Pattern’s Historical Performance
When we swap out eyeballing charts for hard numbers, the engulfing bullish pattern reveals its true worth. Decades of market data help us separate a fleeting candlestick shape from a signal with real muscle.
This isn’t about wishful thinking or gut feelings. It’s about building a trading edge you can measure and refine over time.
Key components for a high-probability setup include:
- An established downtrend
- A clear support level
- A notable uptick in volume
Quantifying The Statistical Edge
Numbers don’t lie. Studies by Thomas Bulkowski put the bullish engulfing pattern’s reversal success at 63% across major markets. That places it in the top quarter of over 100 candlestick formations.
While 63% isn’t a sure thing, it does tilt the scales in your favor when viewed over hundreds of trades.
A statistical edge doesn’t mean you win every trade; it means your overall returns should outpace your losses when you apply your rules consistently.
Let’s see how this pattern stacks up against a simple benchmark:
Statistical Edge of Bullish Engulfing vs Benchmarks
| Timeframe Post-Pattern | Bullish Engulfing Avg. Excess Return | Percentage of Positive Closes | Baseline S&P 500 Positive Closes |
|---|---|---|---|
| 1-Day | 0.35% | 63% | 55% |
| 5-Day | 1.20% | 68% | 57% |
| 10-Day | 2.50% | 70% | 59% |
These stats underline how the pattern consistently outperforms a blind S&P 500 entry over the same horizons.
From Raw Data To Actionable Strategy
Knowing the numbers is one thing. Turning them into a repeatable plan is another. A solid setup requires:
- Clear entry criteria
- Defined stop-loss placement
- Target projections aligned with your risk tolerance
To test the pattern under your own rules and markets, follow our backtesting framework. Dive into our backtesting guide for a step-by-step process.
Backtesting helps you answer questions like:
- Does the pattern shine on daily, weekly, or intraday charts?
- How much does a volume filter boost your win rate?
- What risk-to-reward ratios emerge from your chosen stops and targets?
If you’re curious how historical price data connects to future trends, you can master various time series forecasting methods. Armed with that insight, you’ll know not just that the engulfing pattern works, but how to make it work for you.
Building a Trading Strategy Step by Step
Spotting a bullish engulfing pattern is one thing; turning that insight into a repeatable, profitable trading plan is a completely different ballgame. A real strategy isn't just about finding the pattern. It's about having a rock-solid, mechanical process for every single step of the trade, from the moment you enter to the moment you exit. This framework is what separates disciplined trading from emotional guesswork.
Before you even think about risking a single dollar, you need to define three critical components: your entry trigger, your stop-loss, and your exit plan for taking profits. Without these, you're not really trading—you're just gambling on a pretty chart pattern.
A well-defined plan means you know exactly what to do when a setup appears, how you'll protect your capital if the trade turns sour, and precisely how you'll lock in gains when it goes your way.
Pinpointing Your Entry Trigger
The classic rookie mistake is jumping into a trade the second a bullish engulfing pattern closes. A much smarter approach is to wait for a little more confirmation that the buyers are actually in control. That small bit of patience can be the difference between a winning trade and a frustrating fake-out.
A popular and effective trigger is to wait for the price to break above the high of the engulfing candle. This simple action proves there’s follow-through momentum. It’s the market telling you that buyers aren't just showing up; they're strong enough to push the price past the pattern's peak, validating the reversal signal.
Let’s break down two common ways to enter:
-
The Aggressive Entry: You could enter the trade right at the market open of the very next candle. This gets you in early, but it also means you're taking on more risk because the upward move isn't fully confirmed yet.
-
The Confirmation Entry: A more conservative method is to place a buy-stop order just a few ticks above the high of the bullish engulfing candle. Your order only gets filled if the price shows the strength to push higher, giving you that extra layer of validation.
Most seasoned traders lean toward the second method. You might give up the first few cents of a move, but you gain a higher probability of being on the right side of the trade.
Defining Your Risk with a Stop-Loss
Let's be clear: no trading pattern works 100% of the time. The bullish engulfing pattern can and will fail. A failed pattern is simply when sellers wrestle back control and shove the price downward. Your stop-loss is your non-negotiable escape hatch that protects your capital when this happens.
The most logical place for your stop-loss is just below the low of the entire two-candle pattern. Why? Because that point represents the absolute bottom of the reversal attempt. If the price breaks below that level, the entire bullish idea is toast, and you need to get out immediately to cut the loss short.
Key Principle: A stop-loss isn't an admission of failure; it is a tool of professional risk management. It ensures that a single bad trade never wipes out your account, allowing you to survive and trade another day.
By setting your stop below the pattern's low, you give the trade enough breathing room to work without exposing yourself to a catastrophic loss.
Planning Your Exit to Take Profits
Just as crucial as your entry and stop-loss is your plan for taking profits. A winning trade is just a number on a screen until you actually close the position and bank the cash. Having a predetermined exit strategy is what keeps greed from turning a great trade into a breakeven or, even worse, a losing one.
Here are three practical ways to set your profit targets:
-
Targeting Key Resistance Levels: Look to the left on your chart. Where did the price struggle before? Identify old support levels that might now act as a ceiling, a major moving average, or a previous swing high. These are natural places where sellers are likely to show up again.
-
Using a Fixed Risk-to-Reward Ratio: This is a pure discipline play. Aim for a profit that's a multiple of your risk. For instance, if your stop-loss is $1 away from your entry, you could set your first profit target $2 above your entry. That’s a clean 2:1 risk-to-reward ratio.
-
Employing a Trailing Stop: For those trades that catch a powerful wave of momentum, a trailing stop-loss is your best friend. It automatically moves up as the price rises, locking in profits while still giving the trade room to run. This is how you can potentially turn a good trade into a massive winner.
Finding Trading Opportunities with Automation
Let's be honest: clicking through hundreds of charts every day is a one-way ticket to burnout. You're guaranteed to miss great setups, and your eyes will glaze over sooner or later. This is where automation becomes a trader's best friend.
Instead of hunting for the engulfing bullish pattern one chart at a time, you can teach a machine to do the heavy lifting. You define the rules, and it serves up only the highest-quality setups that meet your exact criteria.
This changes your role entirely. You stop being a searcher and become an analyst. All your energy can now go into what actually matters: validating the signal, managing the risk, and executing the trade like a pro. Tools like ChartsWatcher are built for this very purpose, acting as a tireless assistant that never gets distracted.
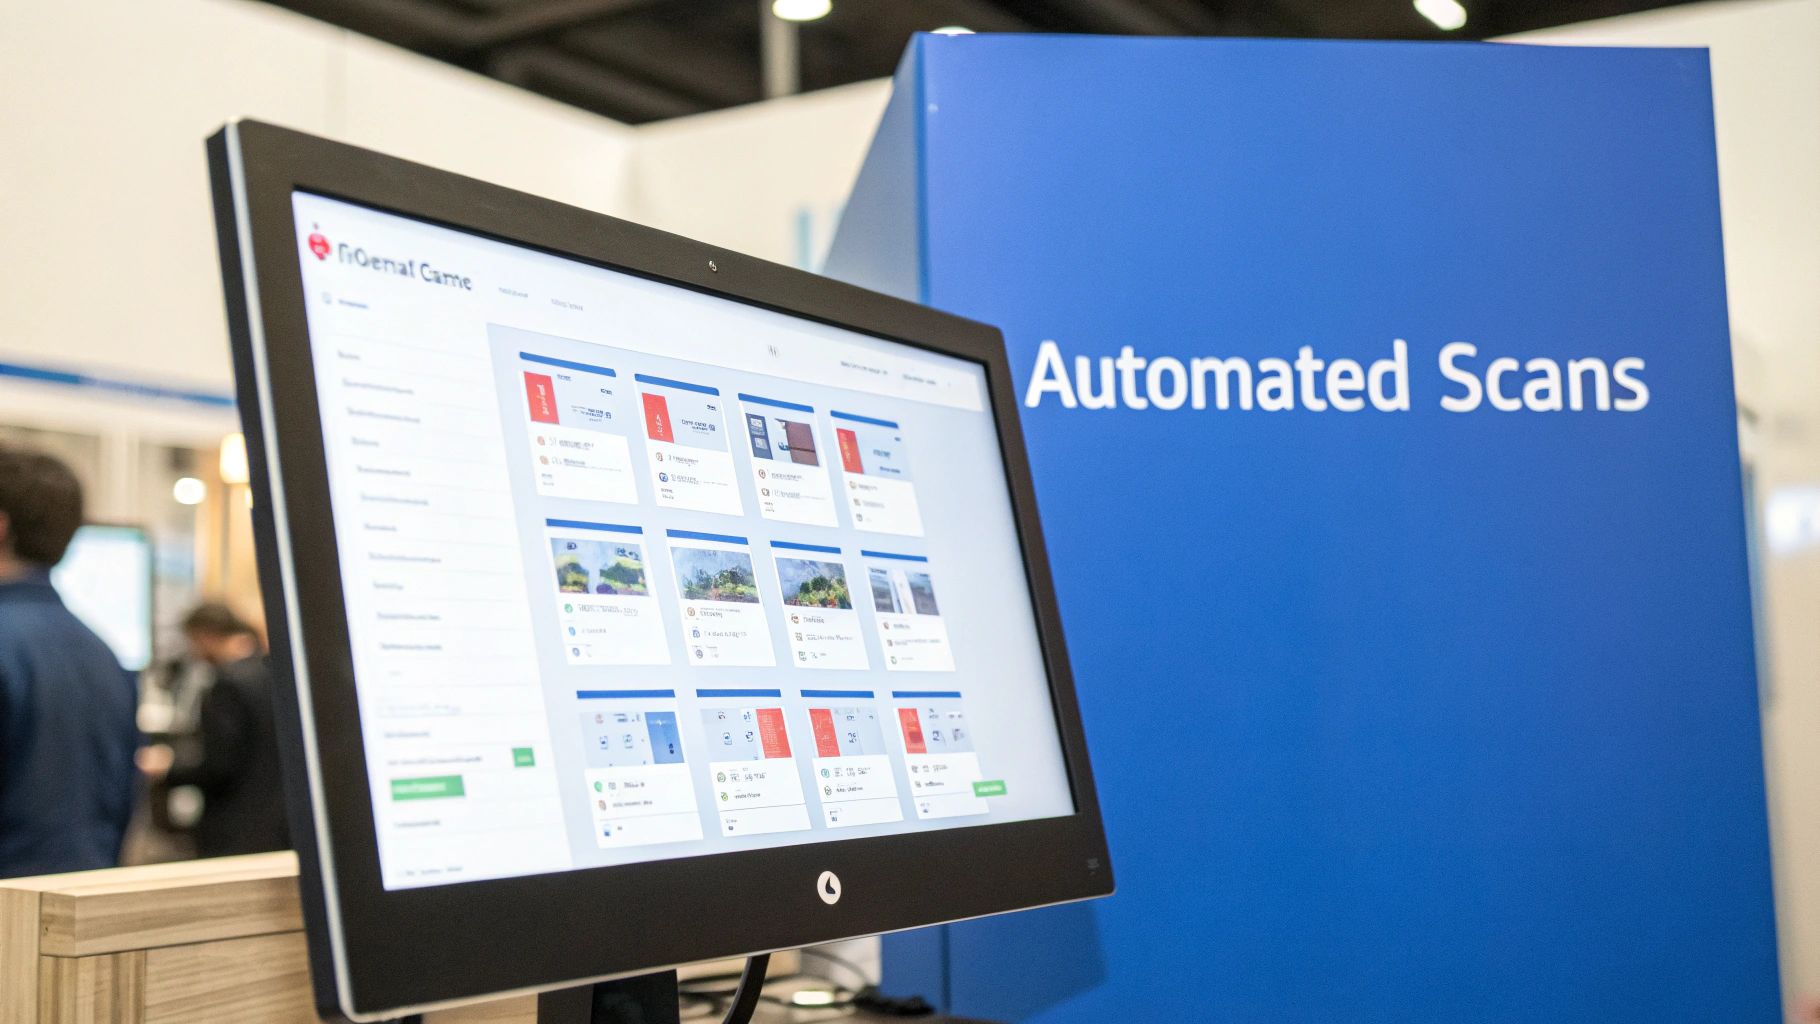
A good dashboard, like the one pictured, consolidates all these potential trades in one place. It brings the opportunities directly to you, making sure you never miss a pattern that fits your playbook.
Building Your Custom Engulfing Scan
A powerful scan is all about being specific. You're not just telling the software "find me a bullish engulfing candle." You're telling it to find the exact kind of bullish engulfing setup that has the highest odds of success, based on all the confirmation signals we've already covered.
Think of it like building a recipe for your ideal A+ trade. Here’s how you could set up a potent scan in a platform like ChartsWatcher:
- Define the Core Pattern: This is your base ingredient. The first and most obvious filter is for the "Bullish Engulfing" candlestick pattern itself.
- Add a Downtrend Filter: This is non-negotiable. For the pattern to signal a real reversal, the stock needs to be coming from a downtrend. You could define this as the price trading below its 20-day moving average, or making a series of lower lows over the past 10 sessions.
- Incorporate a Volume Spike: A reversal needs fuel in the tank. Add a filter requiring volume on the engulfing day to be significantly higher than average. A solid starting point is to demand volume be at least 150% of its 20-day average.
- Set Market and Price Conditions: Finally, narrow your universe. Filter for specific exchanges like NASDAQ or NYSE, set a minimum daily trading volume to ensure liquidity, and define a price range that fits your account size (e.g., stocks over $10).
This multi-layered approach cuts through the market noise, leaving you with a clean, actionable list of candidates that are actually worth your time.
Setting Up Real-Time Alerts
A scan gives you a list of stocks right now. An alert tells you the instant a setup appears. This is a game-changer if you can't be glued to your screen all day.
You can configure your scanning software to shoot you a push notification, email, or sound the moment a stock on your watchlist forms a bullish engulfing pattern that checks all your boxes.
Key Advantage: Automation strips emotion and inconsistency out of your search process. A scanner follows your rules to the letter, every single time, without bias or fatigue. It ensures you only see the setups that align with your proven strategy.
For traders looking to get even more advanced, the world of AI is opening up new doors. For instance, some are exploring creating custom GPTs for analysis to automate pattern detection even further.
The power of this approach is backed by hard data. Statistical studies of the bullish engulfing on the S&P 500 index confirm its edge, especially when you add filters. One data-driven review looking at 50 years of weekly S&P 500 bars found that basic engulfing reversals led to a +0.46% excess return a month later, with prices being higher 68.1% of the time after 30 days. Automating your search allows you to systematically hunt for these statistical advantages across the entire market.
Common Questions About the Bullish Engulfing Pattern
Even after you get the hang of the basics, some practical questions always pop up when you try to trade the bullish engulfing pattern. Working through these nuances is what builds confidence and, eventually, consistency. This section is designed to tackle the most common sticking points head-on.
Think of this as your go-to FAQ for refining your approach. We'll cover how reliable the pattern really is, which timeframes make the most sense, what to do when a signal goes wrong, and how it stacks up against similar candlestick formations.
How Reliable Is the Bullish Engulfing Pattern on Its Own?
Let's get one thing straight: trading this pattern in a vacuum is a recipe for disaster. While some studies suggest the bullish engulfing pattern has a historical success rate of around 63% as a standalone reversal signal, its real power is unlocked only when other factors back it up.
Think of the pattern as a compelling opening argument in a courtroom, not the final verdict.
The most reliable signals show up when the pattern forms at a major area of support. This isn't just a random price level; it's a historical battleground where buyers have proven they're willing to step in. Look for these patterns at horizontal support lines, major moving averages (like the 50-day or 200-day), or key Fibonacci retracement levels.
On top of that, look for a noticeable spike in trading volume on the day the engulfing candle forms. This is a huge clue. It suggests strong institutional buying is fueling the reversal, giving the move a heck of a lot more credibility. Always check the bigger picture, too—a bullish engulfing in a raging bear market might just be a temporary bounce, but one in a correcting bull market could signal the primary uptrend is ready to resume.
What Timeframe Works Best for Trading This Pattern?
The bullish engulfing pattern is fractal. That’s a fancy way of saying it appears on every timeframe, from a 1-minute chart all the way up to a monthly one. But while the pattern looks the same, its significance changes dramatically depending on the chart you’re watching.
-
Lower Timeframes (e.g., 1-minute, 15-minute): You'll see this pattern constantly, but it's swimming in market "noise." This leads to a much higher rate of false signals. Day traders and scalpers might use these for quick, tactical entries, but they require extreme discipline.
-
Higher Timeframes (e.g., Daily, Weekly): On these charts, the pattern is far less common, but each appearance carries much more weight. A weekly bullish engulfing candle at a critical support level can signal a major trend change that could play out over weeks or even months.
The "best" timeframe is entirely dependent on your personal trading style. A long-term investor might focus exclusively on weekly charts, whereas a swing trader will likely find the most utility on the daily and 4-hour charts.
What Should I Do If a Bullish Engulfing Pattern Fails?
No pattern is foolproof. The bullish engulfing will fail, and you need a plan for when it does. A failure is pretty easy to define: the price breaks below the low of the engulfing candle instead of moving higher. When this happens, it's a crystal-clear sign that the initial buying pressure fizzled out and sellers have wrestled back control.
This is precisely why disciplined risk management is non-negotiable.
Your stop-loss order should always be placed at a logical point before you even enter the trade. The most common and effective spot is just a few ticks below the absolute low of the two-candle pattern.
If your stop-loss gets hit, the trade setup is officially invalidated. The only correct response is to exit the position immediately to protect your capital. A failed pattern is valuable market information—it tells you that bearish sentiment is still dominant. Acknowledge the signal, take the small, managed loss, and move on to the next opportunity.
How Does This Pattern Differ from a Bullish Piercing?
Both the bullish engulfing and the bullish piercing are two-candlestick reversal patterns that show up in a downtrend. They both signal buyers are stepping in, but they communicate different degrees of buying intensity. The key difference is how much of the previous candle's loss the second candle manages to recover.
| Feature | Bullish Engulfing Pattern | Bullish Piercing Pattern |
|---|---|---|
| Buying Power | Very Strong. Buyers completely overwhelmed and "engulfed" the sellers. | Moderately Strong. Buyers showed a significant comeback but didn't take full control. |
| Second Candle | Opens lower than the prior close and closes above the prior day's open. | Opens lower than the prior close and closes above the midpoint of the prior body. |
| Signal Strength | Generally considered a stronger, more decisive reversal signal. | Still a valid bullish signal, but shows less conviction than an engulfing pattern. |
Simply put, the engulfing pattern shows a total rout of the sellers. The piercing pattern shows that buyers made a strong comeback but didn't achieve the same complete takeover. Because of this, most traders see the bullish engulfing as the more powerful and reliable of the two signals.
Ready to stop hunting for setups and start analyzing them? ChartsWatcher provides the powerful, real-time scanning tools you need to find high-probability bullish engulfing patterns across the market automatically. Build your custom scans and get instant alerts so you never miss an opportunity. Discover a smarter way to trade at https://chartswatcher.com.
