Cup and Handle Stocks: Master Trading This Powerful Pattern
The Anatomy of Cup and Handle Stocks

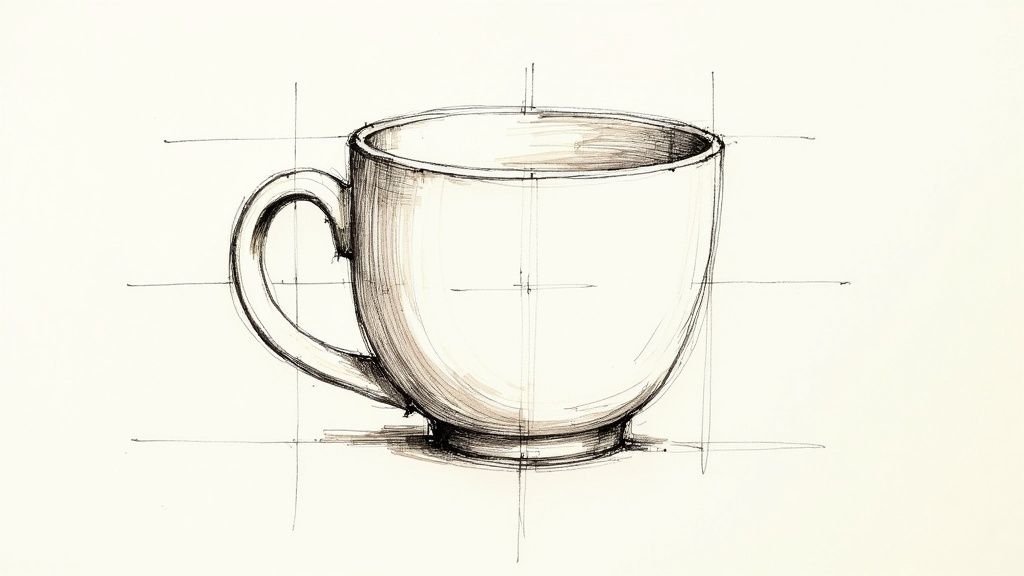
The cup and handle pattern is a classic chart formation that traders use to spot potential breakouts in stock prices. Resembling its name, this pattern provides a visual way to understand market dynamics and find promising investment opportunities. Understanding its parts is the first step to using it effectively in your trading strategy.
Deconstructing the "Cup"
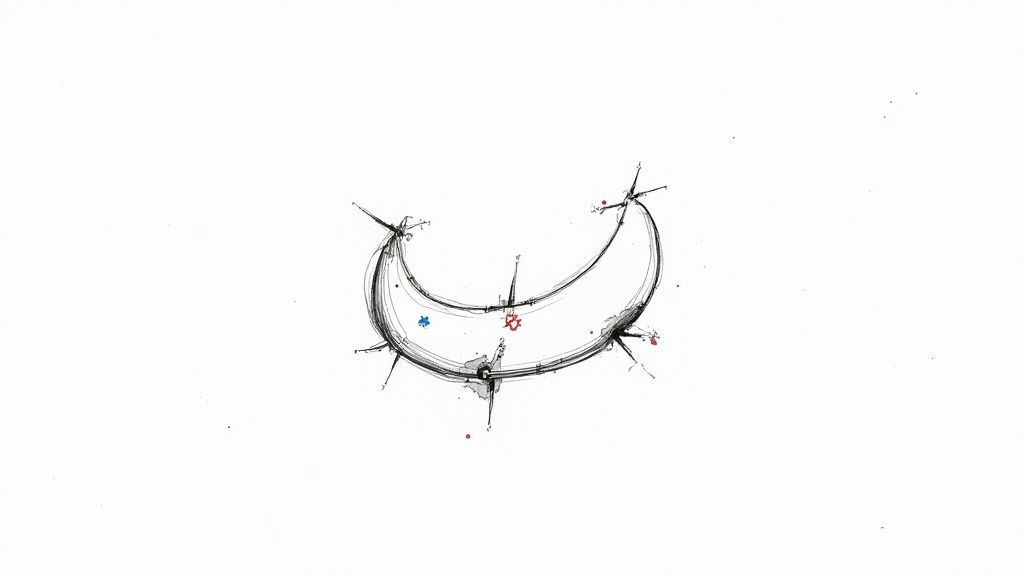
The "cup" part of the pattern has a U-shape. This shows a price decline followed by a gradual recovery. The bottom of the U should be rounded, not a sharp V. A rounded bottom suggests a sustainable and less volatile shift in market sentiment.
This phase usually lasts one to six months. However, sometimes it takes longer, especially on long-term charts. This period can be seen as a time when weaker investors are shaken out, preparing the stock for the next upward move.
The Significance of the "Handle"
After the cup forms, the "handle" appears as a period of consolidation or a slight pullback. This downward or sideways movement is a short pause before the expected breakout. The handle usually forms over one to four weeks. This lets the stock build momentum before a potential surge.
A key feature of a good handle is its depth. It should generally stay above the 50% Fibonacci retracement level of the cup's depth.
The cup and handle pattern is a well-known bullish continuation pattern in technical analysis. It often leads to continued upward trends. It has two main phases: a U-shaped 'cup' and a downward-sloping 'handle'. The pattern's success rate gets better over time. Baseline success is about 49%, rising to 70% over one year, 80% over five years, and even 85% over ten years. This pattern works particularly well when it aligns with broader market trends and strong volume during breakouts. Learn more: Cup and Handle Pattern Success Rates Explained. This continued uptrend makes it attractive for long-term investors.
Why This Pattern Works
The cup and handle formation reflects changes in market psychology. The initial decline creates the cup as investors sell. But the recovery shows renewed buying interest. The handle represents a last wave of selling before the breakout. This signals a shift in momentum to the buyers. Understanding these shifts is key to using this pattern: Cup and Handle Pattern Master Class for Strategic Traders.
What History Reveals About Cup and Handle Performance

Beyond simply recognizing the cup and handle pattern in stocks, smart traders analyze its historical performance. This involves examining how these patterns have performed in real market conditions. This analysis is vital for establishing realistic expectations and improving trading strategies.
Unpacking the Data Behind Cup and Handle Success
A key aspect of evaluating any trading pattern is understanding its success rate. While no pattern guarantees profits, the cup and handle formation has a respectable track record. This doesn't mean jumping into any trade that looks like the pattern. A deep understanding of historical performance is essential.
For example, one study of 391 cup and handle formations across 500 stocks between 1991 and 1996 provided valuable insights. The study indicated that while 302 formations resulted in consolidations, 89 led to reversals. This represents a 26% failure rate, which could be reduced to 10% by waiting for a confirmed upside breakout. Successful formations saw an average price increase of 38%, with most gains between 10% and 20%.
To further your understanding of cup and handle trading strategies, you can refer to resources like Cup and Handle Trading Strategy. This highlights the balance between profit potential and the need for careful risk management.
Let's summarize these findings in a table:
Cup and Handle Pattern Performance Statistics Statistical breakdown of cup and handle pattern performance based on historical studies.
| Metric | Performance Value | Notes |
|---|---|---|
| Total Formations Studied | 391 | Across 500 stocks between 1991 and 1996 |
| Consolidations | 302 | Indicating sideways price movement |
| Reversals | 89 | Representing failed patterns |
| Initial Failure Rate | 26% | Based on the number of reversals |
| Failure Rate After Breakout | 10% | Reduced by waiting for confirmation of an upward trend |
| Average Gain (Success) | 38% | For formations that successfully broke out to the upside |
| Typical Gain Range | 10%-20% | Representing the most common range of price increases after a breakout |
These statistics offer valuable context for understanding the potential of the cup and handle pattern. While the average gain is impressive, the failure rate underscores the importance of waiting for confirmation before entering a trade.
Performance Across Different Market Conditions
Just like individual stocks, cup and handle patterns perform differently under varying market conditions. Bull markets, with their optimism and rising prices, tend to be more favorable. However, bear markets, marked by pessimism and falling prices, can significantly affect the pattern's reliability. Understanding these market dynamics is crucial.
Moreover, the success of these patterns is not uniform across sectors and market capitalizations. Some sectors might show a higher frequency of these patterns or experience stronger breakouts than others. The pattern's performance can also differ between large-cap, mid-cap, and small-cap stocks.
Duration and Target Achievement
Another factor to consider is the typical duration from breakout to target achievement. Understanding the average timeframe helps traders manage expectations and plan exits strategically. This requires analyzing historical data to determine the average time it takes for the pattern to reach its projected price target.
By studying historical performance, traders gain valuable insights into the potential and limitations of cup and handle patterns. This knowledge supports informed decision-making, leading to a more strategic and potentially more profitable trading approach.
Identifying High-Probability Cup and Handle Setups

Not all cup and handle patterns are created equal. Some offer a much higher chance of success. Understanding what separates winning trades from the rest is key. By recognizing these subtle differences, you can improve your stock selection and focus on those with the greatest potential.
Ideal Cup and Handle Characteristics
The cup should look like a "U," not a "V." A rounded bottom shows a slower, more sustainable change in how the market feels about a stock. The depth of the cup also matters. A deeper cup often means stronger support, which could lead to a more significant price increase.
The handle is where the stock consolidates before a potential breakout, offering a lower-risk entry. Ideally, it slopes slightly downward or sideways. Think of it as a final test, shaking out investors who are less committed. The handle's position is critical. It should ideally stay above the 50% Fibonacci retracement level of the cup's depth. This shows buyers are still in control.
The cup and handle pattern has a rich history, notably analyzed by William J. O'Neil in his 1988 book How to Make Money in Stocks. Investopedia provides further insights into cup and handle patterns. O'Neil highlighted the pattern as a reliable indicator, especially when a stock retests previous highs and faces selling pressure before moving higher. The pattern's reliability improves when the handle stays above that 50% Fibonacci level.
Volume and Market Context
Volume patterns offer helpful confirmation. Look for decreasing volume as the cup forms, then increasing volume during the handle's formation, especially at the breakout. This jump in volume indicates strong buying interest and validates the breakout's potential.
The overall market also plays a role. A strong market can boost the success of this pattern, while a weak market can hinder it. Sector trends are just as important. A cup and handle in a leading sector is more likely to succeed than one in a lagging sector.
Subtle Clues of Institutional Involvement
While not always obvious, institutional investors can heavily influence a cup and handle pattern's success. Steady buying pressure and increasing volume on up days can point to institutional accumulation, often preceding significant breakouts. These clues aren't always easy to spot, but they can add extra confidence to your setup evaluation.
By understanding these nuances – volume dynamics, market conditions, and even hints of institutional activity – you can choose cup and handle patterns with a higher probability of success. It's about looking beyond the basic shape and digging deeper.
Profitable Strategies for Trading Cup and Handle Stocks

Identifying a promising cup and handle pattern is just the first step. To truly capitalize on this pattern's potential, you need a robust trading strategy. This means understanding optimal entry and exit points, setting appropriate stop-losses, and effectively managing your positions.
Mastering Entry and Exit Techniques
Timing your entry is crucial when trading cup and handle stocks. Ideally, wait for the handle to complete its consolidation before entering. This minimizes the risk of a false breakout, where the price temporarily breaks out but then retreats. The optimal entry point is typically a decisive break above the handle's resistance line, signaling a renewed upward trend. For more on breakout strategies, check out this resource: Breakout Trading Strategy to Maximize Gains.
Knowing when to exit is just as important. Several methods exist for determining profit targets. One common approach measures the cup's depth from its lowest point to the high before the handle. This distance is then projected upwards from the breakout point to estimate the potential target. Alternatively, use key resistance levels above the breakout as profit targets.
When trading this pattern, clear entry and exit points are essential. Wait for the handle's pullback to finish, looking for a buy signal as the stock breaks out. Enter with a tight stop-loss, aiming for profits either at the previous swing's high or at resistance levels above. The pattern's attractive 2.5:1 return-to-risk ratio can generate consistent gains, even with a 49% baseline success rate. Learn more here: Cup and Handle Chart Patterns.
Stop-Loss Placement and Position Sizing
A well-defined stop-loss order is crucial for managing risk. For cup and handle stocks, place the stop-loss slightly below the handle's lowest point. This protects your capital if the breakout fails. The exact placement depends on your risk tolerance and the stock's volatility.
Position sizing is another vital risk management element. This determines the appropriate capital for each trade. Oversizing can lead to substantial losses, while undersizing limits potential profits. A balanced approach considers your risk tolerance, account size, and the trade's potential reward.
Aggressive vs. Conservative Approaches
Traders have varying risk appetites. Aggressive traders might enter earlier, during handle formation, aiming for a larger price move but accepting a higher false breakout risk. Conservative traders might wait for a confirmed breakout above the handle's resistance, reducing risk but potentially sacrificing some profit.
Managing Winning Positions and Psychological Challenges
Managing winning positions involves adjusting your stop-loss as the price moves favorably to lock in profits and protect against reversals. Consider taking partial profits at predetermined levels to reduce risk exposure. Trading psychology plays a vital role. Patience is key, as pattern development and breakouts take time. Discipline is essential for sticking to your trading plan and avoiding impulsive decisions.
To help illustrate different trading strategies, let's look at a comparison table:
The following table compares different approaches for trading cup and handle stocks:
| Strategy Type | Entry Method | Stop Placement | Target Setting | Best For |
|---|---|---|---|---|
| Aggressive | During handle formation | Below the low of the most recent price swing within the handle | Projecting cup depth from breakout or next resistance level | Traders with higher risk tolerance seeking larger moves |
| Conservative | Confirmed breakout above handle resistance | Below the low of the handle | Projecting cup depth from breakout or next resistance level | Traders prioritizing risk mitigation over maximizing gains |
| Moderate | Breakout above handle resistance with increasing volume | Slightly below the low of the handle or recent price swing | Combination of cup depth projection and technical indicators | Balancing risk and reward |
This table highlights the key differences in entry, stop placement, and target setting based on the trader's risk profile. While the target setting methods are similar, the entry and stop placement vary significantly between aggressive and conservative approaches. Choosing the right strategy depends on your individual risk tolerance and trading style.
Amplifying Results With Powerful Technical Indicators
The cup and handle pattern offers valuable trading insights. However, combining it with other technical indicators can significantly boost your trading accuracy. Think of the cup and handle as a solid starting point. Adding other tools helps confirm and strengthen your trading decisions. This combined approach creates more robust trade setups and helps you sidestep potential losses.
The Power of Confluence: Combining Indicators for Better Results
Relying on a single indicator, even one as reliable as the cup and handle, can be risky. Look for confirmation from other indicators. For example, when several indicators simultaneously suggest a buy signal, the likelihood of a successful trade increases. This multi-layered approach, using indicators together, helps filter out misleading signals and increases confidence in your analysis.
Moving Averages: Smoothing Out the Noise
Moving averages smooth out price fluctuations, revealing the underlying trend. When analyzing cup and handle stocks, check if the price is above key moving averages, such as the 50-day and 200-day moving averages, during the handle's formation. This suggests underlying bullish momentum, supporting a potential breakout.
Momentum Indicators: Gauging the Strength of a Move
Momentum indicators, like the Relative Strength Index (RSI), help determine if a stock is overbought or oversold. Ideally, as the handle forms, you want a moderate RSI, preferably below 70. This indicates the stock has potential for further gains after the breakout, preventing you from entering a trade when upward momentum might be fading. The Moving Average Convergence Divergence (MACD) can also identify momentum shifts, potentially confirming the breakout with a bullish crossover.
Volume Analysis: A Critical Confirmation Tool
Volume is essential for validating cup and handle breakouts. A volume surge as the price breaks above the handle's resistance confirms strong buying pressure. Low volume during a breakout can signal a lack of conviction and a higher chance of a false breakout. Therefore, volume analysis is crucial for any effective cup and handle trading strategy.
Avoiding Indicator Redundancy
While multiple indicators are helpful, avoid indicator redundancy. Select indicators that measure different aspects of market behavior—trend, momentum, and volume—for a more comprehensive view. Using too many indicators that convey the same information can create false confidence and overly complicated charts. Strive for a balanced approach, maximizing insights without unnecessary complexity. By using a few key, non-redundant indicators alongside the cup and handle pattern, you improve your ability to spot high-probability setups and make better trading decisions.
Avoiding Costly Mistakes in Cup and Handle Trading
Even seasoned traders can sometimes find cup and handle stocks tricky. Understanding common pitfalls is crucial for protecting your capital and maximizing your chances of success. This section explores those potential traps and offers practical guidance to help you avoid them.
The Perils of Premature Entry
One of the most frequent mistakes is entering a trade before the cup and handle pattern fully forms. Jumping in too early, before the handle finishes its consolidation and a confirmed breakout occurs, exposes you to the risk of a false breakout. This happens when the price briefly moves past the handle's resistance but quickly falls back, triggering stop-loss orders and causing unnecessary losses. Patience is key; wait for the pattern to completely develop before investing.
Misidentifying Patterns: A Recipe for Disaster
Another common error is incorrectly identifying cup and handle formations. Not every price dip and subsequent recovery is a genuine cup and handle. Variations exist, such as the cup and odd handle, which has a more erratic and volatile handle. Misinterpreting these variations can lead to poor trade choices and lower returns. Develop a keen eye for the pattern's key features, including a well-defined "U"-shaped cup, a proper handle formation, and appropriate volume confirmation.
Ignoring the Broader Market Context
Even a perfectly formed cup and handle can fail if the broader market is unfavorable. Ignoring market trends and sector performance is a costly mistake. A strong overall market can boost the pattern's success, while a weak or bearish market can undermine even the most promising setups. Always consider the market's overall health and the specific sector's performance before entering a trade. For example, a cup and handle forming in a struggling sector is less likely to succeed than one in a thriving sector.
Navigating the Psychological Challenges
Cup and handle trading presents unique psychological challenges. The frustration of false breakouts can tempt traders to give up on their strategy. The excitement of a potential breakout can lead to impulsive choices, like chasing prices or neglecting proper risk management. Developing patience, discipline, and emotional control are vital for navigating these challenges and sticking to your trading plan.
Practical Risk Management Techniques
Effective risk management is essential for cup and handle trading. Using appropriate stop-loss orders is key. Placing a stop-loss just below the handle's lowest point limits potential losses if the trade doesn't work out. Proper position sizing is equally important. Over-allocating capital to a single trade can magnify losses, while under-allocating limits potential gains. A balanced approach, suited to your risk tolerance and account size, is crucial for long-term success.
Ready to improve your trading with powerful charting tools and real-time market analysis? Visit ChartsWatcher today and discover how our platform can help you identify profitable cup and handle setups and much more: ChartsWatcher - Empowering Traders

