Cup and Handle Pattern: Master Class for Strategic Traders
The Psychology Behind Cup and Handle Patterns
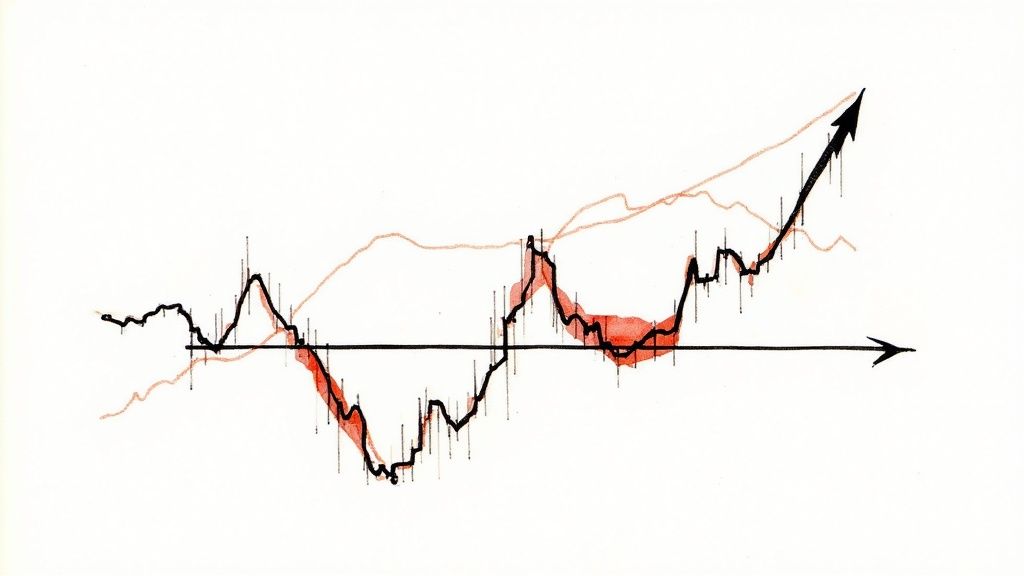
The cup and handle pattern isn't just an interesting chart formation - it reveals fascinating market psychology at work. Named for its distinctive shape, this pattern shows the emotional journey of market participants, from initial selling to accumulation and finally a bullish breakout. Getting inside the minds of traders during this pattern can significantly improve your trading results.
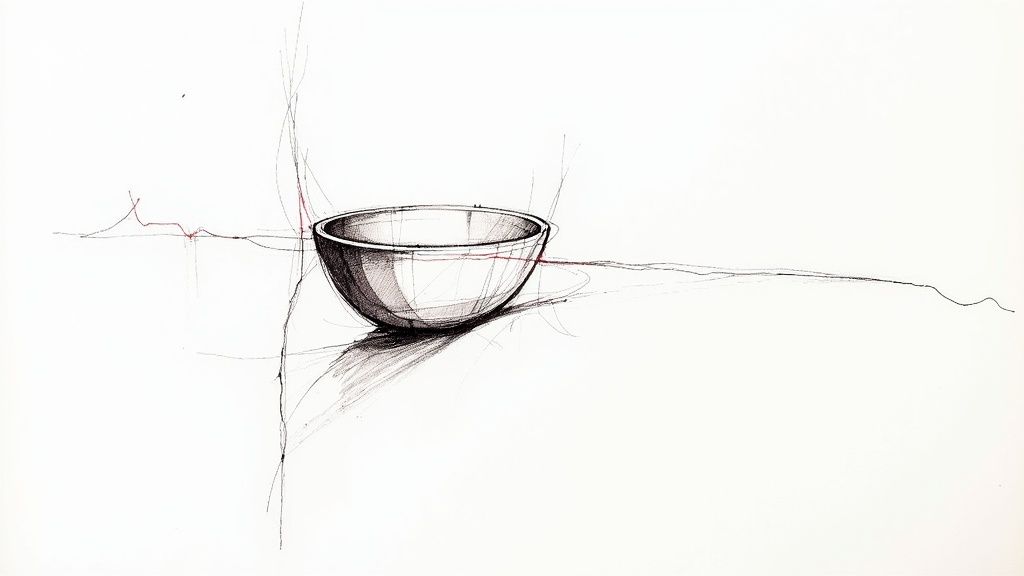
Decoding the Cup
The "cup" formation begins with a period of profit-taking and consolidation. As prices climb, early investors start selling to lock in gains, creating the initial dip. This decline attracts value-focused buyers and institutional investors who recognize an opportunity to accumulate shares at lower prices. This gradual shift from selling to buying creates the rounded bottom. The rise back to the original price level shows returning confidence as buyers regain control.
The Handle's Significance
The "handle" that forms after the cup serves a critical purpose. It represents a final shakeout of nervous investors and a short-term consolidation before the anticipated breakout. This brief pause lets the stock build the necessary foundation for a sustained move higher. The handle typically forms a flag or pennant pattern, reinforcing the idea of a temporary pause before continuation. The cup and handle pattern is a well-known bullish continuation pattern used in technical analysis to predict potential price increases. It consists of a rounded 'cup' followed by a 'handle,' which is a smaller consolidation period. This pattern typically forms during an upward trend and signals that the stock price may rise further after its completion. Learn more about the cup and handle pattern here: Cup and Handle Pattern Explained
Volume Dynamics: A Crucial Indicator
Paying attention to volume during cup and handle formation is essential for confirmation. Ideally, volume should decrease as the cup forms, showing diminishing selling pressure. During the handle, trading volume should remain relatively light, indicating most sellers have already exited. The breakout from the handle should come with a significant surge in volume, confirming strong buyer interest. This volume spike represents the final wave of buyers jumping in, pushing prices higher.
Variations and Reliability
Cup and handle patterns appear across various markets - stocks, cryptocurrencies, and forex alike. While the psychological principles remain the same, the pattern's specific characteristics vary depending on the asset and market conditions. Remember that this is primarily a continuation pattern, meaning it works best during existing uptrends. In choppy or downtrending markets, its predictive power decreases substantially. This highlights why you should always combine this pattern with other technical indicators and broader market analysis before making trading decisions. Understanding these nuances helps you avoid misinterpreting the pattern and improves your chances of successful trades.
Spotting High-Probability Cup and Handle Setups
Not every cup and handle pattern guarantees price growth. Identifying high-probability setups means recognizing specific traits that separate them from weaker formations. This requires careful examination of the cup's depth, handle length, and most importantly, the volume patterns that accompany the formation.
Analyzing the Cup
The best cups form a "U" shape rather than a "V" shape. This rounded bottom indicates a healthy period of consolidation where buying gradually overcomes selling. Ideally, the cup's depth should retrace 30-50% from the previous high. When cups are too deep, they often signal weakness and may lead to failed breakouts. Conversely, cups that are too shallow might not represent enough consolidation. For example, a stock that peaks at $100, drops to $70, and then recovers has formed an ideal cup with a 30% retracement.
Deciphering the Handle
The handle serves as the final shakeout before the expected breakout. It should typically last 1/3 to 1/4 of the cup's timeframe. Shorter handles often signal stronger upcoming moves, while handles that drag on too long can lead to fading momentum. The best handles form a flag or pennant pattern, which represents a brief pause before the trend continues. You might be interested in: How to master other chart patterns to improve your handle analysis skills.
The Importance of Volume
Volume behavior is critical for confirming valid cup and handle patterns. As the cup forms, volume should gradually decrease, showing that selling pressure is waning. During handle formation, volume should remain relatively low and quiet. However, when the price breaks out above the handle, a significant volume surge should occur, confirming real buyer interest and suggesting a higher probability of a successful trade.
Putting It All Together: A Checklist
Before trading any cup and handle pattern, use this comprehensive checklist to verify its authenticity:
| Pattern Component | Ideal Characteristics | Warning Signs |
|---|---|---|
| Cup | "U" shape, 30-50% retracement | "V" shape, >50% retracement, <30% retracement |
| Handle | 1/3 to 1/4 of cup's timeframe, flag or pennant pattern, decreasing volume | Overly long duration, increasing volume, no clear pattern |
| Breakout | Significant volume surge | Weak volume, breakout fails to hold |
By thoroughly examining these elements, traders can spot and act on the most promising cup and handle patterns across all markets and timeframes. This careful approach helps avoid common mistakes and boosts success rates. Remember that even textbook patterns sometimes fail, which underscores why strong confirmation signals are essential before entering any trade.
The Hard Data: Cup and Handle Performance Metrics
Looking beyond theory, let's examine the actual numbers behind the cup and handle pattern. By analyzing real backtesting results and trading outcomes, we can see how this pattern truly performs in different market situations. This fact-based approach gives us solid insights into how reliable the pattern is and helps traders make better decisions.
Success Rates and Market Conditions
The cup and handle pattern shows different success rates depending on market conditions. During established uptrends, the pattern achieves an impressive 85% success rate. This rate drops significantly in choppy or sideways markets, highlighting why you need to pay attention to the broader market when using this pattern. For instance, a cup and handle forming during a strong bull market is much more likely to succeed than one appearing during high volatility.
You can boost your chances of success with specific confirmation signals. When volume surges accompany the breakout from the handle, along with alignments of momentum indicators like RSI, success rates increase by over 20%. These confirmations show that buying pressure is growing, supporting the expected price movement.
Time frame also affects success rates. For short-term trading (within a year), the pattern shows about a 70% success rate. This climbs to 80% for medium-term trading (five years) and 85% for long-term trading (ten years). These numbers show why the pattern is trusted for predicting upward momentum, especially when it lines up with market trends and increased trading volume. For more detailed statistics, check out Cup and Handle Success Rates Explained
Let's look at how the cup and handle pattern performs across different market conditions:
Cup and Handle Pattern Success Rates
Performance statistics across different timeframes and market conditions
| Timeframe | Success Rate | Typical Price Movement | Best Market Conditions |
|---|---|---|---|
| Short-term (< 1 year) | 70% | 10-15% upside | Strong sector momentum |
| Medium-term (1-5 years) | 80% | 15-25% upside | Bull markets with steady volume |
| Long-term (5-10 years) | 85% | 25-40% upside | Secular bull markets |
| All markets combined | 78% | 10-40% upside | Confirmed uptrends with volume |
As the table shows, the longer your timeframe, the more reliable the cup and handle pattern becomes, with the most significant price movements occurring in long-term scenarios during strong bull markets.
Performance Across Different Assets
When we analyze how the cup and handle performs in various asset classes like stocks, ETFs, cryptocurrencies, and forex, we find interesting differences. While you can apply the pattern across all these markets, its reliability and typical price movements vary. The pattern generally works best in highly liquid markets that show established trends.
Profit Potential and Risk Management
Understanding the realistic profit potential and risks of the cup and handle pattern is essential for planning trades effectively. Though the pattern can lead to substantial gains, you need to manage risk through appropriate stop-loss orders and position sizing. By carefully considering these factors, you can optimize your risk-reward ratio while protecting your capital.
Tools like ChartsWatcher let traders backtest the cup and handle pattern in specific markets and timeframes, gathering valuable data on historical performance. This evidence-based approach helps traders make smarter decisions, manage risk properly, and improve their chances of success.
Tactical Trading Approaches for Cup and Handle Profits
This section turns cup and handle pattern recognition into real-world trading strategies. We'll cover specific entry and exit methods, stop-loss placement, and position sizing techniques that can help improve your results when trading this reliable pattern.
Entry Strategies: Balancing Risk and Reward
When trading the cup and handle pattern, you have two main entry options: the aggressive breakout entry and the conservative handle retest entry. The aggressive approach involves buying as soon as price breaks above the handle's resistance, typically with increased volume. This method maximizes potential profits but comes with higher risk if the breakout fails. The conservative approach, meanwhile, waits for a pullback to the broken resistance level (now acting as support). This gives you a better risk-reward ratio but might mean missing some of the initial price movement.
Stop-Loss Placement: Protecting Your Capital
Setting proper stop-losses is essential for risk management when trading this pattern. Many traders place their stop-loss just below the lowest point of the handle, which limits potential losses if the trade moves against you. Another common technique is the 38-50% handle depth rule. This involves measuring 38-50% of the handle's depth and placing your stop-loss that distance below the breakout point. This approach gives your trade breathing room during normal market fluctuations while still protecting against false breakouts.
Profit-Taking Approaches: Securing Your Gains
Several profit-taking methods work well with cup and handle patterns. The measured move technique projects the cup's depth upward from the breakout point to establish a target price. For instance, if the cup is $10 deep, your target would be $10 above the breakout price. This straightforward approach helps secure consistent profits. More experienced traders often use trailing stops, raising their stop-loss level as price moves up, which can capture extended price moves. For more on this topic, check out our article on How to master price action strategies.
Position Sizing and Confirmation Signals
Position sizing plays a crucial role in cup and handle trading success. This means deciding how much capital to commit to each trade based on pattern quality and current market conditions. A high-quality pattern with strong confirmation signals justifies a larger position than a weaker pattern. Look for confirmation from volume, RSI, and moving averages to validate your cup and handle patterns. For example, increasing volume on the breakout, RSI crossing above 70, and price breaking above key moving averages all suggest higher odds of success.
Practical Examples and Adaptability
Adjusting your cup and handle strategy for different market conditions is key. In volatile markets, consider using the conservative handle retest entry and tighter stop-losses to reduce risk. During strong uptrends, the aggressive breakout entry with wider stop-losses might work better. Studying real examples of both successful and failed cup and handle patterns will sharpen your ability to spot high-probability setups and avoid common mistakes that can lead to losses.
Beyond the Textbook: Cup and Handle Variations
Most traders are familiar with the classic cup and handle pattern, but the market regularly serves up variations that can offer unique profit opportunities when spotted early. These lesser-known formations might be flying under your radar, but they shouldn't be. Let's explore some of these pattern variations and how you can use them to your advantage.
The Inverted Cup and Handle: A Bearish Reversal
The inverted cup and handle pattern flips the classic formation upside down and signals a bearish reversal. Instead of the bullish U-shape, you'll spot an inverted U, followed by a brief upward bounce (the handle) that provides a final exit opportunity for bulls before the expected downtrend begins.
This pattern is especially valuable if you're looking to short sell or protect existing long positions. To properly identify it, you need to understand the context of the prior uptrend and confirm the breakdown below the handle with increased volume – this volume confirmation is crucial for reliability.
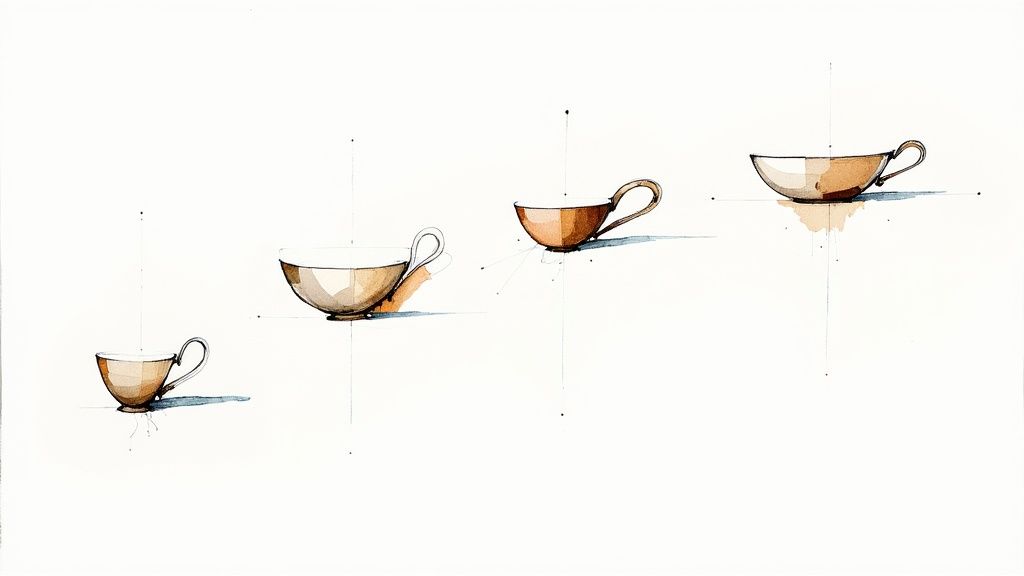
The Cup With Multiple Handles: Prolonged Consolidation
Sometimes stocks go through extended consolidation periods, forming what traders call a cup with multiple handles. This pattern shows a longer accumulation or distribution phase that often precedes explosive price movements.
Each handle represents a smaller pullback within the larger cup, allowing the stock to build momentum before making a decisive breakout. For instance, you might see a stock form a cup, then a handle, followed by another smaller cup and handle before the final breakout occurs. When you spot multiple handles, pay close attention to volume and price action since each handle offers a potential entry or exit point.
Market Context and Pattern Reliability
The effectiveness of any cup and handle pattern – whether classic or a variation – depends heavily on market conditions. During strong bull markets, the traditional cup and handle and multiple-handle variations typically perform well.
However, in highly volatile markets or uncertain economic conditions, these patterns become less reliable signals. The inverted cup and handle, on the other hand, often provides stronger signals in bearish or correcting markets. Always consider the broader market environment when evaluating these patterns for trade setups.
Sector-Specific Considerations
Just as overall market conditions matter, the specific market sector significantly impacts pattern reliability. Certain sectors – particularly technology or growth stocks – often display more pronounced cup and handle formations than others.
Understanding a sector's historical volatility and typical price action patterns can give you valuable insight when evaluating potential cup and handle setups. For example, a fast-moving tech stock might develop and complete a cup and handle much quicker than a utility stock in a more stable sector.
By learning these pattern variations and analyzing them within proper market context, you can significantly improve your cup and handle trading strategy and gain an edge in the markets. Tools like ChartsWatcher can help you identify and track these patterns across various markets and timeframes.
Avoiding Costly Mistakes With Cup and Handle Trading
Even experienced traders can fall into traps when trading the cup and handle pattern. Let's examine some common mistakes that can drain your trading account and explore practical solutions to avoid them.
Premature Entries: The Risk-Reward Ratio Killer
Jumping into a trade before the cup and handle pattern fully forms is one of the most damaging errors traders make. When you enter during handle formation, you dramatically reduce your potential reward while simultaneously increasing your risk exposure. The handle typically experiences price fluctuations that can easily trigger stop-losses placed too early.
The solution is straightforward but requires discipline: wait for a confirmed breakout above the handle's resistance with a noticeable increase in volume before entering. This approach gives you the best possible risk-reward scenario and prevents unnecessary losses.
Improper Stop Placement: Bleeding Capital Unnecessarily
Where you place your stops can make or break your cup and handle trading strategy. Too tight, and normal handle volatility will knock you out prematurely. Too wide, and you risk excessive losses if the pattern fails.
A balanced approach is to set your stop-loss just below the handle's low or use the 38-50% handle depth rule. This places your stop that percentage below the breakout point, providing adequate protection while giving the trade room to breathe and develop naturally.
Ignoring Volume: The Non-Negotiable Confirmation
Volume isn't just a secondary indicator with cup and handle patterns—it's essential confirmation. A pattern breakout without increased volume often signals a false move that leads to failed trades.
Healthy patterns typically show decreased volume during cup formation and low volume within the handle. But the real confirmation comes at breakout, where you should see a significant spike in volume. This surge shows strong buyer conviction and substantially increases your odds of a successful trade. If a stock breaks the handle with only minimal volume increase, proceed with caution—it might be a trap.
Confirmation Bias: Seeing Patterns Where None Exist
We're all susceptible to confirmation bias—the tendency to see what we want to see rather than what's actually there. In trading, this often manifests as "forcing" patterns onto charts and ignoring contradictory signals.
To combat this psychological pitfall, actively look for evidence that disproves your pattern identification. This objective approach helps separate wishful thinking from genuine trading opportunities and will save you from entering poorly formed patterns that are likely to fail.
Timeframe Misalignment: Fighting Larger Trends
Trading a cup and handle pattern on a timeframe that contradicts the larger market trend is asking for trouble. Spotting a bullish cup and handle on a daily chart while the weekly chart shows a clear downtrend dramatically reduces your chances of success.
Your odds improve significantly when you align your trading timeframe with the prevailing trend on higher timeframes. This ensures you're trading with the market's momentum rather than fighting against it—a much more profitable approach in the long run.
Misinterpreting Handle Duration: Overstaying Your Welcome
The handle's duration reveals important clues about underlying momentum. When handles extend beyond 1/3 to 1/4 of the cup's formation period, it often signals weakening momentum and increases the risk of a failed breakout.
Shorter handles typically precede stronger price moves, while extended handles frequently indicate market indecision. Pay close attention to this aspect of the pattern—it's often the difference between winning and losing trades.
By recognizing and avoiding these common errors, you'll significantly improve your success rate with cup and handle patterns. Remember that consistent profitability comes from pattern recognition combined with disciplined risk management and patient execution.
Ready to sharpen your cup and handle trading skills? ChartsWatcher offers powerful tools that help identify and analyze these patterns with precision. Sign up for a free trial today and see how it can transform your trading results.
