candlestick patterns hanging man: A Trader's Guide
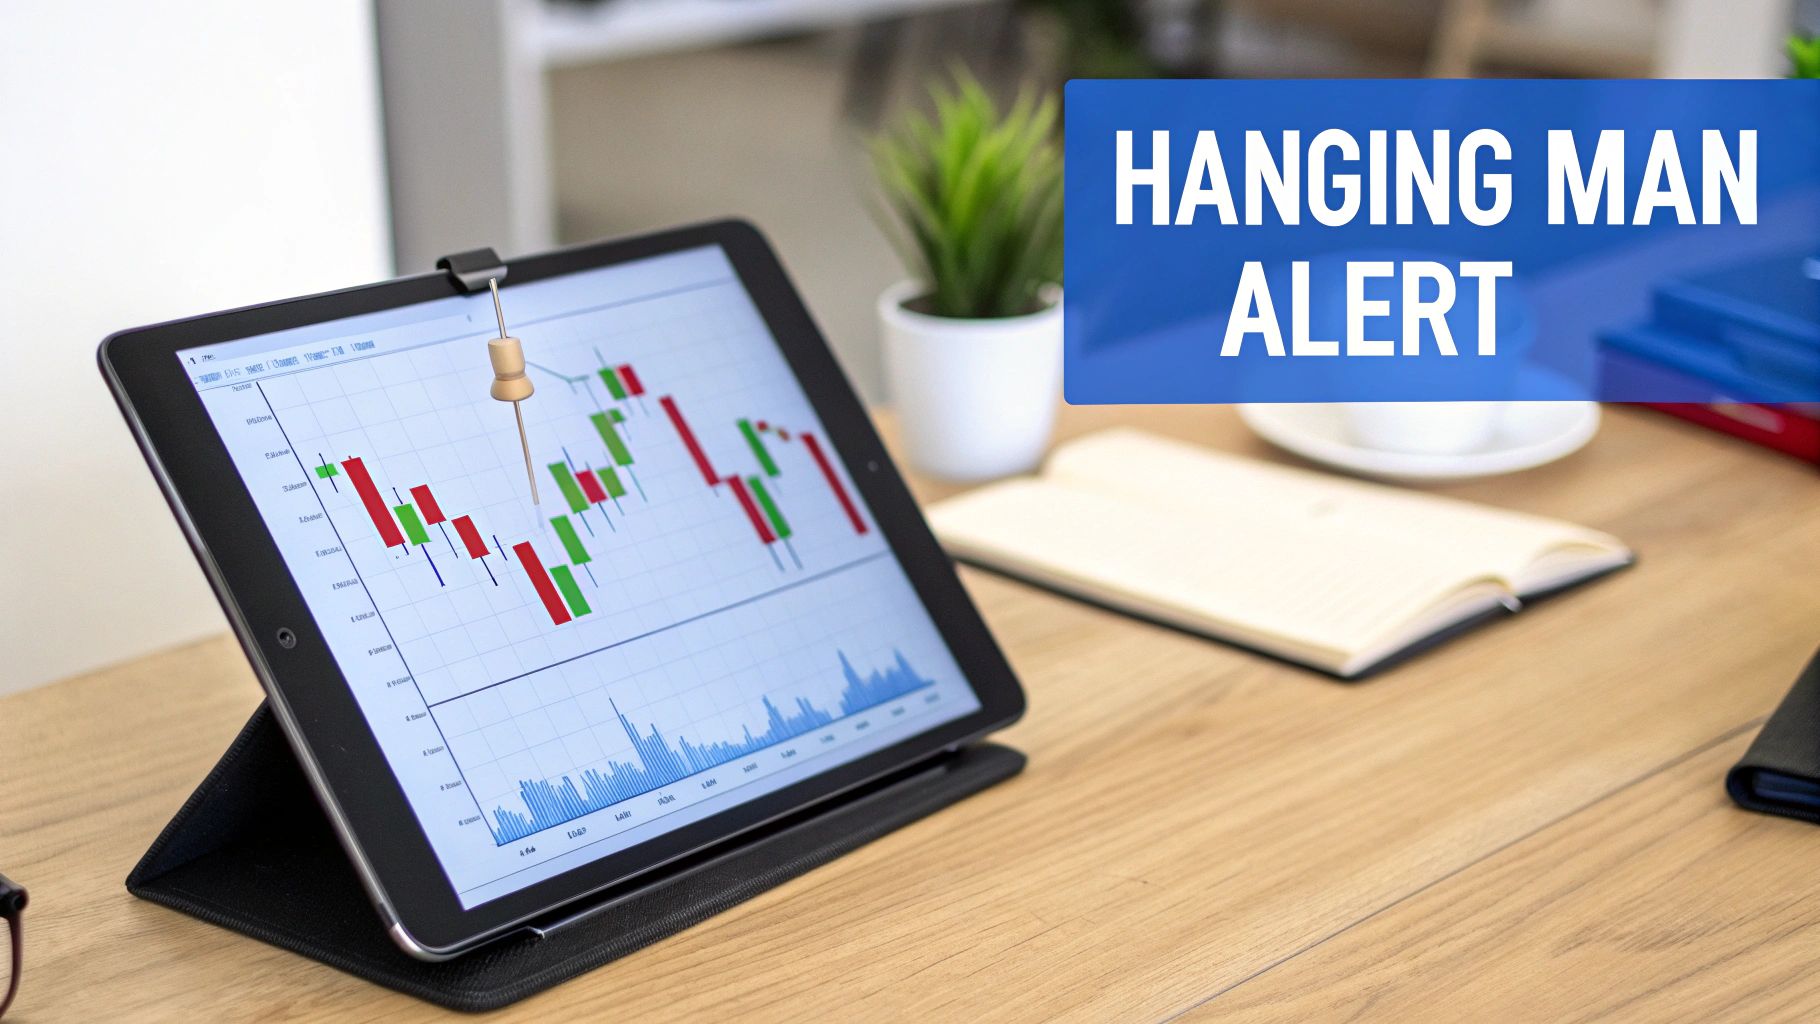
Think of the Hanging Man as a warning flare fired at the peak of an uptrend. It's a single candlestick pattern that acts as a bearish reversal indicator, essentially telling traders that the long, bullish party might be winding down.
This pattern suggests that after a sustained price climb, the momentum is starting to sputter. It’s a crucial signal that buying pressure is weakening, and the bears might be waking up.
Understanding the Hanging Man Pattern
Imagine a stock has been on a fantastic run, climbing higher and higher. Buyer confidence is through the roof. Then, out of nowhere, a single candle appears that tells a completely different story. That candle is the Hanging Man.
What this pattern reveals is a hidden battle that took place within one trading session. Even though the bulls managed to push the price back up to close near the open, that long lower shadow tells us something important: at some point during the session, sellers stepped in aggressively and drove the price way down.
This surge of selling pressure is often the first real crack to appear in a strong uptrend. It's a sign that the bears tested the waters, and even though they didn't win the day, their presence was strongly felt. If you're new to candlestick charts, our guide to understanding candlestick graphs is a great place to start.
Hanging Man Pattern Quick Identification Guide
To help you spot this pattern quickly in the heat of the moment, I’ve put together a simple reference table. It breaks down the key visual and contextual clues you need to look for on a chart.
| Characteristic | Description | Significance |
|---|---|---|
| Prior Trend | Must appear after a clear and established uptrend. | Its location is what gives the pattern its bearish meaning. |
| Body Size | The real body is small and located at the top of the range. | Shows little price movement between the open and close. |
| Lower Shadow | A long lower shadow, at least twice the height of the body. | Indicates significant selling pressure during the session. |
| Upper Shadow | Very little to no upper shadow should be present. | Signifies that the session's high was very close to the open or close. |
Think of these characteristics as your checklist. If a candle ticks all these boxes, you've likely spotted a valid Hanging Man, and it's time to pay close attention to what happens next.
Anatomy of the Hanging Man Candlestick
To confidently spot a Hanging Man, you first have to know what you're looking for. Think of each candlestick as a miniature story of the battle between buyers and sellers in a single session. The Hanging Man tells a tale of bullish exhaustion, and its shape reveals exactly how the tide started to turn against them.
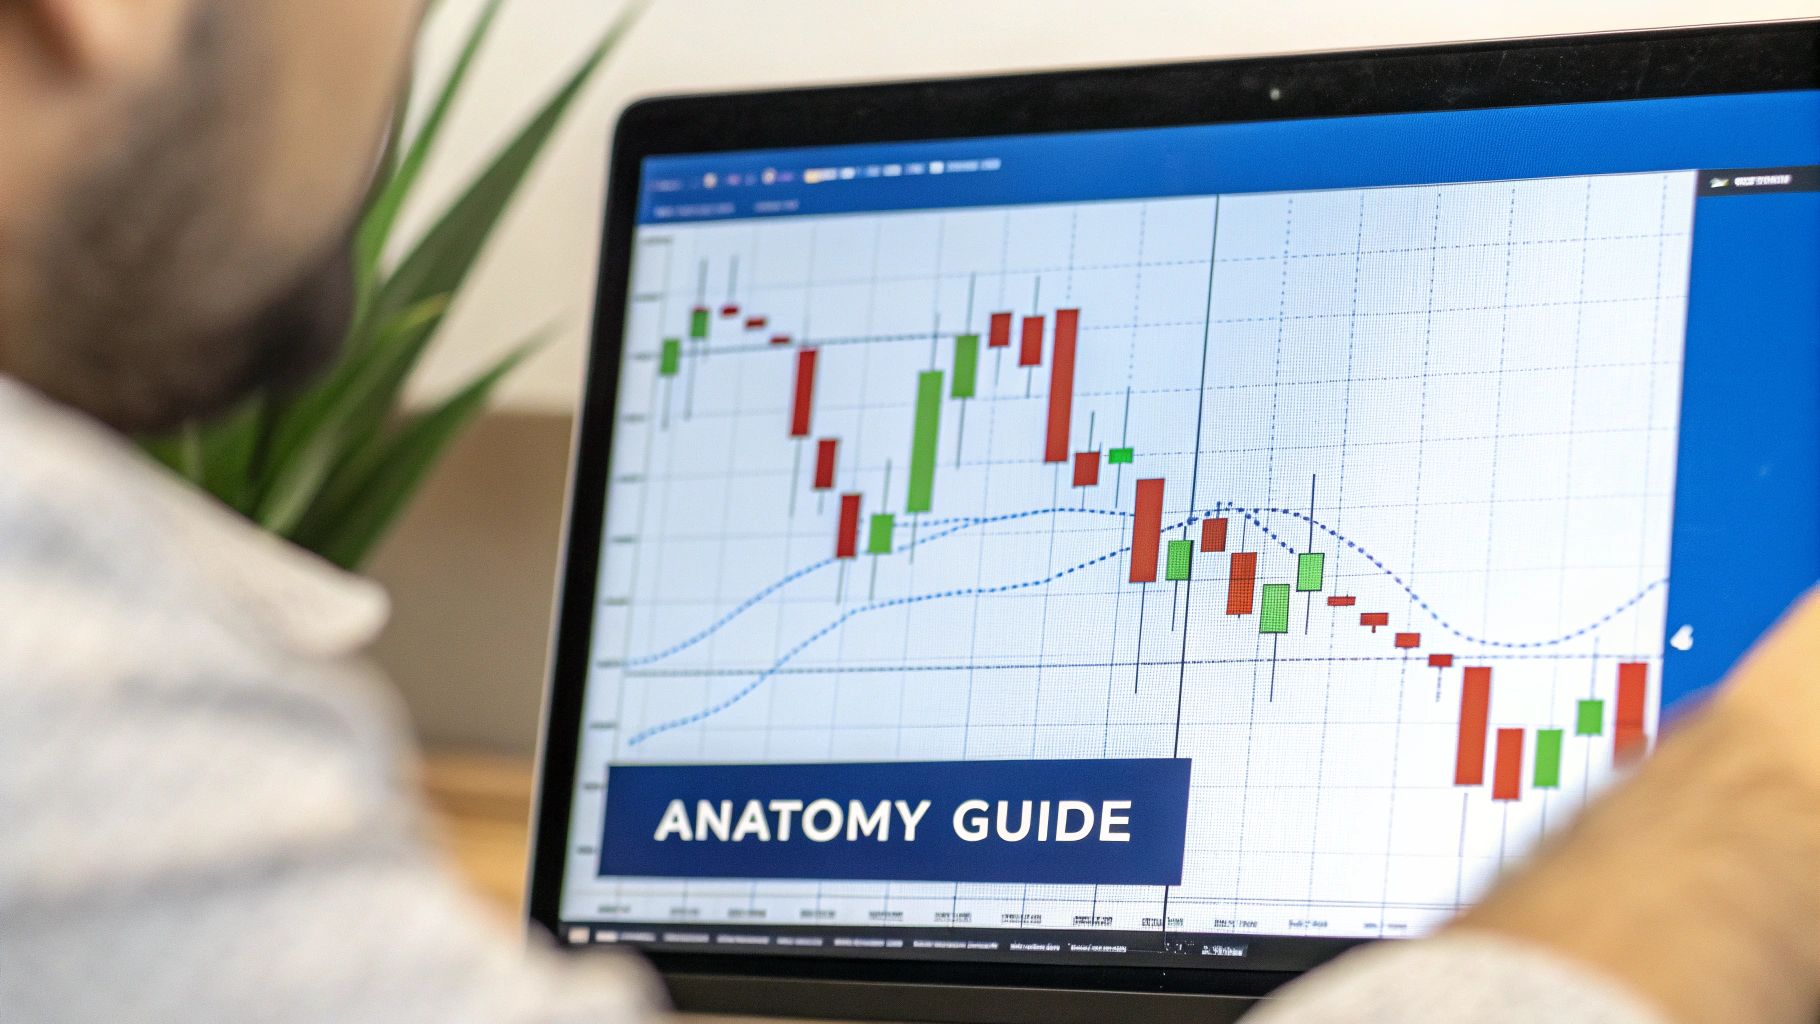
This pattern is built from four critical pieces, and each one gives you a clue about the shifting market sentiment. When you see them all together, they paint a clear picture of a potential reversal.
The Four Core Components
A true Hanging Man pattern needs every single one of these features. If even one is missing, it’s not a valid signal—it's just market noise that could easily mislead you.
- The Small Real Body: The body shows you the distance between the open and close price. Here, it’s small and sits right at the top of the candle’s range. This tells us that despite all the action during the session, the price finished almost exactly where it started, signaling major indecision after a strong rally.
- The Long Lower Shadow: This is the dead giveaway. The lower wick needs to be at least twice the length of the real body. It's a visual representation of a huge sell-off during the session, where bears grabbed control and aggressively slammed the price down.
- The Minimal Upper Shadow: You want to see little to no upper shadow. This part is crucial because it shows that after the market opened, buyers couldn't push the price any higher. That’s a big red flag for upward momentum.
- The Preceding Uptrend: Context is everything in trading. The Hanging Man is only a bearish warning sign if it shows up after a sustained uptrend. Its position at a market peak is what gives the pattern its name and its predictive power.
A common rookie mistake is seeing this shape in a downtrend or a sideways market and calling it a Hanging Man. In those situations, it's actually a Hammer, which is a bullish reversal signal. Location, location, location—it changes everything.
What Each Part Tells You
Let's break down the story this candle tells.
First, the uptrend shows the bulls were firmly in charge. Then, the Hanging Man session opens, but buyers immediately fail to make a new high (that's our missing upper shadow).
Suddenly, the sellers take over completely. They create that long lower shadow as prices plummet. While the bulls manage a last-gasp effort to push the price back up near the open, forming that small body, the psychological damage is already done. For the first time in a while, the bears have shown they have real power, planting a seed of doubt that the bullish party might be over.
The Market Psychology Behind the Pattern
The story starts with confidence. The market's been in a solid uptrend, and the session opens with bullish traders feeling pretty good about themselves, fully expecting prices to keep climbing. For a little while, they're right. They keep prices hovering near the session's high point.
The Sudden Shift in Power
Then, out of nowhere, the script flips. A huge wave of selling pressure crashes the party, catching the bulls completely off guard. This is the moment the long lower shadow of the hanging man is created. Prices plummet as sellers overwhelm buyers, showing a level of bearish force that just hasn't been present during the entire uptrend.
This sudden drop plants a nasty seed of doubt. The bulls' once-unshakeable confidence starts to crack. They see the bears' muscle and begin to wonder if the rally has finally gassed out. That flicker of hesitation is the key—it’s the first real clue that the market's dominant attitude is starting to sour.
Sure, the bulls manage to scramble back late in the session, pushing the price back up to close near where it opened. But the psychological damage is already done. Their recovery feels weak and unconvincing, which is what creates that small body at the very top of the candle.
The hanging man isn't a signal of a decisive bearish victory; it's a snapshot of bullish exhaustion. It shows us that for the first time in a while, the buyers really struggled to stay in charge, and the bears proved they have enough power to shove prices down hard.
When you boil it down, this single candle tells the story of a market at a tipping point. It captures that subtle but critical transition from unwavering greed to the first whispers of fear. This shift in sentiment is precisely what gives patterns like the hanging man their predictive edge, signaling that the trend’s foundation might be starting to crumble.
How to Confirm a Hanging Man Signal
Spotting a Hanging Man at the top of an uptrend is like hearing a faint rumble of thunder on a sunny day. It’s a warning, not a guarantee of a storm. Jumping the gun and acting on this signal alone is one of the most common—and costly—mistakes traders make.
The pattern simply flags potential weakness; it doesn't confirm a reversal is underway. The right move is to treat it as an alert to pay much closer attention. Before you risk a single dollar, you need to wait for the market to give you more evidence that the bears are truly wrestling control from the bulls. This validation process is called confirmation, and it's what separates disciplined traders from gamblers.
Waiting for the Next Candle
The most direct way to get confirmation is to simply watch the very next candlestick that forms after the Hanging Man. A real bearish reversal needs follow-through from the sellers.
What you're looking for is a subsequent candle that closes below the real body of the Hanging Man. An even stronger signal is a close below the pattern's absolute low, as it shows sellers have smashed through the temporary support level set during the Hanging Man's session.
Think of it this way: The Hanging Man shows the bulls might be exhausted. A strong bearish candle right after it is the knockout punch, proving the bears have capitalized on that fatigue and are now in command. Without that follow-up, the bulls might just be catching their breath before pushing the uptrend even higher.
Using Volume as Your Lie Detector
Volume is an indispensable tool for telling a real reversal from a fakeout. A genuine change in trend should be backed by significant market participation. When you see a spike in trading volume on that confirmation candle, it adds a powerful layer of credibility to the bearish move.
Increased volume tells you that a large number of traders are actively selling, suggesting strong conviction behind the downward pressure. Our guide on trading with volume analysis can help you master this essential skill. On the flip side, if the price drops on low volume, the move is less convincing and is more likely to be a temporary dip than a full-blown reversal.
Don't just take my word for it. Statistical research across thousands of markets offers a sobering perspective on acting without proof. One study found that the Hanging Man candlestick pattern leads to a confirmed reversal only about 37.2% of the time. Confirmation is typically seen within an average of 4.3 candles, which really underscores the need for patience. You can discover more insights about these specific Hanging Man pattern findings.
Cross-Referencing with Technical Indicators
Finally, smart traders never rely on a single piece of information. They build a stronger case for a trade by cross-referencing the Hanging Man signal with other technical indicators. This multi-faceted approach is your best filter against false signals.
Here are a few common confirmation techniques:
- Relative Strength Index (RSI): Is the RSI in overbought territory (typically above 70)? A Hanging Man that pops up when the market is already overextended carries a lot more weight.
- Moving Average Convergence Divergence (MACD): Look for a bearish crossover, where the MACD line dips below the signal line. This is a classic sign that upward momentum is fading and shifting to the bears.
- Support and Resistance: The most potent Hanging Man signals form at or near a major resistance level. This context shows that buyers tried—and failed—to break a known price ceiling, making a reversal far more probable.
Practical Trading Strategies for the Hanging Man
Spotting and confirming a Hanging Man is a great start, but turning that chart pattern into an actual trade? That requires a rock-solid, actionable plan. A good strategy takes the emotion out of the equation, telling you exactly when to get in, where to set your safety net (the stop-loss), and how to take your profits.
Let's walk through how to build a complete trading setup. Once you've confirmed the pattern, the real work of structuring the trade begins. This has to be based on logic and risk management, not just a gut feeling that the market's about to tank.
Building Your Trade Entry Plan
Your entry trigger is your green light to act. For the Hanging Man, the most common and logical entry point is to place a short (sell) order as soon as the price breaks below the low of the Hanging Man candle itself. This break serves as the final piece of the puzzle. It shows that sellers have finally overpowered the buyers who pushed the price up from that session's low, suggesting the downward slide is ready to continue.
There's also a more conservative approach: wait for the next candle (the confirmation candle) to fully close below the Hanging Man’s low. This method helps you avoid getting caught in a "fakeout"—where the price dips for a moment before snapping back up—but you might end up with a less favorable entry price.
Key Takeaway: Never, ever enter a trade just because you see a Hanging Man form. Your entry must be triggered by what the price does next. A clean break of the support level created by the pattern's low is the confirmation you're looking for.
This decision tree infographic breaks down the essential confirmation steps—from identifying the pattern to checking volume and other indicators—that should always come before you even think about putting on a trade.
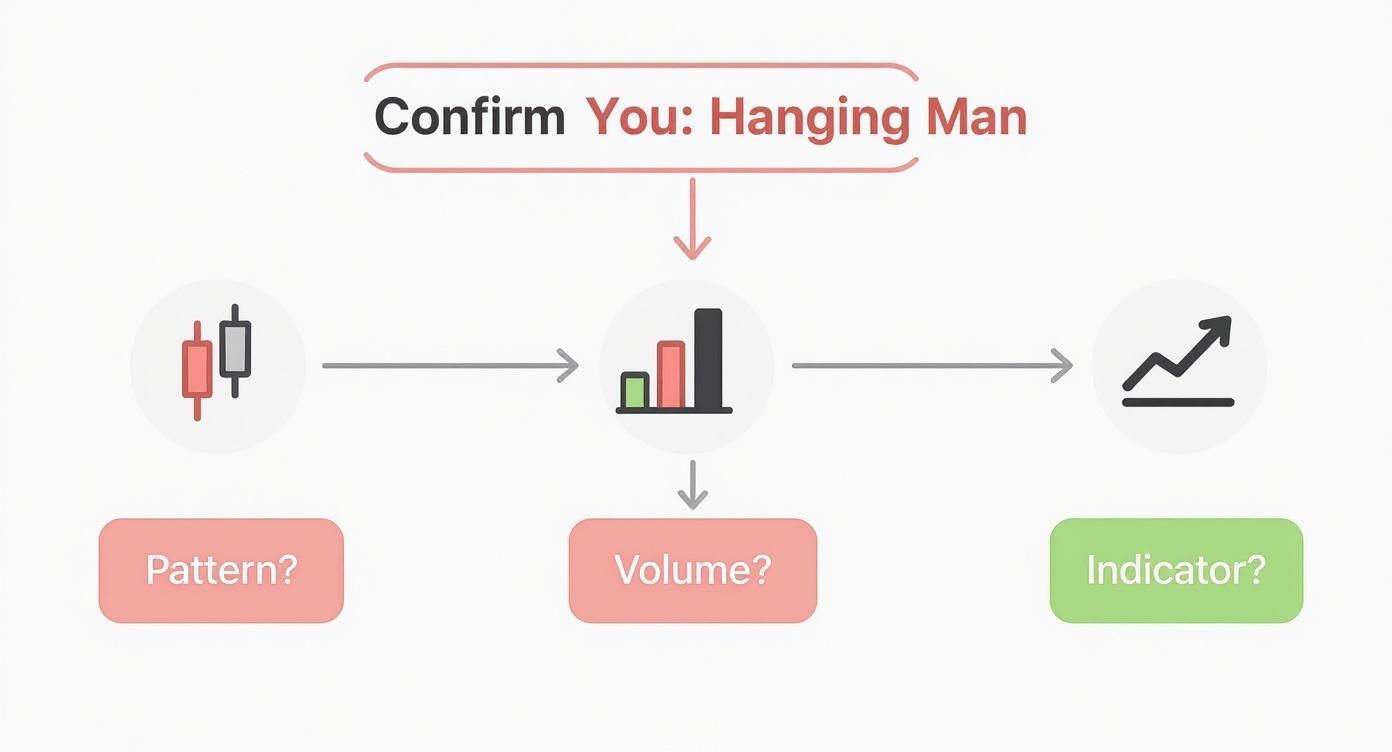
The flow here shows how each piece of evidence builds on the last, strengthening the case for a potential trade and helping you filter out the weaker, less reliable signals.
Setting Your Stop-Loss and Profit Targets
Smart risk management is completely non-negotiable. Your stop-loss is your escape hatch, defining the absolute maximum you're willing to lose if the market decides to move against you.
-
Stop-Loss Placement: A logical place for your stop-loss is just above the high of the Hanging Man candlestick. If the price manages to rally back above this point, the whole bearish signal is invalidated. It's time to get out and protect your capital.
-
Take-Profit Levels: Figuring out where to cash in can be done a few different ways. A common method is to look left on the chart, find the next major support level, and set your target there. Other traders might use tools like Fibonacci retracement levels or simply aim for a specific risk/reward ratio, like 2:1 or 3:1. This ensures your potential profits are at least double your potential loss, which is a hallmark of a sound trading plan.
Hanging Man Entry Strategy Comparison
Choosing between an aggressive or conservative entry really comes down to a trade-off between risk and reward. The best fit often depends on your personal risk tolerance and what the broader market is doing. Here’s a quick breakdown of the two main approaches.
| Strategy | Entry Trigger | Pros | Cons |
|---|---|---|---|
| Aggressive | Enter as soon as the price breaks below the low of the Hanging Man. | Better entry price, potential for larger profits. | Higher risk of being stopped out by a false breakdown or "head fake." |
| Conservative | Wait for the confirmation candle to close below the Hanging Man's low. | Lower risk of false signals, higher probability of a valid move. | Poorer entry price, potentially smaller profit margin or missed opportunity. |
Ultimately, a successful strategy for trading patterns like the Hanging Man is all about creating a repeatable process. It’s a blend of sharp pattern recognition, strict entry rules, disciplined risk management, and clear profit goals. This is how you turn a simple observation on a chart into a structured, high-probability trading opportunity.
Common Mistakes That Trip Up Traders
Knowing what not to do is just as important as knowing what to do. The Hanging Man is a solid pattern, but it's surrounded by a few common pitfalls that can easily trap traders who aren't careful. Getting a handle on these mistakes is the first step toward trading with more discipline.
One of the biggest blunders is seeing a Hanging Man and immediately jumping in without looking at the bigger picture. A Hanging Man that pops up in a messy, sideways market is basically noise. But one that forms right at a major resistance level after a strong, clear uptrend? That’s a signal you should pay attention to. Context is everything.
Jumping the Gun and Setting Stops Too Tight
Another classic mistake is not waiting for confirmation. Think of the Hanging Man as a warning shot, not a direct order to sell. Piling into a short trade the moment the candle closes, without waiting for the next candle to prove the bears are in control, is just gambling. Impatience is a fast track to getting stopped out on a false alarm.
On a similar note, traders often choke their trades by setting their stop-loss way too close to their entry. While it might feel safer to have a tight stop, you're not giving the trade any room to breathe. The market is naturally volatile, and that background "noise" can easily nudge the price just high enough to trigger your stop right before the real move happens.
Trader's Rule of Thumb: Never, ever trade a candlestick pattern in a vacuum. A Hanging Man signal gets its real power from confluence—when it shows up alongside other clues like a spike in volume, an overbought RSI, or a smack-down at a key resistance zone.
Here’s a quick rundown of the most common blunders and how to fix them:
- Trading Without Context: Only trust a Hanging Man that appears after a sustained uptrend, ideally near a well-known resistance level.
- Forgetting Confirmation: Always wait for the next candle to close below the Hanging Man’s body (or even its low) before you even think about entering.
- Misidentifying the Pattern: Double-check that the candle fits the bill—small body up top, long lower shadow, and little to no upper wick. Don't get it mixed up with something else.
- Setting Unrealistic Stops: Place your stop-loss logically above the high of the pattern. Give the trade enough space to handle normal market jitter without kicking you out too early.
By sidestepping these common errors, you can dramatically improve how reliably the candlestick patterns hanging man works for you.
Got Questions? We've Got Answers
Once you get the theory down, the real questions start popping up. How does this stuff actually work when your money is on the line? Let's tackle some of the most common questions traders have about the hanging man pattern to make sure everything is crystal clear.
What Is the Main Difference Between a Hanging Man and a Hammer Pattern?
This is easily the most common point of confusion, and the answer is simple: context. The candles look identical, but where they show up on the chart changes everything.
- A Hanging Man pops up after a solid uptrend. It's a warning sign from the bears, hinting that the rally might be running out of gas.
- A Hammer forms at the bottom of a downtrend. It’s a bullish signal, suggesting sellers are exhausted and buyers might be ready to step in.
Think of it like this: the same cloud can mean welcome shade on a hot day or a coming storm on a cold one. The environment determines its meaning.
Is a Red Hanging Man More Reliable Than a Green One?
Good question. A red (bearish) hanging man is often seen as a slightly more potent warning. Why? Because sellers not only pushed the price down during the session but also managed to close it below the opening price. They won the final skirmish.
That said, the difference isn't huge. Both red and green hanging man patterns are valid signals that scream for confirmation before you act. Don't get too hung up on the color.
Which Timeframes Work Best for the Hanging Man Pattern?
Like most classic patterns, the hanging man tends to be more reliable on higher timeframes—think daily, weekly, or 4-hour charts.
These longer periods filter out the day-to-day "market noise." A hanging man on a weekly chart reflects a whole week of struggle between buyers and sellers, making it a much more significant event than a flicker on a 1-minute or 5-minute chart, which can often be a false alarm.
Ready to stop hunting for patterns manually? ChartsWatcher does the heavy lifting for you. Our powerful scanning software lets you build custom dashboards to find patterns, set alerts, and track market data in real-time. Give yourself the edge you need. Explore our features and plans.
