Build a Winning Price Action Strategy
A price action strategy is simply a way of trading that relies purely on price movement, right from the chart, without leaning on lagging indicators. It’s all about learning to read the "story" of the market as it unfolds through candlestick patterns, support and resistance levels, and the overall market structure.
Understanding the Foundations of Price Action
To build a price action strategy that actually works, you have to learn the market's language. This goes way beyond just memorizing definitions; you need to grasp the psychology that drives the price chart. Every single candle, every swing high, and every swing low tells you something about the constant battle raging between buyers and sellers.
Learning to read this story is the true foundation of discretionary trading. Forget trying to memorize dozens of candlestick patterns. Instead, focus on what those patterns mean in the current market context. A bullish engulfing bar, for example, isn't just a random shape—it’s a clear sign of buyers aggressively taking control from sellers, hinting at a potential shift in momentum.
The Core Components of Price Action Analysis
At its core, price action analysis really just comes down to three pillars: market structure, critical price zones, and candlestick patterns. If you can master these, you’ll have the framework for almost any successful strategy. Think of them as the grammar and vocabulary you need to become fluent in the market's language.
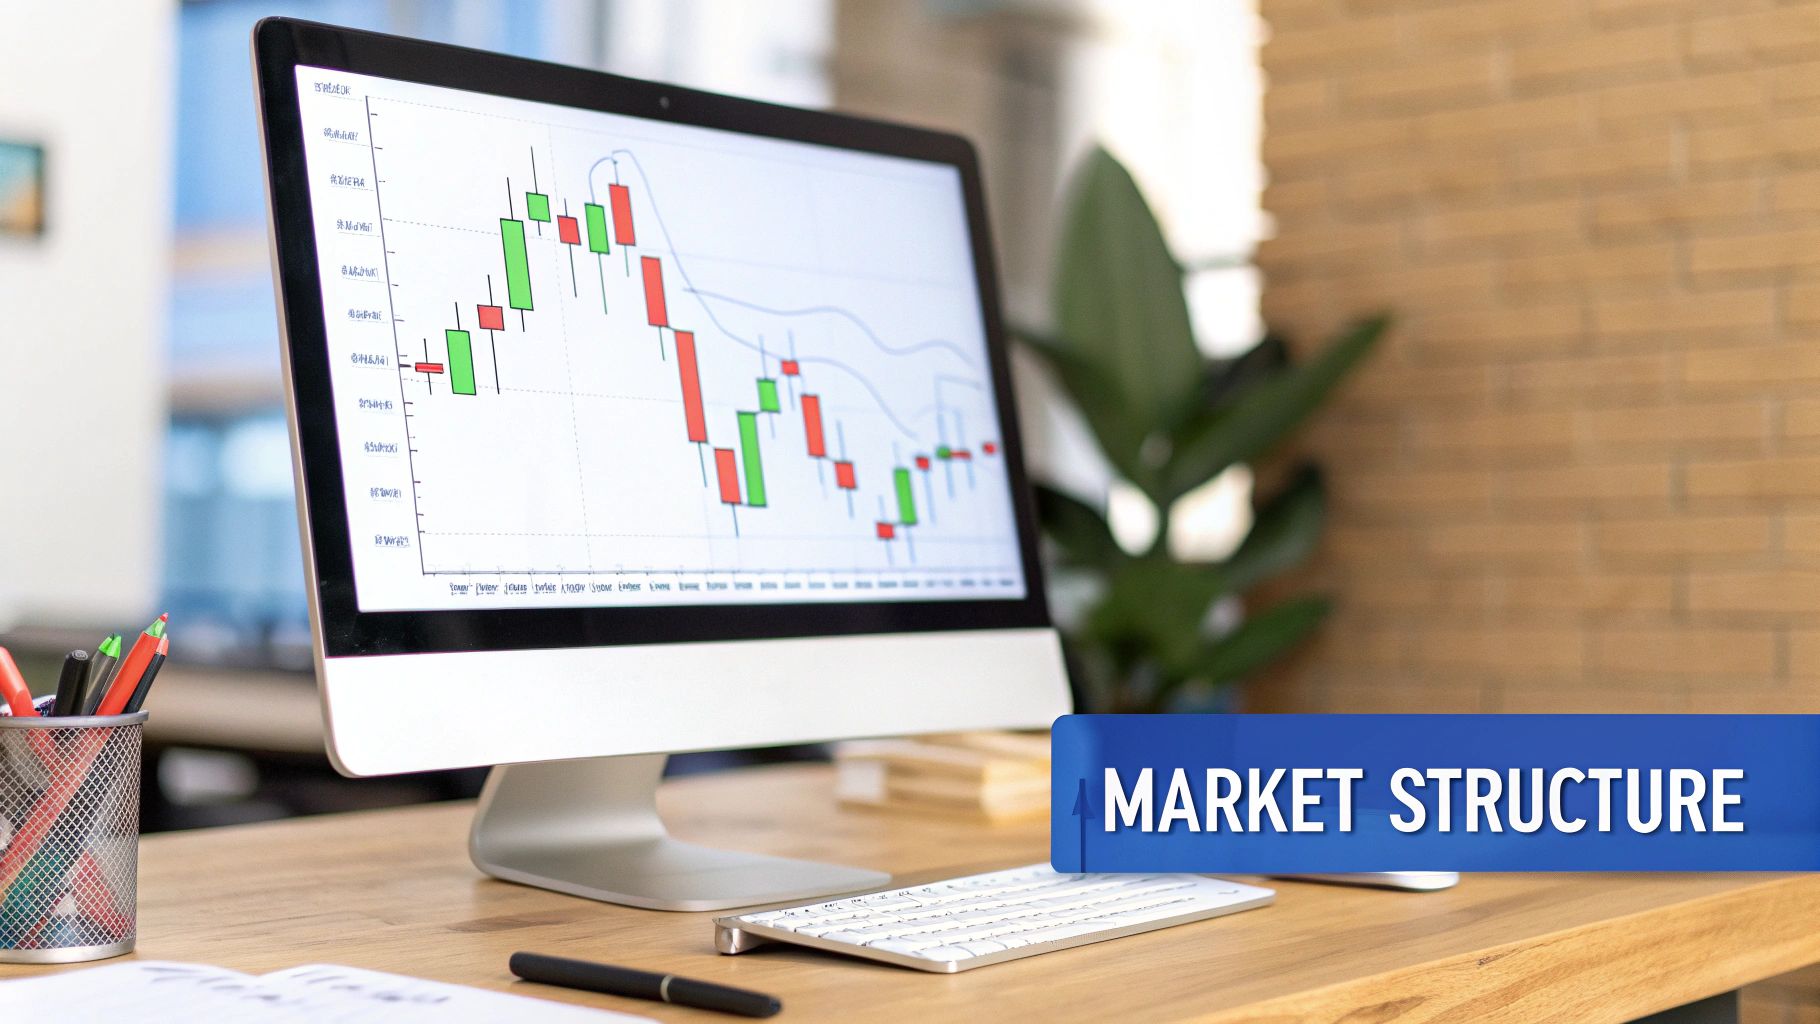
- Market Structure: This is just the sequence of higher highs and higher lows (an uptrend) or lower highs and lower lows (a downtrend). It gives you the big-picture context for any trade you take. One of the easiest ways to stack the odds in your favor is to simply trade with the dominant structure. For a deeper look, check out our guide on market structure trading.
- Support and Resistance Zones: Don't think of these as exact lines. They are areas on a chart where buying or selling pressure has historically been strong enough to turn the price around. Finding these zones helps you anticipate where sentiment might flip, giving you high-probability spots to enter or exit trades.
- Candlestick Patterns: Formations like pin bars, engulfing bars, and inside bars are the specific signals that scream, "Act now!" A pin bar showing up at a major resistance level, for instance, is a powerful tell that sellers have rejected higher prices and a move down could be on the deck.
This flow chart shows exactly how these three components come together to form a solid trading decision.
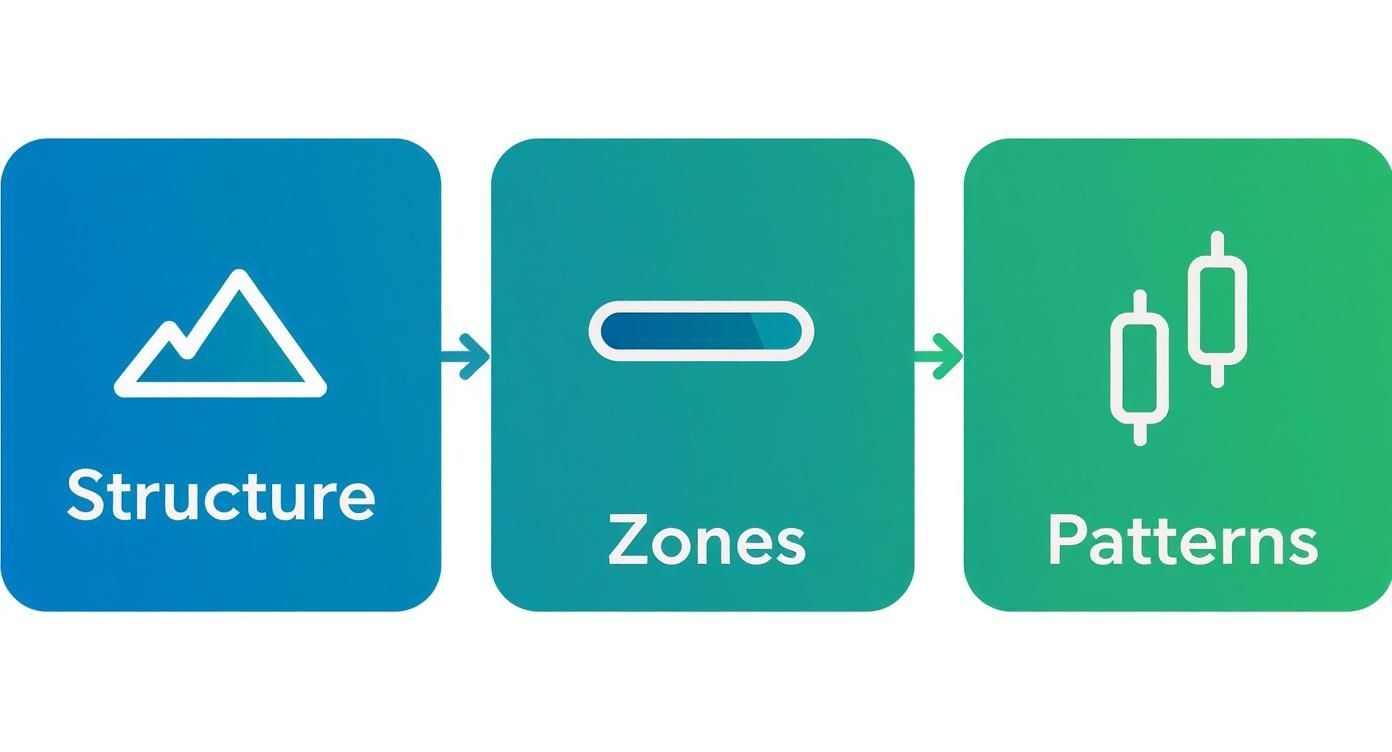
As you can see, good analysis starts with identifying the market structure, then mapping out your key zones, and finally, waiting patiently for a specific pattern to trigger your trade.
Interpreting Market Psychology Through Patterns
Every price action pattern is a direct reflection of the fight between supply and demand. A pin bar with a long tail shows a failed attempt by one side to push the market, followed by a powerful rejection from the other side. That rejection is your clue. It tells you who's in control right now and where the path of least resistance is likely headed. As you get more comfortable with these ideas, it's interesting to see how top data analytics companies apply similar principles to interpret complex market data.
To help you get started, here's a quick rundown of some of the most common price action setups and what they're telling you about the market.
Key Price Action Setups and Their Market Indication
| Pattern | Description | Market Signal |
|---|---|---|
| Pin Bar | A candle with a long wick and a small body, showing price rejection. | Strong potential for a reversal, especially at key support/resistance. |
| Engulfing Bar | A large candle that completely "engulfs" the body of the previous one. | A powerful shift in momentum; bullish or bearish depending on direction. |
| Inside Bar | A candle's entire range is contained within the previous candle's range. | Indicates consolidation or indecision; often signals a breakout is coming. |
| Breakout | Price moves decisively through a previously established support or resistance level. | Confirmation that a new trend may be starting in the direction of the break. |
These patterns are the building blocks, but their real power comes from context.
The most powerful price action setups happen when a clear candlestick pattern forms at a level of confluence—where market structure, support or resistance, and maybe even a dynamic level like a moving average all line up. This confluence is your best filter for finding high-probability trades.
When you look at historical data, certain classic patterns have shown consistently high success rates. For example, a confirmed Head and Shoulders pattern on a daily or weekly chart often leads to a successful trend reversal around 70-80% of the time. These larger patterns are especially effective in trending markets and frequently offer risk-reward ratios of 1:3 or better, which explains why they remain a favorite among seasoned traders.
Defining Your Strategy's Rules of Engagement
A profitable price action strategy isn't built on gut feelings or random hot streaks. It's a rigid, non-negotiable set of rules. This framework is what separates consistent traders from gamblers. Without it, you’re just reacting to market noise; with it, you operate like a business executing a proven plan.
The entire goal is to get guesswork and emotion out of your trading. Your rules need to be so crystal clear that anyone—your spouse, your friend, a complete stranger—could look at your chart and tell you whether a valid trade setup is present. This mechanical approach is the bedrock of long-term profitability.
Crafting Objective Entry Triggers
Your entry trigger is the specific event on the chart that screams, "It's time to act." Vague ideas like "buy when it looks bullish" are totally useless in the real world. A proper, objective trigger is binary—it either happens, or it doesn't. No grey area.
Let's walk through a real-world example using a bullish engulfing pattern. A weak, fuzzy rule would be: "Buy after a bullish engulfing bar." That leaves way too much open to interpretation.
A strong, objective rule is far more detailed:
- Condition 1: The market must be in a clear uptrend on the daily chart (price is holding above the 50-period moving average).
- Condition 2: Price has to pull back to a previously established support zone.
- Trigger: A bullish engulfing candle must form within that support zone, closing firmly above the high of the prior candle.
See the difference? This removes all subjectivity. The trend is defined, the location is specific, and the pattern is precise. You're no longer guessing; you are patiently waiting for your exact conditions to line up.
Setting Your Stop Loss with Precision
Your stop loss is your number one risk management tool. It's the pre-planned price where you admit you were wrong, get out of the trade, and protect your capital. Placing it correctly is both an art and a science, designed to give your trade room to work without exposing your account to catastrophic risk.
There are two main ways to set a logical stop loss:
- Structure-Based Stops: This is the classic price action method. You place your stop just beyond a key structural point on the chart. For a long trade, this means tucking it just below the recent swing low or right under the low of your signal candle (like the long tail of a pin bar).
- Volatility-Based Stops (ATR): The Average True Range (ATR) indicator is a fantastic tool for measuring market volatility. Instead of a fixed point, you can place your stop a multiple of the current ATR value away from your entry (e.g., 2x ATR). This method is dynamic; it automatically gives you a wider stop in choppy, volatile markets and a tighter one when things are quiet.
A huge mistake I see traders make is setting stops based on an arbitrary dollar amount they're willing to lose. This completely ignores what the market is telling you. Your stop loss must be placed at a logical price point where your original trade idea is proven invalid, not just where the financial pain starts to feel uncomfortable.
Planning Your Exit with Take Profit Tactics
Knowing when to cash in on a winner is every bit as important as knowing when to get in. A clear exit plan keeps you from giving back hard-won profits because of greed or fear. The best time to decide where you'll take profit is before you even click the buy or sell button.
Here are a few effective take-profit tactics you can build into your plan:
- Fixed Risk-to-Reward Ratio: Simple, mechanical, and powerful. You target a specific multiple of your initial risk. For instance, if your stop loss is 50 pips away, a 1:2 risk-to-reward ratio means your take profit is set 100 pips from your entry. This ensures that, over time, your winning trades are mathematically larger than your losing ones.
- Targeting Structure: The most logical place to take profits is often the next major support or resistance level. If you go long at support, your first target could be the next significant swing high—a spot where you know sellers might be waiting to jump back in.
- Trailing Stops: If you're trying to catch a big, multi-day trend, a trailing stop is your best friend. It follows your winning position, locking in profits as the price moves in your favor. You can do this manually by moving your stop below recent swing lows, or automatically by using a multiple of the ATR.
Adding Confluence for High-Probability Setups
Confluence is the magic that happens when multiple, independent technical factors all line up to support the same trade idea. Think of it like getting a second, third, and fourth opinion that all say the same thing. Trading only at these points of high confluence is one of the best ways to filter out mediocre setups and focus on the A+ opportunities.
A standalone price action strategy becomes so much more powerful when you add these filters.
Imagine a bearish pin bar forms. By itself, that’s a decent signal. But what if that exact same bearish pin bar forms right at:
- A major daily resistance level.
- The 20-period exponential moving average, which has been swatting the price down for weeks.
- A major Fibonacci retracement level, like the 61.8% retrace.
- With a big spike in selling volume that confirms the rejection.
Now you don't just have a pin bar. You have a high-probability setup backed by four distinct, logical reasons to sell. Building these layers of confirmation into your rules of engagement is how you develop a truly professional trading edge.
Validating Your Strategy Through Backtesting

So you’ve defined your setups, your entry triggers are crystal clear, and your risk management is dialed in. Great. But how do you actually know if your price action strategy has a genuine edge? This is the moment where theory gets put to the test. You prove it with data, and that means rigorous backtesting.
Backtesting is simply the process of applying your trading rules to historical price data to see how you would have fared. Think of it as your strategy’s dress rehearsal before it ever steps onto the live market stage. This isn’t just about seeing if it "works"; it's about uncovering its true personality—its strengths, its weaknesses, and its breaking points.
The Foundation of a Reliable Backtest
The first rule of backtesting is brutally simple: garbage in, garbage out. The quality of your historical data is completely non-negotiable. Using inaccurate or incomplete data will spit out misleading results, giving you a false sense of confidence that will vanish the moment you risk real money.
Just as critical is avoiding the trap of hindsight bias. It’s that natural tendency to look back at a chart and think, "Well, of course that was the right move." When you're backtesting manually, you have to be ruthlessly honest. If your entry rule wasn't perfectly met based only on the information available at that exact moment, you can't count it as a trade. Period.
Essential Performance Metrics to Understand
Once you've run your test and have a list of simulated trades, you need to analyze the results. A simple win rate doesn't even begin to tell the whole story. You need to dig into the numbers that reveal your strategy's true performance profile.
Here's a quick look at some of the most important metrics you’ll encounter when evaluating a backtest. These numbers cut through the noise and tell you what’s really going on with your strategy's performance.
| Metric | What It Measures | Why It's Important |
|---|---|---|
| Profit Factor | Gross Profit / Gross Loss | Shows how many dollars you make for every dollar you lose. A value over 1.5 is good; over 2.0 is excellent. |
| Maximum Drawdown | The largest peak-to-trough drop in equity | Reveals the worst losing streak your strategy endured. This is your key indicator of risk and potential pain. |
| Sharpe Ratio | Return on investment compared to its risk | Measures risk-adjusted return, allowing you to compare different strategies on an even playing field. |
Understanding these metrics helps you move beyond a simple win/loss count and see the true character and viability of your trading plan.
A classic rookie mistake is obsessing over a high win rate. A strategy with a 40% win rate can be incredibly profitable if the average winning trade is three or four times larger than the average losing trade. Focus on your profit factor and risk-adjusted returns, not just the raw percentage of winners.
The statistical power of backtesting isn't just theory. For example, one major study analyzed bullish flag patterns over 17 years on 25 liquid stocks. The result? Trading these classic price action patterns generated an average annual profit of 37.82% after commissions. That study also reinforced a key principle: you need a bare minimum of 30 trades for your results to be statistically significant.
Manual vs. Automated Backtesting
When you're first developing a strategy, manual backtesting is an invaluable exercise. You literally scroll back on your chart, candle by candle, and log every single trade that meets your criteria in a spreadsheet. It's slow and tedious, but it forces you to internalize your rules and builds an incredible amount of chart-reading skill.
But let's be realistic—as your strategy solidifies, manual testing becomes a massive bottleneck. This is where automated backtesting platforms like ChartsWatcher become indispensable. Automation lets you test your ideas across years of data and dozens of markets in minutes, not weeks. That speed allows you to iterate quickly, tweak parameters, and optimize your approach using a statistically massive sample size.
If you’re ready to make that leap, we've put together a comprehensive resource on how to backtest trading strategies like a pro.
By combining an initial manual backtest with a more thorough automated one, you build unshakable confidence. You’ve done the homework, you’ve seen the numbers, and you know your strategy has a verifiable edge. That conviction is what will allow you to execute your plan with discipline when real money is on the line.
Automating Your Scans and Alerts for Efficiency
Manually flipping through dozens, or even hundreds, of charts is a surefire path to burnout. More importantly, it's a recipe for missed opportunities. While you're analyzing one chart, your perfect price action setup could be forming on another. The solution isn't more screen time—it's smarter technology.
Automating your scanning and alerting process is how you level up from an active chart-watcher to an efficient market operator. Instead of hunting for setups, you let the setups come to you. This frees up your mental capital to focus on what truly matters: high-level analysis, trade management, and flawless execution.
Translating Rules into Scanner Criteria
The first step is to convert your written trading rules into a language a machine can understand. Think of your trading plan as a recipe. Each condition—market structure, location, and the specific candlestick pattern—is an ingredient. A powerful scanner lets you combine these ingredients to find only the charts that match your exact recipe.
For example, a common rule set for a moving average pullback strategy might look something like this:
- Market Trend: The stock must be trading above its 50-period simple moving average on the daily chart.
- Pullback Location: The current price has to be within 1% of the 20-period exponential moving average.
- Entry Signal: A bullish engulfing candle must have formed on the latest closed daily candle.
This isn't a vague idea; it's a precise set of logical conditions. A dedicated scanning platform allows you to build these rules directly into a custom scan that runs continuously across your chosen universe of stocks or forex pairs.
The interface of a platform like ChartsWatcher is designed for this exact purpose, allowing you to build complex conditional alerts without writing a single line of code.
This visual, point-and-click approach makes it much easier to turn your trading plan's logic into a functional, automated market scan.
Building Your Custom Market Scans
Once your rules are defined, building the scan itself is pretty straightforward. You're essentially telling the software, "Continuously search every stock in the S&P 500 and only show me the ones that meet all three of my conditions right now."
Instead of spending hours searching, you can run your scan and get a clean, actionable watchlist in seconds. This list contains only the highest-probability candidates that fit your specific price action strategy. You've effectively filtered out 99% of the market noise, leaving only the signals that deserve your attention.
The real edge isn't just finding one setup; it's being able to systematically find every potential setup that meets your criteria across the entire market, day after day. This is how you achieve consistency and scale your trading operation.
Setting Up Real-Time Actionable Alerts
A scan gives you a list of candidates at a specific point in time, but an alert notifies you the instant a condition is met. This is crucial for time-sensitive strategies. You can set an alert to trigger the moment a stock breaks a key resistance level or when a pin bar forms on the 1-hour chart.
These aren't just simple price pings. You can create complex, multi-conditional alerts that function as your personal trading assistant, constantly monitoring the market for you.
Here’s how you might configure a real-time alert for a mean-reversion setup:
- Instrument: EUR/USD
- Timeframe: 4-Hour Chart
- Condition 1: Price must touch the lower Bollinger Band.
- Condition 2: The RSI (14) must be below 30 (oversold).
- Notification: Send a push notification to my phone and an email.
This alert will only fire when a high-probability confluence of events occurs, allowing you to step away from your screen without fearing that you'll miss a prime opportunity. By automating the tedious work of monitoring, you save countless hours and reduce the risk of emotional, impulsive decisions that come from staring at charts all day.
Adapting Your Strategy in Live Markets
Here's a hard truth: a profitable backtest is just the beginning. It's a powerful starting point, no doubt, but it's not a crystal ball for future returns. Markets are living, breathing things. They evolve.
A price action strategy that crushed it last year might suddenly start sputtering. Why? Shifts in volatility, changing liquidity, or even a new market narrative can completely alter the game. The single most important skill for long-term survival isn't finding a perfect strategy—it's learning how to adapt.
This doesn't mean you panic and ditch your entire plan at the first sign of trouble. Every winning strategy has losing streaks. That's a statistical certainty. The real trick is learning to tell the difference between a normal, expected drawdown and a sign that your edge is genuinely disappearing.
Normal Drawdown vs. a Failing Edge
This distinction is what separates the pros from the amateurs. A normal drawdown is just a dip in your equity curve that falls within the boundaries you already established in your backtest. For example, if your backtesting showed a maximum drawdown of 15%, then hitting a 10% drawdown in live trading is probably just business as usual.
A failing edge is something else entirely. It’s a systemic problem where the market's personality has changed so much that the core logic behind your setups just doesn't work anymore.
How can you spot it? Keep a close eye on these key metrics:
- Prolonged Drawdown: The hole in your account gets deeper than the worst-case scenario from your backtest, and it keeps getting worse over a decent sample of new trades.
- Decreased Profit Factor: Your profit factor dives well below your backtested average and just... stays there.
- Setup Frequency Changes: The setups you trade either start appearing way too often or they vanish completely. Both are red flags signaling a change in market character.
Think of your backtesting results as your performance baseline, not a pass/fail grade. You need to constantly compare your live trading metrics to this baseline. If you see a major, persistent deviation, it's time to put on your detective hat and figure out what's changed.
Conducting Periodic Strategy Reviews
The only way to stay ahead is to be proactive. I highly recommend getting into the habit of a formal strategy review every quarter or after every 50-100 live trades. During this review, re-run your backtest, but this time, only use the most recent data—say, the last six months. Does the edge still hold up?
Market dynamics can shift in subtle ways. For instance, one analysis of trading patterns in E-mini S&P 500 futures found that in the first quarter, certain opening range breakouts happened over 80% of the time. But by the fourth quarter of that same year, the frequency had dropped to 68%. That's a perfect example of how a pattern's effectiveness can ebb and flow, which is exactly why you need to keep validating your approach.
This re-evaluation might show that you only need a small tweak. Maybe average volatility has crept up, and you need to widen your stop-loss from 1.5x ATR to 2.0x ATR. Or perhaps one particular stock on your watchlist has stopped responding to your patterns, and it's time to bench it.
These small, data-driven adjustments are how you keep your price action strategy robust and profitable over the long haul.
Got Questions? Let’s Talk Strategy.
Even the most well-defined trading plan runs into questions when the market opens. Theory is one thing, but applying it in the real world is another game entirely. Here are some of the most common hurdles traders face when building out their price action strategy.
My goal here is to clear up the gray areas you'll encounter day-to-day. A little clarity on these points can make a huge difference in your confidence and, ultimately, your performance.
What’s the Best Timeframe to Trade?
There's no magic number here. The "best" timeframe is the one that fits your schedule and personality, period. It’s a huge myth that one is automatically more profitable than another. Profitability comes from consistency, not a specific chart duration.
A day trader might live on the 5-minute to 1-hour charts, hunting for multiple setups within a single session. On the flip side, a swing trader will likely stick to the 4-hour and daily charts. This lets them catch bigger, multi-day moves without having to be glued to their screen—perfect if you have a day job.
Higher timeframes like the daily and weekly charts act as a natural noise filter. A pattern on the daily chart carries more weight because it represents a broader consensus of market participants over a longer period. It's just a more significant event.
The key is to find a timeframe you can comfortably manage without feeling rushed. Once you've picked one, commit to it. Using a 15-minute chart for your entry but a daily chart for your overall bias is a recipe for conflicting signals and analysis paralysis. Stick to your chosen timeframe for both analysis and execution.
Can I Still Use Indicators with Price Action?
Absolutely. While a "naked" chart is the purest form of price action trading, some of the best traders I know run a hybrid approach. The secret is to treat indicators as confirmation tools, not as the primary reason to enter a trade.
Think of it this way: price is the main actor, and indicators are the supporting cast. They’re there to add context and confirm what the price is already telling you. For example, you might glance at a 20-period EMA just to quickly confirm the trend's direction before you even start looking for a specific candlestick setup.
Here's how you can blend them effectively:
- Confirming the Trend: A simple moving average, like the 50 SMA, can give you a clear visual on whether you should be looking for long or short setups. If the price is above it, you're hunting for buys. Below it, you're looking for sells.
- Adding Momentum Context: An oscillator like the RSI can be your sanity check. See a beautiful pin bar at a key resistance level? If the RSI is screaming "overbought," that adds a ton of weight to your potential trade.
The real danger is cluttering your chart with so many indicators that they start giving you conflicting signals. Keep it simple. One or two that complement what you’re already seeing in the price action is all you need.
How Many Markets Should I Follow?
When you’re just starting out, the answer is simple: specialize. Don't make the classic mistake of trying to apply a brand-new strategy to 20 or 30 different markets at once. You'll spread your attention so thin that you'll never really learn the unique personality of any single one.
A much smarter path is to master your strategy on just one or two highly liquid markets first. Pick a major forex pair like EUR/USD or an index like the S&P 500. This laser focus lets you learn its quirks, its typical daily range, and how it behaves around key levels.
Once you’ve found consistent profitability—and ideally, have your scanning process automated—then you can start slowly expanding your watchlist. Always remember: the quality of your execution on a few markets will always beat sloppy trading across many.
Ready to stop hunting for setups and let them come to you? With ChartsWatcher, you can build the custom scans and real-time alerts discussed in this guide without writing a single line of code. Stop missing opportunities and start trading with efficiency. Explore our powerful tools and find the perfect plan for your strategy at https://chartswatcher.com.
