A Trader's Guide to Market Structure Trading
Market structure trading is simply the art of reading the story the market is telling you through its price chart. It's about analyzing the sequence of highs and lows to figure out where the price is heading next—whether that's a new trend, a reversal, or just a pause. You're learning the market's language directly from the source, rather than relying on a bunch of lagging indicators to translate for you.
What Is Market Structure and Why It Matters
Imagine landing in a new city without a map. You'd see buildings and busy streets, but you wouldn't have a clue how they all connect or which way to go. That's what trading without understanding market structure feels like. You see the price zipping up and down, but it's just noise without a framework to make sense of it all.
Market structure provides that map. It’s a method that focuses on the very architecture of price movement—the constant tug-of-war between buyers and sellers that leaves a distinct footprint on your chart. At its heart, it’s all about tracking the series of swing highs and swing lows to gauge the market's current direction and conviction.
This approach cuts through the clutter of complicated indicators and gets you back to what matters: the pure narrative of price. It helps you answer the most important questions a trader can ask:
- Who's in control right now? Are the buyers pushing prices higher, or are sellers starting to take over?
- Is this trend for real? Does the current move have momentum, or is it showing signs of running out of steam?
- Where are the logical turning points? By identifying key structural levels, you can anticipate where the price is likely to react.
The infographic below perfectly captures how market structure acts as a reliable roadmap for navigating the charts.
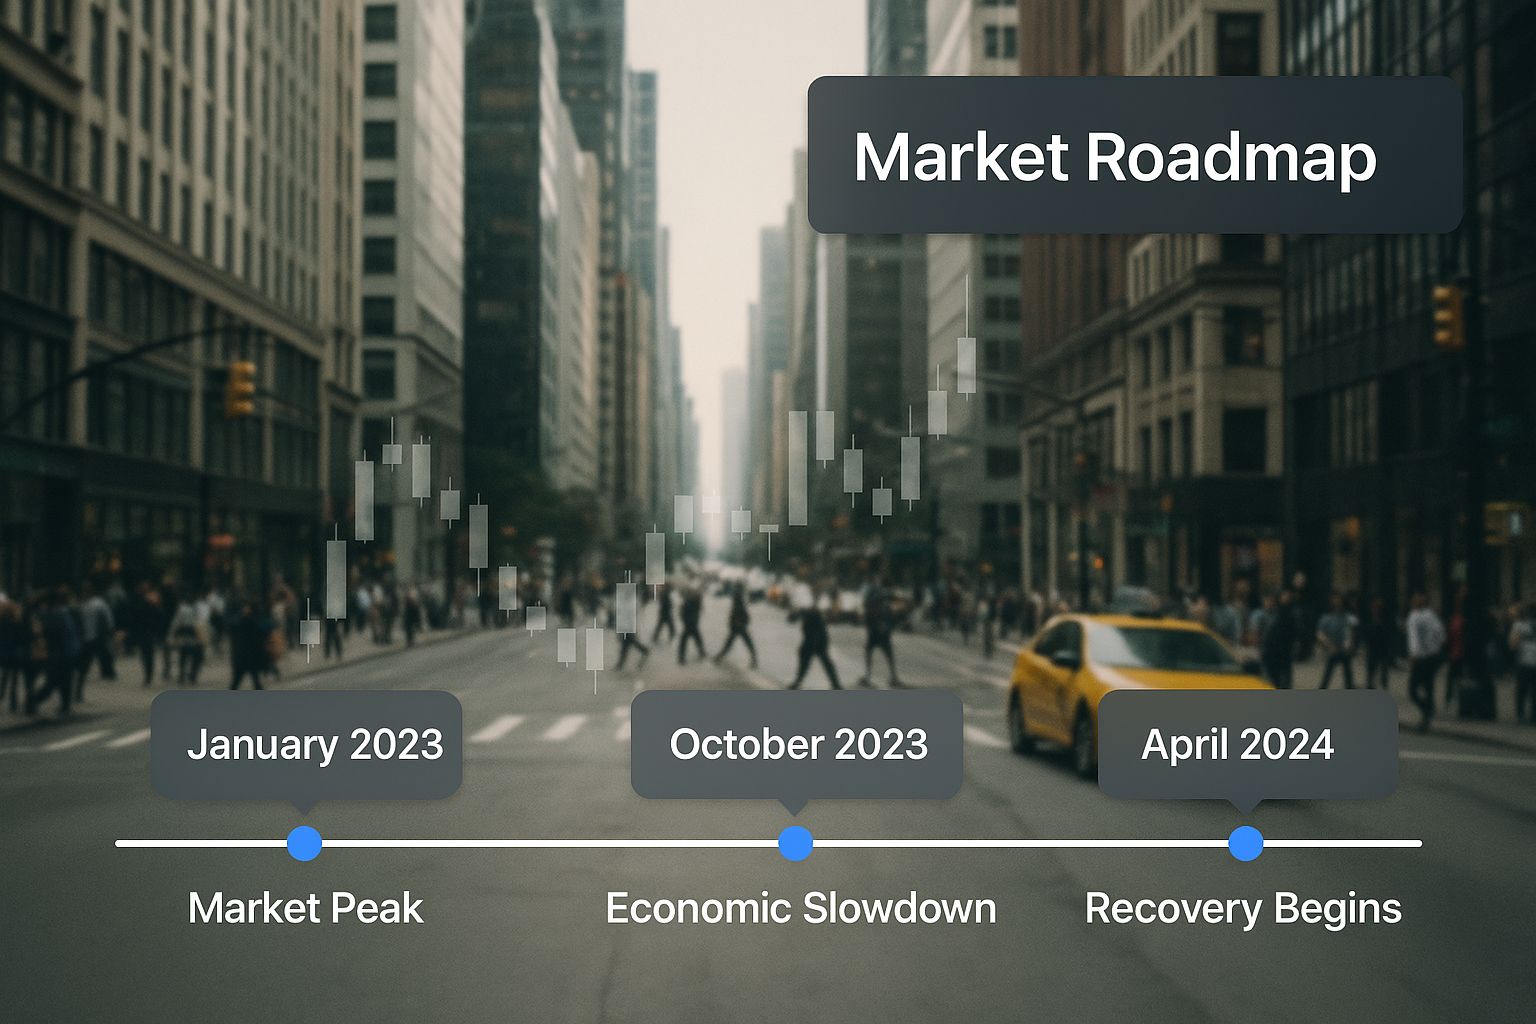
This visual shows how understanding these patterns brings clarity and direction to what can otherwise feel like a chaotic environment.
The Foundation of Informed Trading
When you learn to read market structure, you stop reacting to every little price blip and start analyzing the bigger picture. You're no longer just chasing the price; you're interpreting the story it tells, which is a critical skill in massive, fast-moving arenas like the global forex market. To put it in perspective, the daily turnover in the FX market hit a jaw-dropping $7.5 trillion in April 2022. You can get the full rundown on those numbers from the Bank for International Settlements survey.
Market structure is the plot of the market's story. The trend is the main storyline, pullbacks are the plot twists, and reversals are the dramatic climax. Your job as a trader is to read the plot and position yourself for the next chapter.
Ultimately, market structure trading is about aligning your strategy with the true flow of capital. You're making decisions based on the underlying behavior driving the price, which gives you a solid and logical foundation to build a consistent trading approach.
Understanding the Four Phases of Market Cycles

Markets are never static; they move with a rhythm, almost like breathing. This rhythm unfolds in a predictable cycle of four distinct phases. Recognizing which phase the market is in is a cornerstone of market structure trading, as it gives you the big-picture context for all the price action you see on the chart.
Think of these phases as chapters in a story. Each one has its own unique characteristics and emotional tone, and understanding them helps you anticipate what might happen next. By learning to identify these stages, you can stop just reacting to price and start anticipating its next major move.
Phase 1: Accumulation — The Quiet Before the Storm
The accumulation phase is where a market bottom begins to form. After a long, painful downtrend, the panic selling finally dries up, and the price starts to drift sideways in a range. This is the "quiet" period, but don't be fooled—beneath the surface, a major power shift is happening.
During accumulation, informed traders and large institutions—the so-called "smart money"—begin to buy assets. They do this quietly, soaking up the last of the sell orders from retail traders who are either giving up or are still convinced the downtrend will continue. On a chart, this just looks like a boring, directionless consolidation.
Key characteristics include:
- Ranging Price Action: The price gets trapped between a clear support and resistance level.
- Decreasing Volatility: The wild swings of the previous downtrend start to calm down.
- Subtle Bullish Signs: You might notice the price is no longer making significant new lows within the range.
This phase is like a predator gathering energy before the hunt. The market is coiling, building up the buying pressure that will eventually fuel the next big move up.
Phase 2: Markup — The Bullish Trend Emerges
The markup phase is the explosive result of all that buying pressure built during accumulation. This is the classic uptrend that most traders dream of catching. Once the smart money has built their positions and the sellers are exhausted, the price breaks out of the accumulation range, often with a ton of force.
This is where you'll see that signature pattern of bullish market structure: higher highs (HH) and higher lows (HL). Every pullback is met with fresh buying interest, pushing the price to new heights. Public sentiment finally turns optimistic, and retail traders who missed the bottom start piling in, adding even more fuel to the fire.
"The Markup phase is where the trend becomes obvious to everyone. The goal of market structure trading is to have already identified the potential for this phase during the quiet of Accumulation."
This sustained upward march is where the majority of profits are made on long positions. It's a clear signal that buyers are firmly in control.
Phase 3: Distribution — The Tense Peak
Just as accumulation forms a market bottom, the distribution phase forms a market top. After a powerful markup, the buying momentum starts to sputter out. The same smart money that bought during accumulation now begins to systematically sell—or "distribute"—their positions to the enthusiastic but late-to-the-party retail crowd.
Much like accumulation, this phase looks like sideways, range-bound price action. The crucial difference is the context; it happens after a huge run-up. The first signs of weakness appear here, as the price struggles to make new highs and starts looking exhausted.
Phase 4: Markdown — The Inevitable Decline
The markdown phase is the downtrend that follows the distribution period. Once the big players have offloaded their positions, there isn't enough buying pressure left to hold the market up, and it starts to collapse under its own weight. The price breaks below the distribution range, and panic begins to set in.
This phase is the mirror image of the markup, defined by a clear pattern of lower highs (LH) and lower lows (LL). It confirms that sellers have wrestled control away from the buyers. This entire cycle shows why understanding market structure is so powerful; it provides a logical framework for why markets behave the way they do. To dive deeper, you can explore our detailed guide on mastering market cycle analysis for smarter trades.
The speed of these cycles has also accelerated. By 2025, it's anticipated that over 90% of all trades will be executed electronically, a massive jump from just 65% in 2010. This tech shift has dramatically cut transaction costs and sped up the flow between these market phases.
How to Spot Key Structural Points on a Chart

Moving from theory to the trading floor requires a trained eye. To really succeed with market structure trading, you have to learn to read a chart like a map, spotting the critical landmarks that show you where the price has been and hint at where it might go next.
This skill is what turns a chaotic jumble of candles into a coherent story of supply and demand. The first step? Learning to pinpoint the absolute cornerstones of price action: the peaks and valleys.
Pinpointing Swing Highs and Swing Lows
Think of a bouncing ball. Every time it hits its peak height before falling, that's a Swing High. Every time it hits the ground before launching back up, that’s a Swing Low. These points are the visible skeleton of any trend, created by temporary shifts in momentum.
- Swing High (SH): This is a peak in price, usually a candle that has lower highs on both its immediate left and right. It’s where buying pressure fizzled out and sellers took over, even if just for a moment.
- Swing Low (SL): This is a valley in price, a candle with higher lows on both sides. It marks a spot where sellers ran out of steam, and buyers stepped back in to drive the price up.
Don't chase perfection here. The goal is to recognize the significant turning points that define the overall flow of the price. Once you can consistently spot these, you can start connecting the dots to understand the market's direction and strength.
The Two Most Powerful Signals: Break of Structure and Change of Character
With swing points on your map, you can now start to decipher the market's intentions through two incredibly powerful events: the Break of Structure (BOS) and the Change of Character (CHoCH).
A Break of Structure (BOS) is a confirmation. In a clear uptrend, when the price pushes decisively above a previous swing high to form a new higher high, that's a BOS. It tells you buyers are still firmly in control, and the trend is healthy. The market is basically shouting, "Full steam ahead!"
A Change of Character (CHoCH), on the other hand, is your first major warning flare. In that same uptrend, a CHoCH happens when the price fails to make a new high and instead breaks below the most recent higher low. It doesn't guarantee a reversal, but it's a critical sign that the trend is losing momentum. The market is whispering, "Hey, something's different here."
A BOS confirms the story you're already following. A CHoCH suggests a major plot twist is coming. Mixing them up is one of the costliest mistakes you can make.
Uncovering Institutional Footprints
Ready to go deeper? Advanced market structure trading means looking for the footprints left behind by the big players—the institutions. Two of the most important clues they leave are order blocks and fair value gaps. These areas often act like price magnets.
1. Order Blocks (OB) An order block is usually the last opposing candle right before a strong, explosive move. For example, a bullish order block is the last down-candle just before a powerful surge up that breaks structure. These zones are where institutions likely placed huge clusters of orders. Price often revisits these zones to mitigate those old positions, creating high-probability entry points for sharp traders. They work a lot like traditional support and resistance, which you can read more about in our trader's guide to stock support and resistance.
2. Fair Value Gaps (FVG) Also known as an imbalance, a fair value gap is a three-candle pattern where you can see a visible gap between the first candle's high and the third candle's low. This signals an aggressive, one-sided move that left an inefficiency in the market. Price has a natural tendency to swing back into these gaps to "rebalance" the action, making them prime targets for entries or take-profit levels.
By combining the analysis of swing points, BOS/CHoCH signals, and these institutional footprints, you build a complete visual toolkit. This structured approach lets you move beyond just recognizing simple patterns and start trading based on the logical flow of the market itself.
Building a Cohesive Market Structure Trading Plan
So far, we’ve learned the vocabulary of the market—swing points, breaks of structure, and institutional zones. Now it’s time to put those words together and tell a story. This is where we assemble all the pieces into a powerful, repeatable, and actionable trading plan.
Think of a solid plan as the bridge between simply spotting things on a chart and achieving consistent results. It turns interesting observations into a methodical process for executing trades and managing risk. Without a plan, you're just guessing. With one, you're operating like a professional.
This framework is designed to take the emotion and guesswork out of your trading. It gives you a clear checklist for every potential setup, ensuring you’re not just taking random stabs at the market but are systematically targeting high-probability opportunities that align with the market’s underlying narrative.
Start with the Big Picture Using Multi-Timeframe Analysis
One of the biggest traps traders fall into is getting tunnel vision on a single chart. A beautiful bullish trend on the 15-minute timeframe might just be a tiny blip—a minor pullback—within a massive bearish trend on the 4-hour chart. To avoid getting run over, you have to use multi-timeframe analysis.
It’s like using a satellite to see the entire landscape before zooming in on a specific street. The higher timeframe (HTF), like the Daily or 4-Hour, tells you the main story—the overall market direction and context. The lower timeframe (LTF), like the 1-Hour or 15-Minute, is where you hunt for precise entries that line up with that bigger picture.
Your process should always flow from the top down:
- Establish the Higher Timeframe (HTF) Trend: Is the market making higher highs and higher lows (bullish), or lower highs and lower lows (bearish)? This is your directional bias. Don’t fight it.
- Identify HTF Key Levels: Mark out the big swing points, order blocks, and fair value gaps on this macro chart. These are the zones where you expect the smart money to step in and cause a reaction.
- Zoom into the Lower Timeframe (LTF) for Execution: Once the price taps into a key HTF level, drop down to your execution timeframe. This is where you’ll patiently wait for a lower timeframe Change of Character (CHoCH) that signals a potential reversal in your favored direction.
Identifying and Qualifying A-Grade Setups
Let's be clear: not all trade setups are created equal. An A-grade setup is one where multiple factors stack up in your favor, significantly boosting the probability of a win. Your trading plan needs strict, non-negotiable criteria for what qualifies as an opportunity worth your capital.
A high-probability setup almost always combines these elements:
- Alignment with HTF Bias: The trade direction absolutely must match the trend on your higher timeframe. No exceptions.
- Reaction at a Key HTF Level: The setup must originate from a significant zone of interest, like a daily order block or a major swing low. Price isn't just turning around in the middle of nowhere.
- Clear LTF Confirmation: You need to see a distinct Break of Structure or Change of Character on your lower timeframe. This is the market tipping its hand and confirming your entry idea.
A truly cohesive plan doesn't just tell you when to get in; it forces you to wait for the market to prove your thesis is correct. Patience is built directly into the system.
Defining Your Entry Triggers and Risk Management
Once an A-grade setup materializes, your plan needs exact rules for how you get in and, more importantly, how you get out. This is where all guesswork is eliminated. Two of the most common approaches are aggressive and conservative entries.
We'll break down the pros and cons to help you decide which one fits your personality.
Comparing Entry Models in Market Structure Trading
An analysis of two primary entry techniques, highlighting their respective pros and cons to help you select the method that best fits your trading style.
| Feature | Aggressive Entry (On Breakout) | Conservative Entry (On Retest) |
|---|---|---|
| Trigger | Entering immediately as price breaks a key structural level (the BoS or CHoCH). | Waiting for price to break structure, then return (retest) to the origin of that move (e.g., an order block). |
| Pros | • You won't miss the move if price takes off without a pullback. • Simple and direct trigger. | • Often provides a much better risk-to-reward ratio. • Higher confirmation that buyers/sellers are in control. |
| Cons | • Prone to "fakeouts" where price reverses right after breaking. • Wider stop-loss is often required. | • Price doesn't always retest, so you can miss trades entirely. • Requires more patience to wait for the pullback. |
| Best For | Traders who prioritize not missing a move and are comfortable with a lower win rate. | Traders who prioritize high R:R setups and are willing to miss some trades to get better entries on others. |
Deciding between these models is a personal choice based on your risk tolerance and psychology. There's no single "best" way; the best way is the one you can execute consistently.
Setting Your Stops and Targets
Now for the most critical part: risk.
Setting the Stop-Loss Your stop-loss should never be based on an arbitrary dollar amount. In market structure trading, it has to be placed at a logical point that invalidates your trade idea. For a long position, that means setting your stop just below the swing low that kicked off your entry signal. If the price breaks that low, your reason for entering is gone. Simple as that.
Planning the Exit Profitable exits are just as important as good entries. You need to know where you're taking profits before you even click the buy button. Common targets include:
- The next major liquidity pool (an obvious old high or low).
- A significant higher timeframe fair value gap.
- The next opposing structural level (e.g., a bearish order block for a long trade).
Of course, a truly comprehensive plan looks beyond just the charts. It's smart to think about the financial implications of your success. For example, once you're consistently profitable, you'll want to learn how to minimize your tax liability on capital gains. Building a complete trading plan means thinking through the entire process, from market analysis all the way to managing your earnings, creating a robust system for long-term growth.
Avoiding Common Pitfalls in Market Structure Analysis
Knowing the textbook rules of market structure is one thing. Applying them correctly when real money is on the line and the charts are moving fast? That’s a whole different ball game. Plenty of developing traders fall into the same predictable traps, and this section is your guide to sidestepping them before they hit your account.
Great market structure analysis isn’t just about drawing lines on a chart. It requires discipline, a healthy respect for context, and the patience to wait for the market to show its hand. Let's break down the most common mistakes and give you some simple, rule-based ways to avoid them.
Confusing Liquidity Grabs with True Structural Breaks
This is probably the most common—and costly—mistake in the book. A trader sees price poke above a previous high, assumes it's a Break of Structure (BOS), and jumps into a long position, only to get stopped out as price aggressively reverses.
What they just fell for was a liquidity grab (also called a stop hunt). It’s a quick spike designed to trigger all the stop-loss orders resting just above an old high or below an old low. A true BOS, on the other hand, is a decisive move that closes with a strong candle body beyond the level, signaling real momentum.
To stay out of this trap, you need to demand confirmation from the market:
- Wait for the candle to close. This is non-negotiable. A wick piercing a level means nothing; a solid candle body closing beyond it is what signals intent. Never act on a break while the candle is still wiggling around.
- Look for follow-through. A real break is usually confirmed when the next candle continues in the same direction. A liquidity grab? That's often followed by an immediate, sharp reversal candle in the opposite direction.
"The market loves to fake out traders at obvious highs and lows. Your job is to wait for proof that the move is real, not just an attempt to engineer liquidity before reversing."
This simple act of waiting can be the difference between getting caught in a fakeout and riding a confirmed trend.
Fighting the Higher Timeframe Trend
Another critical error is getting tunnel vision on a lower timeframe. You might spot a picture-perfect bullish setup on the 15-minute chart, but if the 4-hour and daily charts are screaming bearish, your setup is probably doomed to fail. It’s like trying to swim upstream against a powerful river current.
The solution is to bake a top-down analysis into your trading routine. Always start your analysis on a higher timeframe (like the daily or 4-hour) to establish your overall directional bias. Are the big players buying or selling?
Only after you’ve answered that question should you drop to a lower timeframe to pinpoint an entry. If the higher timeframe trend is bearish, you should only be hunting for short setups on your execution timeframe. Simple as that.
Suffering from Analysis Paralysis
In an effort to be thorough, many traders end up with charts that look like a tangled mess of lines, zones, and indicators. The result? Analysis paralysis. With so many conflicting signals, making a clear, confident decision becomes impossible.
A clean chart promotes clear thinking. Here’s how to declutter:
- Identify only the most significant structural points. Don’t mark every minor wiggle. Focus on the major swing highs and lows that are clearly defining the current trend.
- Mark only fresh, unmitigated zones. An order block that price has already dipped into multiple times has lost its power. Prioritize the clean, obvious levels that haven't been tested yet.
Your goal isn't to map out every single possibility. It's to identify the handful of high-probability zones where a reaction is most likely. A clear chart leads to decisive action, which is the bedrock of successful market structure trading.
Frequently Asked Questions About Market Structure
Even after you get the hang of the core concepts, jumping into market structure trading will stir up a lot of questions. That’s perfectly normal. The idea here is to give you clear, straight answers to the things traders ask most, helping you build the confidence to actually use this stuff on a live chart.
Think of this section as a quick chat with a mentor, designed to clear up those tricky little details that often trip people up when they move from theory to practice.
How Does Market Structure Compare to Indicator-Based Trading?
This is a big one, and a question almost every trader wrestles with. At its core, market structure trading is pure price action analysis. You're reading the raw story of supply and demand straight from the chart itself. It’s a "leading" approach because you're reacting to what the price is doing right now.
On the other hand, most popular indicators like the RSI (Relative Strength Index) or MACD (Moving Average Convergence Divergence) are "lagging." They are just mathematical formulas based on past price data. They don't predict what's coming; they only reflect what has already happened.
Here's an analogy: reading market structure is like reading the book yourself, picking up on every plot twist and subtle bit of foreshadowing. Relying only on indicators is like reading a book summary someone else wrote—you get the general idea, but you miss all the rich context that really tells the story.
Many experienced traders feel market structure gives them a much cleaner, more direct read on the market's real intentions. They might use indicators, but not to initiate a trade. Instead, they're used as a secondary source of confirmation for a decision they've already made based on the structure.
It really boils down to this: Market structure tells you what the market is doing, while lagging indicators tell you what it has done. For proactive trading, knowing what's happening now gives you a massive edge.
Can I Use Market Structure on Any Timeframe or Asset?
Absolutely. This is one of the most powerful things about it. The principles of supply and demand that create the patterns we see—highs, lows, trends, and ranges—are fractal. This just means the same structural patterns show up over and over again on every timeframe, from a one-minute chart right up to a monthly one.
This universal quality is what makes learning market structure such a versatile skill. The framework you use stays the same whether you're:
- Day trading crypto on the 5-minute chart.
- Swing trading Forex pairs on the 4-hour chart.
- Investing in stocks based on the weekly chart.
The core job of spotting higher highs, lower lows, breaks of structure, and changes of character never changes. You're developing a single, robust analytical skill that you can apply to any market you decide to trade, today or ten years from now.
What Is the Most Critical Concept to Master First?
If you could only nail down one concept to start, make it this: learning to clearly and confidently tell the difference between a Break of Structure (BOS) and a Change of Character (CHoCH). On a chart, they can look almost identical, but they mean the exact opposite.
A BOS is your confirmation signal. It tells you the current trend is healthy, strong, and likely to keep going. It’s the market giving you a green light to stick with the trend. In an uptrend, for instance, a BOS happens when the price pushes above the previous high.
A CHoCH, on the other hand, is your earliest warning sign. It’s the first hint that the trend is running out of steam and might be about to reverse. Think of it as the market waving a yellow flag, telling you to be cautious. In that same uptrend, a CHoCH would happen if the price broke below the most recent higher low.
Mistaking a liquidity grab for a real BOS or thinking a CHoCH is just a minor pullback are two of the most common—and most expensive—mistakes new traders make. Pour your initial practice time into mastering the context and nuance between these two structural points. It will dramatically improve your ability to read the market’s true intentions and get positioned for what's likely to happen next.
Ready to stop guessing and start seeing the market with professional clarity? ChartsWatcher provides the powerful scanning and charting tools you need to spot high-probability market structure setups in real-time. Customize your dashboards, set precise alerts on key structural levels, and take your trading analysis to the next level. Start your free trial at ChartsWatcher today.
