Bollinger Band Squeeze: Unlock Hidden Trading Opportunities
Why Market Calm Signals Coming Storms
 Picture a powerful spring being slowly pushed together. The more it's compressed, the more explosive its eventual release. Financial markets behave in a surprisingly similar way, storing and releasing energy. Those quiet periods of low volatility and sideways trading aren't boring; they often signal the market is gathering strength for its next major move. This is why seasoned traders pay close attention when the market goes quiet—they know the calm often precedes a storm of opportunity.
The Psychology of Consolidation
So, what’s really going on during these quiet phases? Think of it as a tense standoff between buyers and sellers. For a time, they are in a near-perfect balance, with neither side having the power to push the price in a clear direction. This tug-of-war creates a temporary equilibrium, causing the trading range to tighten.
This period of consolidation can be frustrating for impatient market participants, often causing them to close their positions. This shakeout is actually a positive sign, as it clears out the indecision and sets the stage for a cleaner, more powerful trend once one side finally gains control.
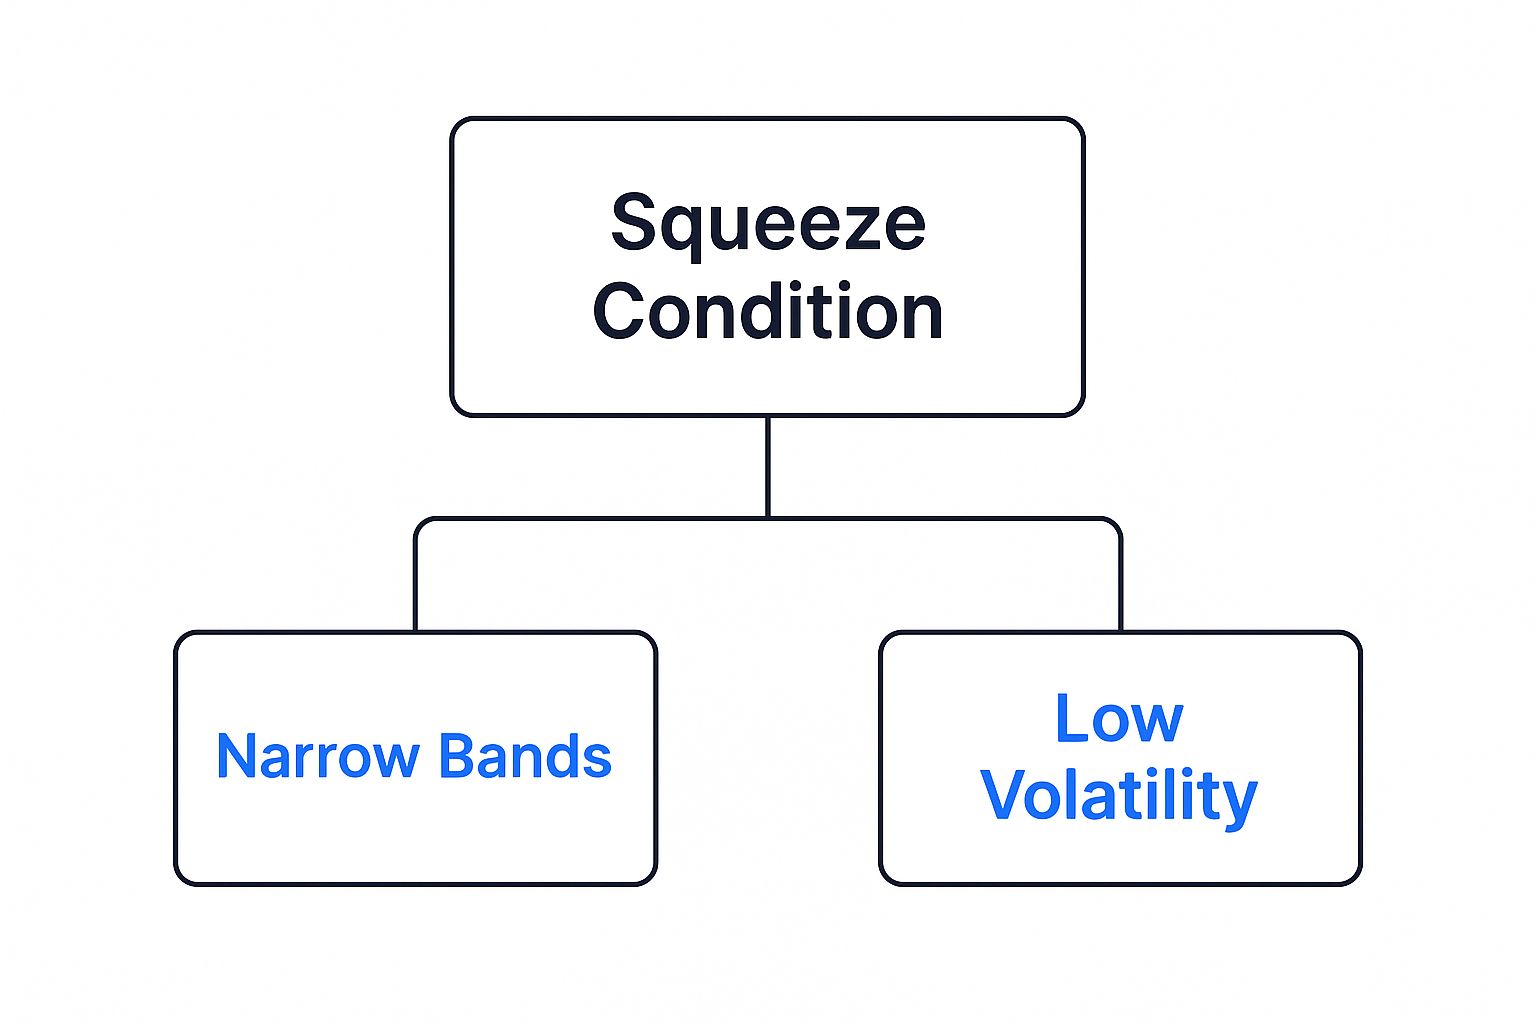
Identifying a Genuine Squeeze
This market compression is perfectly captured by a technical pattern known as the Bollinger Band Squeeze. This strategy helps traders spot these exact moments when the bands narrow significantly, signaling that volatility has fallen to an extreme low and a price surge could be just around the corner. It is especially useful for pinpointing sharp, short-term moves and potential entry points.
For example, a common rule of thumb is that a breakout is likely when the bands’ width shrinks to less than 4% of the asset's price. You can explore the mechanics of this strategy in depth to learn more. This measurable signal helps you distinguish a true, energy-building squeeze from random, directionless price action.
Preparing for the Breakout
Seeing a squeeze develop is your cue to get ready, not to jump in blindly. This is the moment to create a solid trading plan. Using a platform like ChartsWatcher, you can set specific alerts for when the price breaks above the upper band or falls below the lower one. This ensures you're poised to act the moment the breakout happens.
This is also a critical time to ensure your entire trading setup is reliable. When you’re focused on the markets, it's important not to overlook digital security. Understanding concepts like video conferencing security can help build better online safety habits across all your activities. This preparation allows you to execute your plan with confidence when the coiled spring of the market finally unleashes its energy.
Understanding the Math Behind Market Compression
To effectively use the Bollinger Band Squeeze, you don't need to be a mathematician, but you do need to grasp how it measures market pressure. Think of it like a spring coiling tighter and tighter before it releases—the squeeze is a visual representation of this stored energy.
The engine behind this concept is standard deviation. This is simply a statistical tool that measures how spread out prices are from their average. When price action is calm and trades in a tight range, the standard deviation is low. When prices are swinging wildly, the standard deviation is high, and the squeeze happens when that deviation value hits a significant low.
The Core Components of the Squeeze
Bollinger Bands are built from three simple lines. The middle line is a 20-period simple moving average (SMA), which represents the recent average price—a sort of "center of gravity" for the asset. The outer bands are then placed two standard deviations away from this moving average, which is the most common setting used by traders.
A great way to visualize this is to think of the SMA as the main road and the outer bands as flexible guardrails.
- During periods of low volatility, when prices are stable, the guardrails move closer together.
- During periods of high volatility, when prices are making big moves, the guardrails expand outward to contain the action.
A true Bollinger Band Squeeze happens when these guardrails become unusually narrow. This tells you that the market is consolidating and building up energy for its next major move, either up or down.
Measuring the Squeeze for Trading Signals
While you can often spot a squeeze just by looking at the chart, a more objective method is to measure the distance between the bands. Charting tools like ChartsWatcher include a dedicated indicator called Bollinger Band Width for this exact purpose.
This indicator takes the distance between the upper and lower bands and plots it as a simple line graph. When this line falls to a multi-month or even yearly low, it’s a powerful confirmation that volatility has dried up and the market compression is reaching a critical point. This data-driven signal helps you distinguish between aimless sideways trading and a genuine, high-potential breakout setup.
Before we look at a visual example, it’s helpful to understand how these settings can be adapted. While the standard 20-period SMA with 2 standard deviations is a great starting point, different traders may adjust these parameters to fit their specific timeframe and strategy.
Bollinger Band Squeeze Settings Comparison
Different timeframes and parameter settings for optimizing squeeze identification across various trading styles
| Timeframe | Period Setting | Standard Deviation | Best For | Typical Squeeze Duration |
|---|---|---|---|---|
| Daily | 20 | 2 | Swing Traders | Several weeks to months |
| 4-Hour | 20 | 2 | Short-term Swing Traders | Several days to a week |
| 1-Hour | 20 | 2 | Intraday Traders | Several hours to a day |
| 15-Minute | 20 or 15 | 2 or 1.5 | Scalpers & Day Traders | 30 minutes to a few hours |
As you can see, the core settings remain consistent across most styles, highlighting their robustness. The primary adjustment often comes down to the timeframe you are watching, which naturally changes the duration of a typical squeeze.
The relationship is straightforward, as the diagram shows. A squeeze isn't a random event; it's the direct result of low market volatility causing the bands to contract. Recognizing this clear mathematical link is what allows traders to identify setups with real potential and avoid getting tricked by meaningless sideways price action.
Spotting High-Probability Squeeze Setups
Just because the Bollinger Bands are tightening doesn't automatically mean a huge price move is coming. Many squeezes end up being duds, fizzling out into more sideways price action and trapping traders who jumped in too early. The real art of trading a Bollinger Band Squeeze is learning to tell the difference between these false starts and the truly explosive setups. This skill means looking beyond the bands themselves to understand the market’s underlying story.
Volume: The Fuel for the Breakout
Think of volume as the fuel in a rocket. The most powerful breakouts need a full tank. While volume naturally tends to decrease during a consolidation period, indicators like On Balance Volume (OBV) can give you a peek under the hood to see what the "smart money" is up to.
Imagine a stock's price is moving sideways, but its OBV is steadily climbing. This is a powerful clue that buyers are quietly accumulating shares. This growing imbalance creates tension that often explodes in an upward breakout. A great example was the squeeze in Intuit (INTU) in September, which came right before a sharp price jump. During the consolidation, its OBV kept rising, signaling accumulation and dramatically improving the odds of a move higher. This shows the power of combining indicators for deeper insights.
Context Is King: The Broader Market Trend
A squeeze pattern never exists in isolation; its potential is directly tied to the bigger market trend. A squeeze that forms after a strong uptrend is much more likely to resolve to the upside, essentially acting as a pause before the next leg up.
On the other hand, trying to trade a long breakout from a squeeze when the overall market is in a clear downtrend is like trying to swim against a powerful current. You should always ask: Is this consolidation just a brief rest, or is it a potential reversal? Using tools in ChartsWatcher to look at the daily and weekly charts gives you this essential context.
Patience and Confirmation
Finally, trading squeezes successfully requires a huge amount of discipline. Instead of chasing every pattern where the bands look a little tight, you should wait for a confluence of factors to align in your favor. High-probability setups typically share these characteristics:
- Historically Low Band Width: The bands are not just tight; they are at or near their narrowest point over several months.
- Volume Confirmation: An indicator like OBV clearly shows that big players are either accumulating (for a long trade) or distributing (for a short trade).
- Alignment with Trend: The setup is moving in the same direction as the primary, longer-term trend.
Many traders use specialized tools to spot these conditions automatically. The TTM Squeeze indicator, for instance, is built specifically to find these periods of stored energy. For those who want to learn more, you can check out our guide on the TTM Squeeze indicator here.
Ultimately, patience is your most valuable tool. Waiting for these A+ setups to form, rather than forcing trades on mediocre patterns, is what separates consistently profitable traders from the rest. This discipline protects your capital for the truly outstanding opportunities.
Predicting Breakout Direction Before It Happens
Spotting a tight Bollinger Band Squeeze is the easy part. The real million-dollar question is: which way will the price go? While you could just wait for the price to make its move, savvy traders look for clues to anticipate the breakout's direction. They don't rely on guesswork; they act like detectives, gathering evidence from volume, momentum, and the overall trend to build a strong case for a move up or down.
This process turns a reactive "wait-and-see" approach into a proactive, evidence-based strategy.
Reading the Volume Story
Think of volume as the fuel for any significant price move. During a squeeze, volume often quiets down as the market consolidates. However, a powerful tool like On Balance Volume (OBV) can reveal what's happening beneath the calm surface. OBV is simply a running total of volume that adds volume on up days and subtracts it on down days.
Imagine a stock's price is moving sideways, trapped in a narrow range. If the OBV indicator is steadily climbing, it's a huge tell. It suggests that buyers are quietly accumulating shares, building their positions before the big move. This quiet buying pressure is like compressing a spring, building up tension for a potential breakout to the upside.
On the flip side, if OBV is drifting lower while the price is flat, it suggests sellers are subtly distributing their shares. This is a bearish sign, hinting that the eventual breakout is more likely to be to the downside.
Listening to Momentum Indicators
Momentum indicators are like a stethoscope for the market's internal health. They can often detect shifts in buying or selling pressure before they become obvious in the price action itself. The Relative Strength Index (RSI) and the Moving Average Convergence Divergence (MACD) are two excellent tools for this job.
A key signal to watch for is a divergence between the price and the RSI. This is when the price and the indicator start telling two different stories.
- Bullish Divergence: The price might dip to a slightly lower low during the squeeze, but the RSI makes a higher low. This shows that the downward push is losing steam and sellers are getting exhausted—a classic bullish clue.
- Bearish Divergence: Conversely, if the price inches to a higher high but the RSI charts a lower high, it suggests the upward momentum is fading, giving an edge to the bears.
The MACD can also offer an early heads-up. A bullish crossover, where the faster MACD line crosses above its slower signal line in the final stages of a Bollinger Band Squeeze, suggests that buying pressure is just beginning to awaken.
The Overlooked Power of Market Context
Finally, no single indicator should ever be trusted in a vacuum. The most critical clue is often the market's broader context. You have to zoom out and see the bigger picture. A squeeze that forms in the middle of a powerful, established uptrend is usually just a continuation pattern—a brief pause before the price resumes its climb.
However, a squeeze that forms after a long rally, right up against a major historical resistance level, could be the setup for a significant reversal to the downside.
This is where a platform like ChartsWatcher becomes incredibly useful. It allows you to flip between different timeframes effortlessly. By analyzing the weekly or monthly chart, you gain the necessary context to correctly interpret the squeeze happening on the daily chart. By combining these directional clues—volume, momentum, and trend—you can move from simply reacting to a breakout to anticipating it with far greater confidence.
Turning Squeeze Signals Into Profitable Trades
 Spotting a high-probability Bollinger Band Squeeze is an exciting moment for any trader, but it's only half the battle. The real skill is in the execution—turning that potential energy into a well-managed and profitable trade. This is where a clear plan, discipline, and a solid grasp of risk management become your most valuable tools. The fundamental choice you face is when to act: do you enter aggressively while the market is still quiet, or do you wait for a definitive signal that the move has begun?
Entry Strategies: Anticipation vs. Confirmation
How you choose to enter a squeeze trade says a lot about your personal trading style and risk tolerance. An aggressive trader might enter during the squeeze, using other clues to anticipate the breakout's direction. This approach offers the highest potential reward since you get in before the big price swing, but it also carries the greatest risk of being wrong-footed by a "head fake" if the breakout fizzles or moves against you.
On the other hand, a more conservative method is to wait for confirmation. This means waiting for a price candle to close clearly outside one of the Bollinger Bands. For instance, you would only place a buy order after a full candle has formed and closed above the upper band. While you might sacrifice the very first part of the move, your trade has a higher probability of success because the market has already tipped its hand.
Managing Risk: Stop-Losses and Position Sizing
No trading strategy is immune to losses, and false breakouts are a part of the game. Your stop-loss is your non-negotiable safety net. A frequent error is setting it too close to your entry, which can get you knocked out of a good trade by normal market fluctuations. A more effective strategy is to place your stop on the opposite side of the recent consolidation. For a long trade, that could be just below the lower Bollinger Band or under the last swing low within the squeeze.
This decision directly influences your position size. A wider stop-loss requires a smaller position to keep your risk consistent, such as risking no more than 1% of your total account balance on a single trade. This discipline is essential for protecting your capital and ensuring that one bad trade doesn't derail your progress.
To help you understand the trade-offs between different execution styles, the table below outlines a few common approaches.
Squeeze Trading Entry and Exit Methods
Comparison of different approaches to entering and exiting Bollinger Band Squeeze trades with their risk-reward profiles
| Strategy Type | Entry Method | Stop Loss | Profit Target | Win Rate | Risk Level |
|---|---|---|---|---|---|
| Aggressive | Enter during squeeze | Outside opposite band | Open / Trailing Stop | Lower | High |
| Conservative | Wait for candle close | Below breakout candle | Fixed R:R (e.g., 2:1) | Higher | Medium |
| Balanced | Enter on initial poke | Below recent swing low | Next resistance level | Medium | Medium |
As the table shows, a more aggressive strategy might offer bigger wins but with a lower frequency, while a conservative approach aims for more consistent, albeit smaller, gains.
Profit-Taking Strategies
Knowing when to take profits is just as crucial as knowing when to enter. Greed can quickly turn a winning trade into a losing one if you overstay your welcome. A straightforward method is to set a profit target based on a risk-to-reward ratio, such as aiming for a profit that is twice the amount you initially risked.
Another effective technique is using a trailing stop. This type of order automatically moves your stop-loss up as the price rises, locking in profits along the way while still giving the trade space to grow. Ultimately, your exit should be part of your pre-defined plan, not an emotional decision made in the heat of the moment. To go deeper, you can learn more about building a complete breakout trading strategy in our detailed guide.
What the Numbers Actually Tell Us
 Knowing how to spot and trade a pattern is one thing, but a strategy's true worth is measured by its real-world performance. The Bollinger Band Squeeze is often talked about as a high-probability setup, but we need to look past the hype and see what the data says. An honest look means digging into backtesting results to find out where this strategy truly excels and, just as importantly, where it tends to fail.
Market Conditions and Strategy Performance
The success of a squeeze isn't guaranteed; it heavily depends on the market's personality at that moment. The strategy performs best in assets that move in clear cycles of quiet consolidation followed by powerful trends. Think of it like a coiled spring. When a stock is already in a strong uptrend, a squeeze often acts as a pause before the next launch upward.
On the other hand, in choppy, sideways markets with no clear direction, the spring is weak. These squeezes can lead to frustrating false breakouts, where the price inches out of the bands only to snap back, slowly chipping away at a trader's capital.
This is where historical backtesting becomes so valuable. Studies on the Bollinger Band Squeeze have repeatedly tested its performance across different market types. Statistics from these tests consistently show that the strategy is most reliable for catching big moves that start from periods of low volatility. While the exact numbers can differ, the data confirms its strength in identifying these explosive shifts. You can explore detailed insights from these historical tests here.
Setting Realistic Expectations
It’s critical to approach the Bollinger Band Squeeze with a dose of realism. No trading setup works 100% of the time, and this one is no different. A realistic win rate for this strategy often falls between 40% and 60%. The final number depends on the specific market, the timeframe you're trading, and your skill in picking the best setups.
Success isn't just about winning more often than you lose. It relies on a positive risk-to-reward ratio, ensuring that your profitable trades are significantly larger than your losing ones. This way, even with a modest win rate, your account can grow over time.
Parameter adjustments are also a big part of the puzzle. Using a tool like ChartsWatcher allows you to backtest different moving average lengths or standard deviation settings to see what works best for a specific asset. This type of disciplined analysis is what builds a solid foundation for long-term trading. If you decide to document and share your findings, you can sharpen your message by following proven blog post writing tips to present your analysis effectively.
Advanced Techniques and Costly Mistakes to Avoid
Getting past the basic definition of a Bollinger Band Squeeze is where the real work begins. True success isn’t about just spotting a squeeze; it's about knowing which one to act on and how to manage it from start to finish. This involves adding more layers to your analysis and, just as importantly, learning to dodge the common psychological traps that trip up most traders.
Combining Indicators for Higher Conviction
A squeeze signal gets a massive boost in credibility when the bigger picture agrees. This is why multi-timeframe analysis is so vital. Think of it like this: a squeeze on the daily chart is interesting, but if the weekly chart also shows a strong trend or a similar quiet period, you're stacking the odds firmly in your favor.
Additionally, you should never trade the bands alone. They tell you about volatility, but not direction or momentum. Pair them with an indicator like the Relative Strength Index (RSI) or look at trading volume to get a sense of the pressure building up. This chart demonstrates how another indicator can confirm a squeeze is legitimate.
In this example, notice how the indicator below the main price chart holds its ground while the bands tighten. This suggests that while the price is quiet on the surface, smart money might be accumulating positions, which dramatically increases the probability of a powerful move to the upside.
The Psychology of Squeeze Trading Traps
The most expensive errors you'll make with the Squeeze are rarely about the chart; they're about what's happening between your ears. The number one account killer is simply impatience.
Traders eager for action often jump on any small consolidation they see. They end up overtrading mediocre patterns instead of patiently waiting for the A+ setups where volatility has truly dried up to historic lows. Another major mistake is ignoring the market's overall mood. A picture-perfect squeeze in one stock is likely to fail if the entire market is in a nosedive.
Your greatest tool is discipline. Emotional control is also critical when the breakout finally happens. The sudden price move can spark fear or greed, causing traders to take tiny profits on a massive winner or completely forget about their stop-loss. You have to adapt your plan; a squeeze inside a strong trend is a different beast than one happening in a choppy, sideways market.
Keeping a trade journal helps lock in good habits and learn from your mistakes. It becomes your personal playbook for navigating these situations and reinforces what works. Mastering these subtle skills is what separates hobbyists from professional traders.
A platform like ChartsWatcher provides the technical tools to put this into practice. It lets you conduct multi-timeframe analysis and test different indicator combinations, helping you build the confidence to trade these powerful setups correctly.
