Best Day Trading Indicators to Watch in 2025
In the high-stakes environment of day trading, success hinges on making rapid, data-driven decisions with precision. How do traders consistently cut through market noise to identify high-probability setups? The answer lies in mastering the right analytical tools. While countless technical signals exist, a select group has proven indispensable for identifying trend direction, momentum, volatility, and key reversal points. These tools, known as day trading indicators, transform raw price and volume data into actionable insights, removing guesswork from the equation.
This guide moves beyond basic definitions to provide a deep dive into the 10 most effective day trading indicators used by professionals. We'll break down not just what they are, but how to configure them for intraday charts, integrate them into practical strategies, and avoid common pitfalls. While our focus is on technical signals, a comprehensive approach often involves understanding broader market forces; some traders complement their analysis by understanding different types of fundamental analysis indicators to gain a more holistic market view. Prepare to elevate your chart analysis from a reactive process to a proactive strategy, giving you the clarity needed to execute trades with confidence.
1. Moving Average Convergence Divergence (MACD)
The Moving Average Convergence Divergence (MACD) is a versatile, trend-following momentum indicator developed by Gerald Appel. It highlights the relationship between two exponential moving averages (EMAs) of a security's price, making it a staple for identifying changes in momentum, strength, and direction of a trend. The indicator consists of three core components: the MACD line, the signal line, and the histogram.
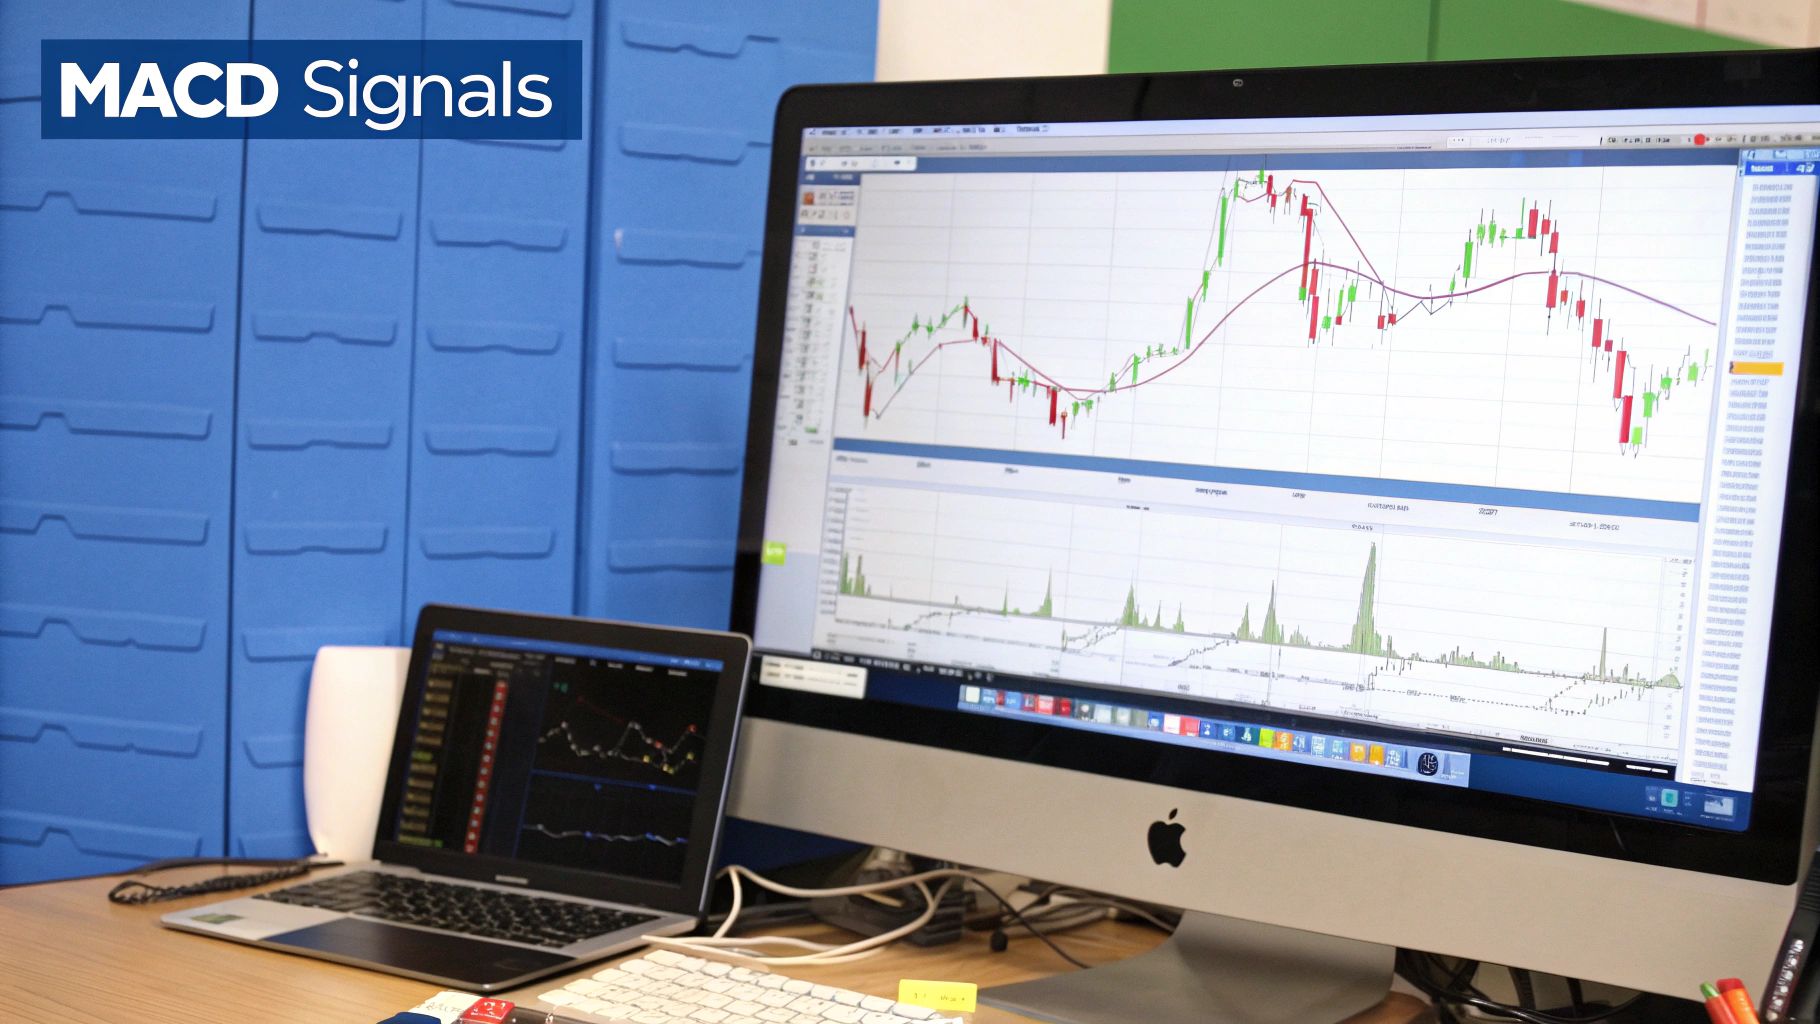
How to Use MACD in Day Trading
For day traders, the MACD provides clear visual cues for potential entries and exits. A common strategy involves watching for crossovers. When the MACD line crosses above the signal line, it suggests increasing bullish momentum and can be interpreted as a buy signal. Conversely, a cross below the signal line indicates bearish momentum and a potential sell signal.
- Scalping Example: A trader using a 5-minute chart might enter a long position when the MACD line crosses above the signal line, especially if confirmed by a spike in trading volume.
- Forex Example: On a 15-minute EUR/USD chart, a trader could spot bearish divergence (price makes a higher high while the MACD histogram makes a lower high) to anticipate a reversal and plan a short entry.
Actionable Day Trading Tips
To effectively use MACD, one of the most critical day trading indicators, consider these adjustments:
- Faster Settings: Standard MACD settings (12, 26, 9) can be slow for intraday charts. Try more responsive parameters like 5-13-5 or 3-10-16 to capture faster price movements.
- Histogram Confirmation: Instead of trading the crossover moment, wait for the histogram to flip to the other side of the zero line. This provides an extra layer of confirmation that momentum has shifted.
- Combine with Price Action: Never use MACD in isolation. Confirm signals with key support and resistance levels or candlestick patterns to improve accuracy and filter out false signals.
2. Relative Strength Index (RSI)
The Relative Strength Index (RSI) is a powerful momentum oscillator developed by J. Welles Wilder Jr. that measures the speed and magnitude of recent price changes. It evaluates overbought or oversold conditions on a scale of 0 to 100, making it one of the most popular day trading indicators for identifying potential reversal points and confirming momentum. Readings above 70 typically indicate overbought conditions, while readings below 30 suggest oversold conditions.
How to Use RSI in Day Trading
Day traders use RSI to pinpoint entry and exit opportunities by identifying market extremes and divergences. When RSI crosses above 70, it signals that an asset may be overbought and due for a price correction. Conversely, when it drops below 30, it signals an oversold condition, suggesting a potential bounce.
- Scalping Example: A scalper using a 1-minute chart might enter a short-term long position when the 5-period RSI on a stock dips below 30 and then crosses back above it, anticipating a quick mean-reversion trade.
- Options Example: An options day trader watching SPY might use an RSI reading below 30 on a 5-minute chart, combined with high volume, to time the purchase of call options at a potential swing low.
Actionable Day Trading Tips
To effectively use RSI, consider these tactical adjustments for the fast-paced intraday environment:
- Adjust Sensitivity: Standard 14-period RSI can be slow. Day traders often use shorter periods like 5 to 9 to increase sensitivity and generate more signals on lower timeframes.
- Trend-Based Levels: In a strong uptrend, RSI can remain overbought for extended periods. Adjust your levels to 80/40 (overbought/oversold) to avoid premature short entries. In a strong downtrend, use 60/20.
- Confirm with the 50-Level: Use the 50-level as a dynamic support and resistance line. A cross above 50 can confirm bullish momentum, while a cross below can confirm bearish momentum. Wait for the RSI to exit extreme zones before entering a trade.
3. Volume Weighted Average Price (VWAP)
The Volume Weighted Average Price (VWAP) is a benchmark day traders use to determine the average price a security has traded at throughout the day, based on both volume and price. It provides a more accurate reflection of a stock's true average price by accounting for trading volume at each price level. Institutional traders often use VWAP to execute large orders without significantly impacting the market, while day traders use it as a dynamic level of support and resistance.
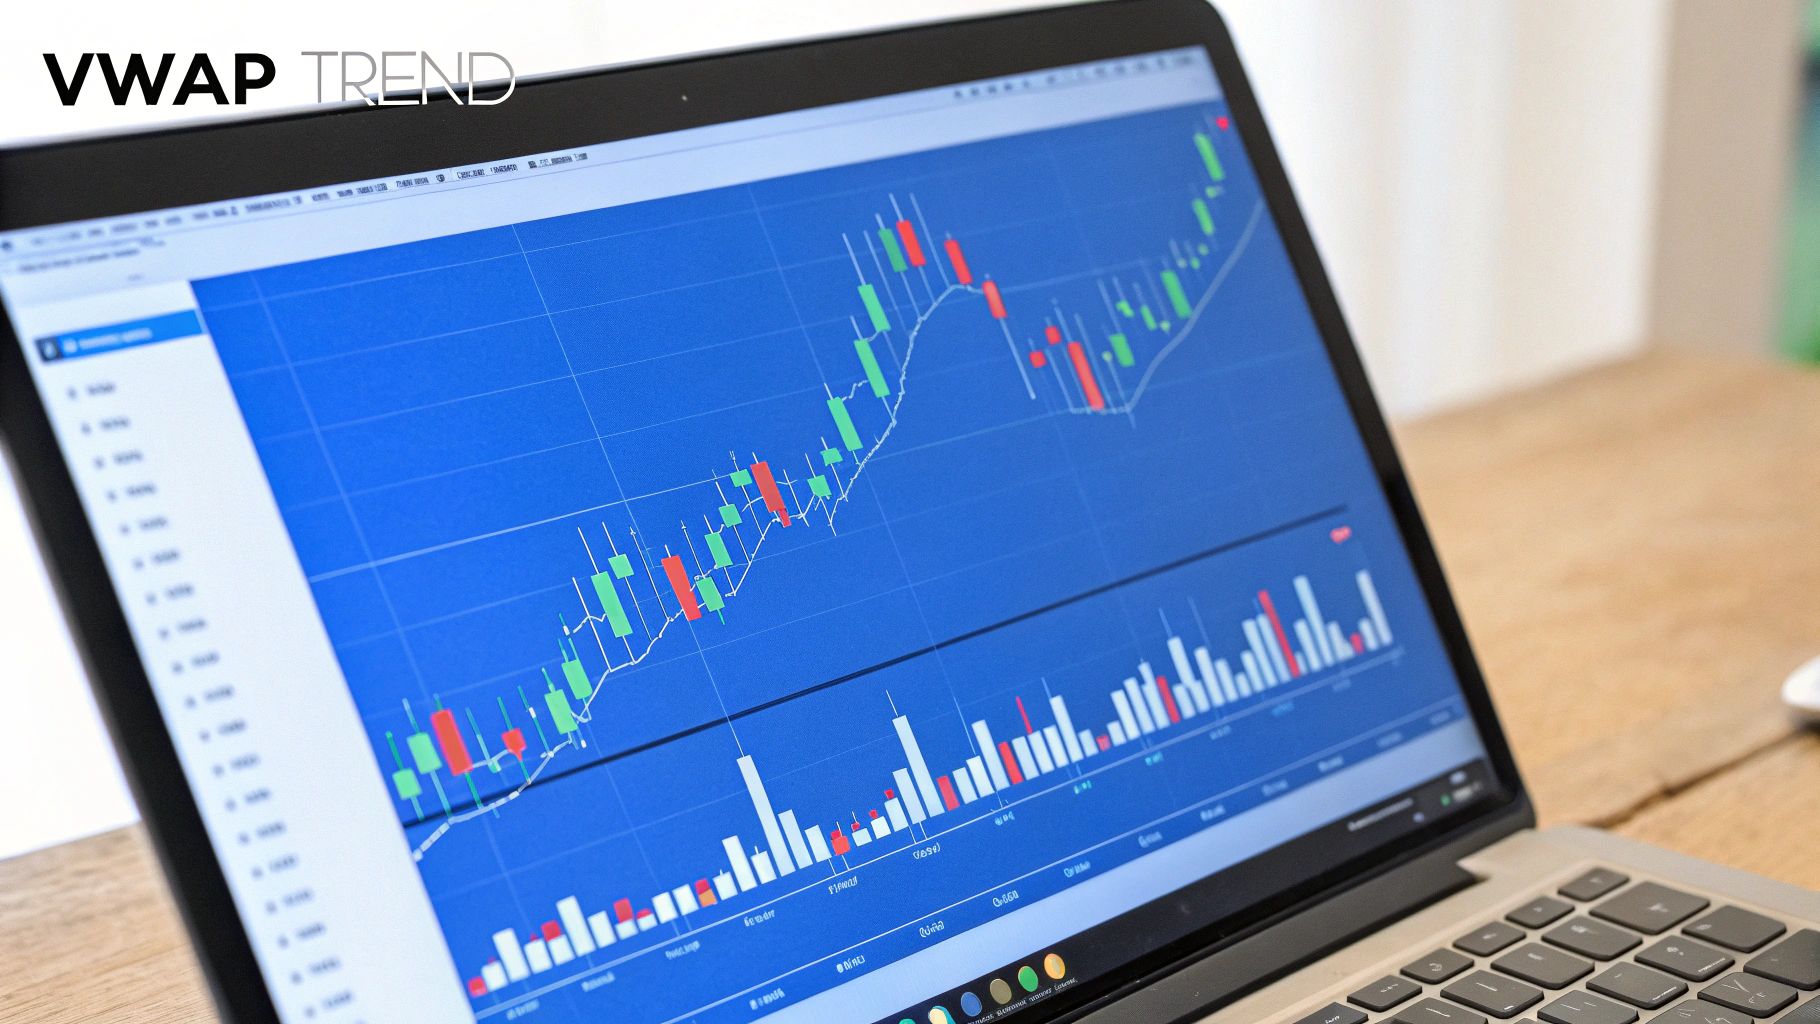
How to Use VWAP in Day Trading
For day traders, VWAP acts as a real-time guide to intraday market sentiment and value. When the price is trading above the VWAP line, it's generally considered bullish, suggesting buyers are in control. Conversely, a price trading below the VWAP indicates a bearish sentiment, where sellers have the upper hand. Traders look for bounces off or pullbacks to the VWAP line as potential entry points.
- Momentum Example: A trader could enter a long position when a stock breaks above its VWAP with a surge in volume after a morning consolidation period, signaling a potential uptrend.
- Mean Reversion Example: Scalpers might look for a short entry when the price extends far above VWAP, reaching a second or third standard deviation band, anticipating a reversion back toward the mean (VWAP).
Actionable Day Trading Tips
To effectively use VWAP, one of the most powerful day trading indicators, consider these practical applications:
- Directional Filter: Use VWAP as a simple rule-based filter. Only take long trades when the price is above VWAP and short trades when it is below. This keeps you aligned with the intraday trend.
- Confirmation with Volume: A price bounce off VWAP is much stronger if confirmed by a significant volume spike. This shows institutional interest and adds conviction to the trade.
- Use Standard Deviation Bands: Add VWAP bands (typically 1, 2, and 3 standard deviations) to your chart. These can act as excellent profit targets or identify overextended conditions for potential reversals.
4. Bollinger Bands
Bollinger Bands are a volatility-based indicator developed by John Bollinger. They consist of three lines: a middle band (a simple moving average, typically 20-period) and upper and lower bands set two standard deviations away from the middle band. The bands expand when volatility increases and contract when it decreases, providing a dynamic framework for price action.
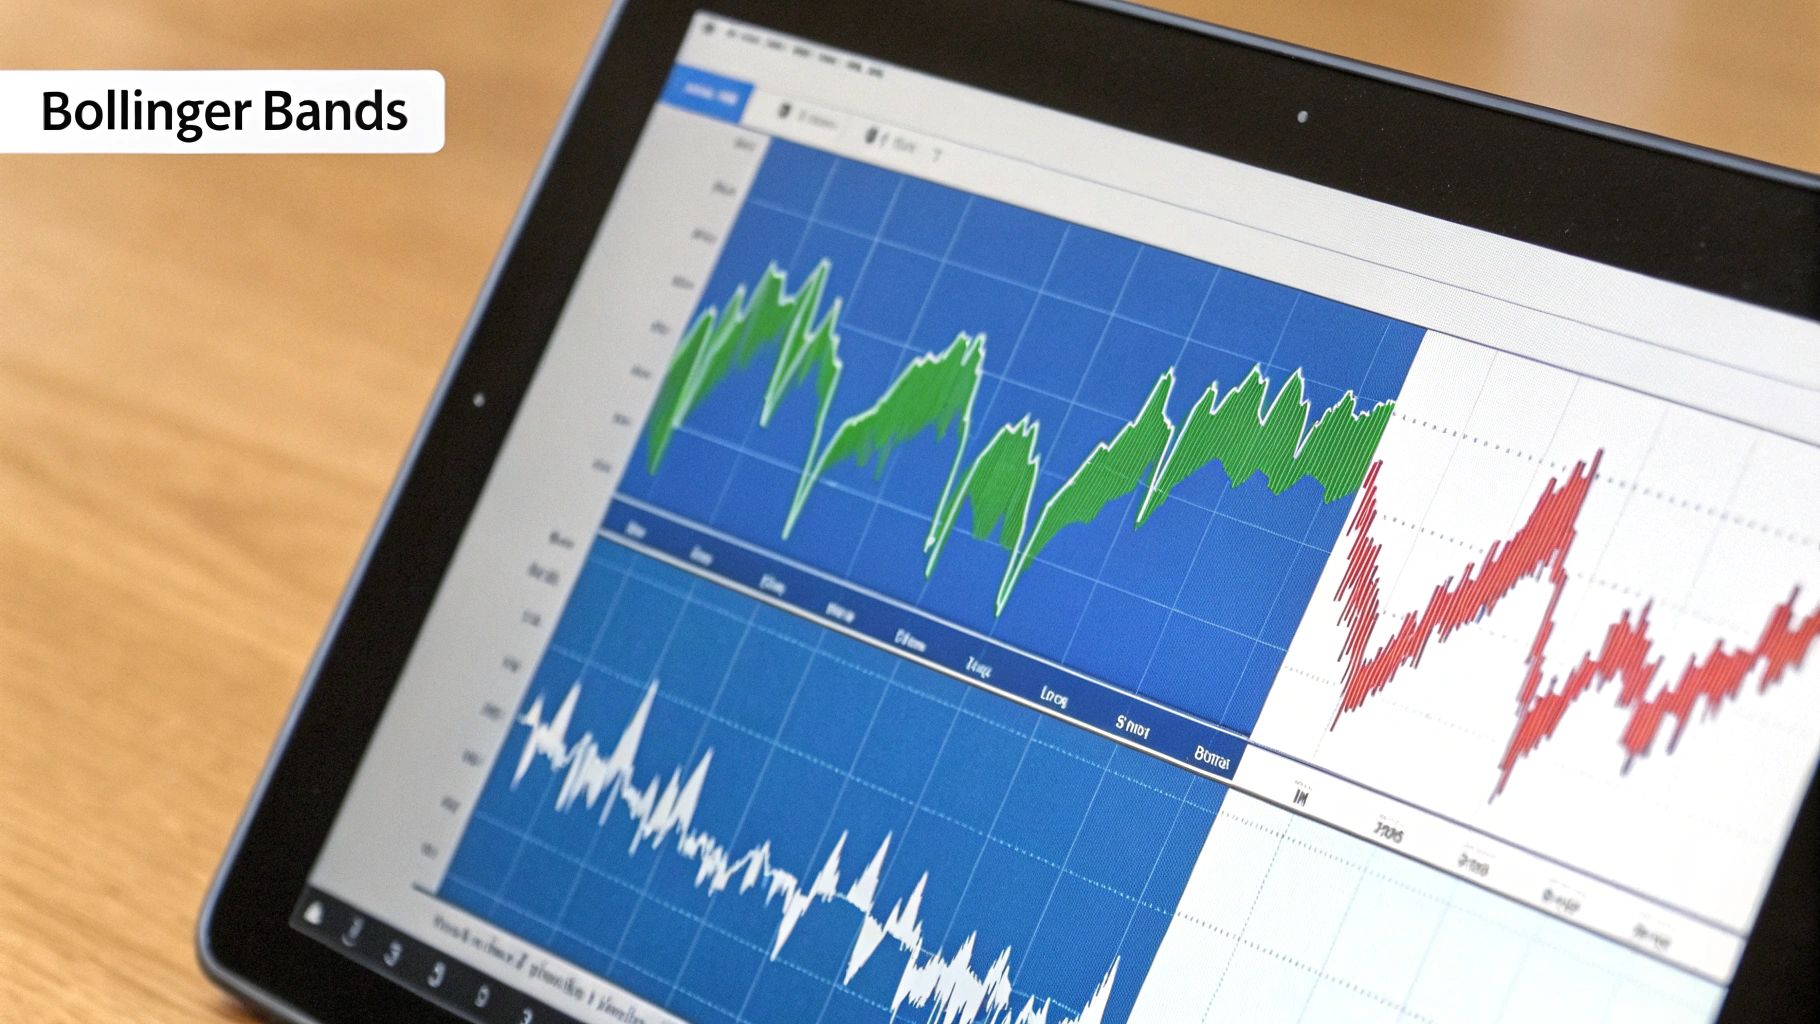
How to Use Bollinger Bands in Day Trading
For day traders, Bollinger Bands are excellent for identifying overbought/oversold conditions and spotting potential breakouts. The primary concept is that price tends to return to the middle of the bands (mean reversion). When the price touches the upper band, it may be overbought; when it touches the lower band, it may be oversold. A "squeeze," where the bands narrow, often precedes a significant price move.
- Breakout Example: A trader notices the bands squeezing on a 15-minute chart for a stock. They can place buy and sell stop orders just outside the bands to catch the breakout in either direction once volatility expands.
- Mean Reversion Example: On a 5-minute chart, a scalper might sell when the price hits the upper band and a bearish candlestick pattern forms, targeting the middle band for a quick profit.
Actionable Day Trading Tips
To effectively use Bollinger Bands, one of the most reliable day trading indicators, consider these tactical adjustments:
- Faster Settings: The standard 20-period, 2 standard deviation setting can be slow. For faster signals on intraday charts, try adjusting to a 10-period SMA with 1.5 standard deviations.
- Confirm with Momentum: Never automatically sell at the upper band or buy at the lower band. Combine a lower band touch with an oversold RSI reading (below 30) to create a higher-probability buy signal.
- Identify Trend Strength: Watch for a "band walk," where the price consistently rides along the upper or lower band. This signals a very strong trend, and you should avoid trading against it.
5. Stochastic Oscillator
The Stochastic Oscillator, developed by George Lane in the 1950s, is a momentum indicator that compares a security's closing price to its price range over a specific period. It operates on the premise that momentum often changes direction before price. The indicator consists of two lines, %K (the fast line) and %D (the slow line), which oscillate between 0 and 100, signaling overbought (above 80) and oversold (below 20) conditions.
How to Use the Stochastic Oscillator in Day Trading
Day traders use the Stochastic Oscillator primarily for timing entries by identifying potential turning points in price momentum. The key signals are generated when the %K and %D lines cross within the overbought or oversold zones. A crossover above the 80 level can signal a potential short entry, while a crossover below the 20 level suggests a potential long entry as momentum shifts.
- Forex Example: A forex trader on a 5-minute chart might look for the Stochastic Oscillator to dip below 20. They would enter a long position when the %K line crosses above the %D line inside this oversold territory, anticipating a bounce.
- Crypto Example: A crypto day trader could identify a bullish divergence when the price of a coin makes a lower low, but the Stochastic Oscillator makes a higher low. This indicates weakening bearish momentum and a potential reversal.
Actionable Day Trading Tips
To effectively integrate the Stochastic Oscillator, one of the most responsive day trading indicators, consider these adjustments:
- Use the Slow Stochastic: Standard settings can be noisy. The "Slow Stochastic" (which uses a smoothed %K) filters out many false signals, making it more reliable for intraday trading.
- Adjust for Speed: For highly volatile markets or scalping, faster settings like (5, 3, 3) can provide earlier signals, though they may also increase noise.
- Confirm with Trend: Avoid trading Stochastic signals in isolation. In a strong uptrend, only take long signals from the oversold area. In a downtrend, only take short signals from the overbought area to trade with the prevailing momentum.
6. Average True Range (ATR)
The Average True Range (ATR) is a volatility indicator developed by J. Welles Wilder Jr. that measures market volatility by decomposing the entire range of an asset price for that period. Unlike directional indicators, ATR does not signal price direction. Instead, it quantifies the degree of price movement, making it an indispensable tool for risk management and strategy refinement in volatile markets.
How to Use ATR in Day Trading
For day traders, ATR is crucial for setting realistic stop-losses and profit targets based on a security's recent volatility. A stock with a high ATR has greater price swings, requiring wider stops to avoid being prematurely stopped out by normal market noise. Conversely, a low ATR suggests tighter stops are more appropriate. It helps traders adapt their risk parameters to current market conditions dynamically. Learn more about what the Average True Range is and how it works.
- Risk Management Example: If a stock has an ATR of $0.50, a day trader might place their stop-loss at 2x ATR, or $1.00 below their entry price, to allow for typical intraday fluctuations.
- Breakout Example: A trader identifies a stock in a tight consolidation. They might look for a price move greater than 1x the ATR beyond the opening range, confirmed by high volume, as a signal to enter a breakout trade.
Actionable Day Trading Tips
To effectively integrate ATR, one of the most practical day trading indicators, consider these tactical adjustments:
- Use ATR Multipliers: Set dynamic stop-losses using ATR multiples. A common approach is 1.5-2x ATR for day trades, while swing trades might use 3x ATR to accommodate larger price swings.
- Filter for Volatility: Before entering a trade, ensure the security has a minimum ATR value. Scalpers might filter for stocks with an ATR above $0.50 to guarantee enough movement for profit.
- Adjust Position Size: Manage risk by adjusting position size inversely to volatility. For a high ATR stock, take a smaller position. For a low ATR stock, a larger position can be taken for the same dollar risk.
7. Exponential Moving Average (EMA)
The Exponential Moving Average (EMA) is a type of moving average that places greater weight and significance on the most recent price points. This makes it more responsive to new information and price changes compared to a Simple Moving Average (SMA), which gives equal weight to all data points. Day traders value EMAs for their ability to quickly identify trend direction, dynamic support and resistance levels, and generate trading signals.
How to Use EMA in Day Trading
EMAs smooth out price action, providing a clearer view of the underlying trend. A common strategy involves using two or more EMAs. When a shorter-term EMA (like the 9-period) crosses above a longer-term EMA (like the 20-period), it signals a potential uptrend and a buy opportunity. Conversely, a cross below indicates a potential downtrend and a sell signal.
- Scalping Example: A scalper on a 1-minute chart might buy when the price pulls back and bounces off the 9-period EMA during a strong, established uptrend.
- Momentum Example: On a 5-minute stock chart, a trader could initiate a long position when the price breaks and closes above the 50-period EMA, especially if confirmed by a high RSI reading (above 50).
Actionable Day Trading Tips
To master the EMA, one of the most fundamental day trading indicators, consider these tactical approaches:
- Use Multiple EMAs: Combine a fast EMA (e.g., 9-period) for entry signals with a slower EMA (e.g., 50-period) to confirm the overall trend direction. Only take trades that align with the longer-term trend.
- Trade EMA Bounces: In a strong trend, price will often pull back to a key EMA (like the 20-period) before continuing. These bounces offer high-probability entry points. Wait for a bullish or bearish confirmation candle at the EMA before entering.
- Watch the Slope: The angle of the EMA indicates trend strength. A steeply rising EMA suggests strong bullish momentum, while a flattening EMA signals a potential slowdown or reversal.
8. Fibonacci Retracement Levels
Fibonacci Retracement is a technical analysis tool used to identify potential support and resistance levels. It’s based on key numbers identified by mathematician Leonardo Fibonacci, with traders focusing on ratios like 23.6%, 38.2%, 50%, 61.8%, and 78.6%. Traders draw these levels between a significant high and low to pinpoint where a price pullback might stall or reverse before continuing in its original direction.
How to Use Fibonacci Retracement in Day Trading
For day traders, Fibonacci levels provide objective price zones for setting entries, stops, and profit targets. After identifying a strong price move (an impulse wave), a trader can draw the retracement tool from the start to the end of that move. The resulting levels act as a roadmap for potential counter-trend pullbacks.
- Momentum Example: In a strong uptrend on a 5-minute stock chart, a scalper might look to enter a long position on a shallow pullback to the 38.2% retracement level, expecting the trend to resume quickly.
- Reversal Example: A forex trader might notice a major downtrend on the 15-minute GBP/JPY chart. They could use a pullback to the 61.8% level, confirmed by a bearish engulfing candle, as an ideal entry point for a short trade.
Actionable Day Trading Tips
To effectively use Fibonacci Retracement, one of the most predictive day trading indicators, consider these tactical adjustments:
- Focus on Key Levels: The 38.2%, 50%, and 61.8% levels are often the most significant. Treat them as high-probability zones for price reactions.
- Wait for Confirmation: Never enter a trade just because the price hits a Fibonacci level. Wait for confirmation from a candlestick pattern (like a pin bar or engulfing candle) or another indicator to validate the signal.
- Use Extensions for Targets: After price bounces off a retracement level, use Fibonacci extension levels (like 161.8% or 261.8%) to set logical and non-emotional profit targets for your trade.
9. On-Balance Volume (OBV)
The On-Balance Volume (OBV) is a cumulative momentum indicator that uses volume flow to predict changes in stock price. Developed by Joseph Granville in 1963, OBV operates on the theory that volume precedes price. It adds volume on up days and subtracts it on down days, creating a running total that shows whether smart money is accumulating (buying) or distributing (selling) an asset.
How to Use OBV in Day Trading
For day traders, OBV acts as a powerful confirmation tool for trend strength and potential reversals. A rising OBV confirms an uptrend, showing strong buying pressure, while a falling OBV confirms a downtrend, signaling selling pressure. The key is to watch for divergences, where the price and OBV move in opposite directions, often signaling an impending reversal.
- Breakout Confirmation: A day trader confirms a price breakout above resistance only if the OBV also breaks out to a new high, suggesting strong volume is driving the move.
- Divergence Trading: A trader spots bearish divergence when a stock's price makes a new high, but the OBV fails to do so. This weakness signals a potential short entry opportunity.
Actionable Day Trading Tips
To make On-Balance Volume one of your go-to day trading indicators, apply these practical strategies:
- Focus on Direction, Not Value: The absolute numerical value of OBV is irrelevant. Concentrate on its trend and direction to gauge buying or selling pressure.
- Draw OBV Trendlines: Just like with price charts, you can draw trendlines on the OBV indicator. A break of an OBV trendline can often precede a break in the price trend.
- Confirm with Price Patterns: Use OBV to validate classic chart patterns. For instance, a rising OBV during a bullish flag pattern adds significant weight to a potential upward breakout. For more details on using volume, learn more about what trading volume is on chartswatcher.com.
10. Parabolic SAR (Stop and Reverse)
The Parabolic SAR (Stop and Reverse) is a unique trend-following indicator developed by J. Welles Wilder Jr. that provides potential entry and exit points. It appears on a chart as a series of dots placed either above or below the price. When the dots are below the price, it signals a bullish uptrend; when the dots are above the price, it indicates a bearish downtrend. The indicator is designed to "stop and reverse" when the price trend changes direction.
How to Use Parabolic SAR in Day Trading
For day traders, Parabolic SAR excels at setting dynamic trailing stop-losses and identifying potential trend reversals. A flip of the dots from above the price to below it suggests that downward momentum is fading and can be seen as a buy signal. Conversely, a flip from below to above the price signals a potential trend change to the downside and a sell or short signal.
- Momentum Trading Example: A trader could enter a long position on a 15-minute chart when the SAR dots flip below the price, especially if the Average Directional Index (ADX) confirms a strong trend is forming.
- Scalping Example: On a fast-moving 5-minute chart, a scalper might enter a short position as soon as the SAR dots appear above a candlestick, setting their stop-loss just above the most recent SAR dot.
Actionable Day Trading Tips
To effectively use Parabolic SAR, one of the most dynamic day trading indicators, consider these adjustments:
- Avoid Ranging Markets: Parabolic SAR generates frequent false signals in sideways or choppy markets. Use it only when a clear directional trend is present, confirmed with an indicator like the ADX.
- Trailing Stop-Loss: Its primary strength is as a trailing stop. As the trend progresses, move your stop-loss order to match the level of each new SAR dot to lock in profits.
- Adjust Sensitivity: You can change the indicator's acceleration factor (default 0.02). A higher factor makes it more sensitive to price changes for faster trades, while a lower factor reduces sensitivity for longer-term trends.
- Confirm with Other Indicators: Never rely on the SAR flip alone for entries. Confirm signals with a moving average crossover or a momentum oscillator to increase the probability of a successful trade.
Top 10 Day Trading Indicators Comparison
| Indicator | Implementation Complexity 🔄 | Resource Requirements ⚡ | Expected Outcomes 📊 | Ideal Use Cases 💡 | Key Advantages ⭐ |
|---|---|---|---|---|---|
| Moving Average Convergence Divergence (MACD) | Moderate - involves multiple EMAs and histogram calculation | Moderate - requires price data and EMA computations | Trend direction and momentum identification, reversal signals | Trending markets with clear bias | Versatile, clear signals, momentum & trend combined |
| Relative Strength Index (RSI) | Low - oscillator calculation with fixed formula | Low - needs price change data | Overbought/oversold conditions, momentum exhaustion alerts | Range-bound and trending markets | Simple, clear levels, early reversal divergence signals |
| Volume Weighted Average Price (VWAP) | Moderate - volume-weighted averaging intraday | Moderate - intraday price and volume data | Dynamic support/resistance, trend bias during day | Intraday trading of liquid securities | Objective intraday benchmark, widely used by institutions |
| Bollinger Bands | Moderate - SMA plus standard deviation bands | Low - requires price series for SMA and SD | Volatility measurement, overbought/oversold zones, breakouts | All markets and timeframes | Adapts to volatility, visual extremes, breakout anticipation |
| Stochastic Oscillator | Moderate - %K and %D line computations | Low - price range and close price input | Overbought/oversold signals, momentum crossovers | Range-bound markets, short-term timing | Responsive signals, divergence detection |
| Average True Range (ATR) | Low - averages true range values | Low - needs high, low, close prices | Volatility measurement for stops, sizing, breakout potential | All markets and timeframes | Objective volatility gauge, useful for risk management |
| Exponential Moving Average (EMA) | Low - weighted average with exponential factor | Low - price time series input | Trend identification, dynamic support/resistance | Trend following, all timeframes | Responsive to recent prices, easy interpretation |
| Fibonacci Retracement Levels | Low - plotting horizontal levels at Fibonacci ratios | Low - requires swing high and low points | Potential reversal zones, support/resistance levels | Trending markets, swing high/low points | Widely followed, objective levels, helpful for planning |
| On-Balance Volume (OBV) | Low - cumulative volume addition/subtraction | Low - price close and volume data | Trend confirmation, divergence on volume pressure | Confirming breakouts and trends | Simple to calculate, reveals buying/selling pressure |
| Parabolic SAR (Stop and Reverse) | Moderate - recursive calculation with acceleration factor | Low - price input | Entry/exit signals, trailing stop-loss | Trending markets with strong direction | Clear signals for stops, effective in locking profits |
From Theory to Execution: Integrating Indicators into Your Trading System
Navigating the fast-paced world of intraday markets requires more than just instinct; it demands a structured, data-driven approach. Throughout this guide, we've dissected ten of the most powerful day trading indicators, from the momentum-gauging power of the MACD and RSI to the volatility insights provided by Bollinger Bands and the ATR. Each tool offers a unique lens through which to view market action, but their true potential is unlocked not in isolation, but in combination.
The core lesson is to move beyond simply knowing what an indicator is and to master how it works in tandem with others. The goal is not to clutter your charts with every indicator available, but to build a clean, efficient, and personalized analytical framework. A cluttered screen often leads to "analysis paralysis," where conflicting signals create confusion rather than clarity.
The Power of Confluence
The most successful day traders build strategies around the concept of confluence. This is the practice of looking for multiple, non-correlated indicators to provide the same signal, thereby increasing the probability of a successful trade. A single indicator might generate a false signal, but it's far less likely that three distinct indicators will all be wrong at the same time.
Consider a practical example:
- The Signal: The price of a stock pulls back to the 20-period EMA, a common area of dynamic support.
- Confirmation 1: As it touches the EMA, the Stochastic Oscillator crosses up out of the oversold region (below 20), suggesting buying momentum is returning.
- Confirmation 2: Simultaneously, the On-Balance Volume (OBV) indicator is showing a bullish divergence, meaning volume is flowing into the stock even as the price has dipped.
This convergence of signals from three different types of indicators (trend, momentum, and volume) creates a high-probability entry point. This is a far more robust setup than trading off a single EMA touch alone.
Your Actionable Next Steps
Mastering these concepts requires deliberate practice and testing. Your immediate goal should be to develop a system that aligns with your specific trading style, risk tolerance, and chosen market.
- Select Your Toolkit: Choose two to three indicators from our list that resonate with you. A common and effective combination is one trend indicator (like EMA), one momentum oscillator (like RSI or MACD), and one volume-based tool (like VWAP or OBV).
- Define Your Rules: Create a concrete set of rules for your strategy. What specific conditions must be met for you to enter a trade? For example, "I will only go long if the price is above the VWAP, the MACD histogram is positive, and the RSI is above 50."
- Backtest and Refine: Rigorously test your strategy on historical data. This crucial step helps you understand how your system would have performed in various market conditions, allowing you to refine your rules and settings without risking real capital. As you advance, you may want to integrate other analytical methods. For instance, understanding how to apply and interpret trading using pivot points can provide objective, pre-calculated levels of support and resistance that complement the dynamic indicators we've discussed.
- Paper Trade: Once you have a backtested strategy, apply it in a live market simulation (paper trading). This helps you build confidence and experience the psychological pressures of real-time decision-making before putting money on the line.
Ultimately, day trading indicators are not crystal balls; they are sophisticated tools that measure market psychology and probability. By learning to combine them intelligently, you transform raw market data into actionable insights, moving from simply reacting to price movements to strategically anticipating them. This methodical approach is what separates consistently profitable traders from the crowd.
Ready to stop guessing and start backtesting? ChartsWatcher provides a powerful, intuitive platform to build custom dashboards and run historical simulations on the very indicators discussed in this article. Test your confluence strategies and refine your edge with our advanced analytical tools. Sign up for ChartsWatcher today and turn your trading theory into practice.
