Best: best charting software for day trading — Top Picks & Features
Ask any seasoned trader what the best charting software is, and you'll likely hear names like TradingView thrown around for its massive community and solid tools, or ChartsWatcher for its pro-level customization and raw data speed. The real answer, though? It completely depends on you. The perfect platform for a scalper hunting for tiny price movements is a terrible fit for a momentum trader looking for the big picture.
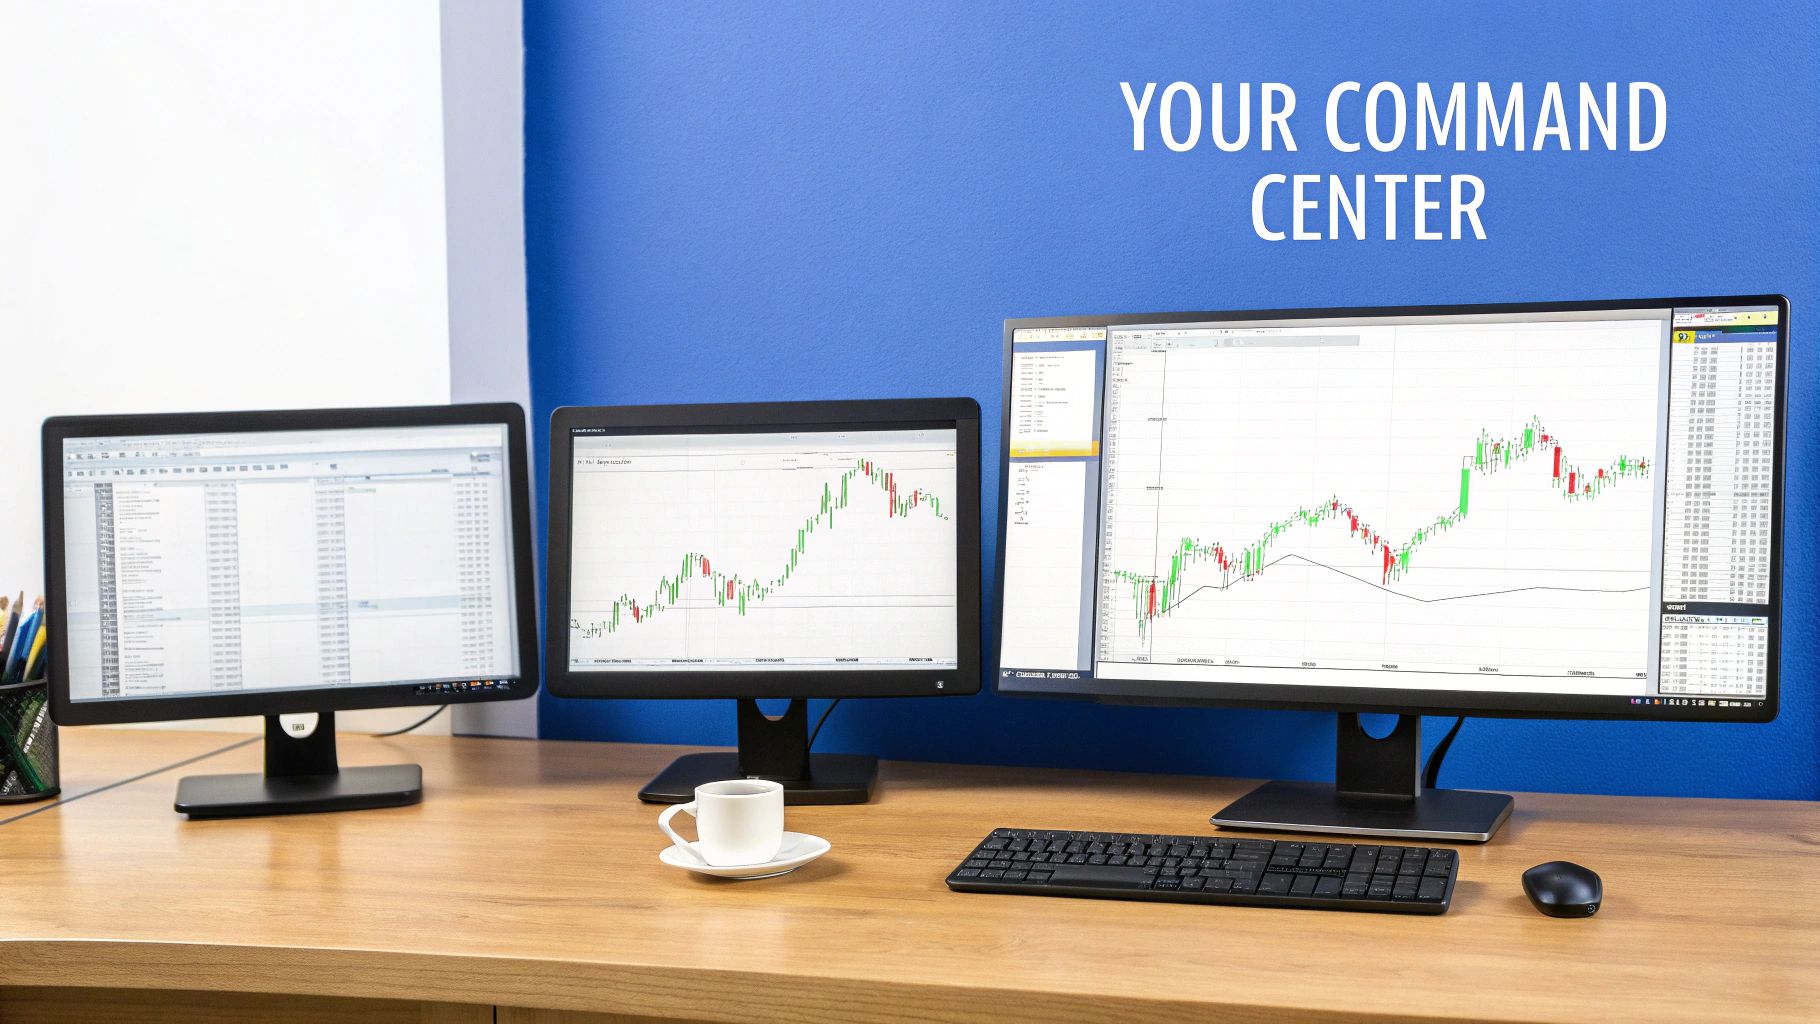
Choosing Your Command Center For Day Trading
Think of your charting software as the command center for every single trade you make. It's so much more than a window that shows prices going up and down; it's the cockpit you fly from as you navigate the chaotic, lightning-fast world of the financial markets. There's no one-size-fits-all "best" platform. The right one is the one that feels like an extension of your own mind—one that perfectly syncs with your trading style, strategy, and risk tolerance to give you a real edge.
Making the right choice means cutting through all the marketing hype and focusing on what actually drives your performance day in and day out. We're going to break down the must-have criteria—data speed, charting tools, and deep customization—that separate the elite platforms from all the noise.
Why Your Software Choice Is So Critical
In day trading, decisions are made in a heartbeat. Your software has to process and display market information with virtually zero lag. A sluggish platform can be the difference between nailing a breakout and watching the move happen without you.
Here are the core elements you absolutely have to evaluate:
- Data Speed and Reliability: Is the data feed truly real-time and unfiltered? Delays, even just milliseconds, can cause significant slippage and cost you money.
- Charting Power: Does it give you a full arsenal of technical indicators, drawing tools, and customizable chart types? You need tools that match your strategy, not the other way around.
- User Interface (UI): Can you build and save complex layouts to monitor multiple assets and timeframes without it feeling clunky? Your workflow needs to be seamless.
This isn't a small niche, either. The online trading platform market, which includes this software, hit USD 9.57 billion in 2023. With projections showing it will grow to USD 15.62 billion by 2030, it’s obvious that traders are doubling down on powerful tools. Desktop solutions, which are essential for complex multi-chart setups, grabbed a massive 66% revenue share, underscoring just how important a dedicated trading station is.
Your charting platform shouldn't just show you data; it should organize the market's chaos into intelligence you can act on. It’s your main interface for reading the market and executing your plan with precision.
Setting Up Your Trading Environment
An effective command center is more than just software; it includes your physical setup, too. Most professional day traders use multi-monitor configurations to keep their charts, news feeds, and order execution windows all in view at once.
If you're serious about creating an optimal environment for intense analysis, this guide to the perfect triple monitor desk setup is a fantastic starting point. Getting your physical space right is the first step in building a trading environment that supports high-level performance.
Breaking Down The Anatomy Of Top-Tier Charting Software
Think of the best charting software for day trading like a high-performance race car. It's not just one thing that makes it fast; it's the perfect harmony of an entire system built for speed, precision, and gut-wrenching reliability. To really see what separates the elite platforms from the pack, we need to pop the hood and look at the core components. Each piece is critical to your ability to read the market and react with confidence.
When you're in a trade and every single tick matters, you can't afford a single point of failure. It all has to work, seamlessly. Let's break down the absolute non-negotiables that define professional-grade charting software.
The Engine: Real-Time Data Feeds
The single most important part of any day trading setup is its data feed. This is the engine. Period. A slow or choppy data feed is like trying to win the Indy 500 with a sputtering engine—you’ll always be a step behind.
For day traders, real-time data isn’t a nice-to-have; it's the absolute foundation you build everything on. We're talking about Level 1 and Level 2 data that refreshes in the blink of an eye.
- Level 1 Data: This is your at-a-glance view of supply and demand, showing you the best bid and ask prices. It's the front line.
- Level 2 Data: This goes deeper, opening up the entire order book. You see the stack of all bids and asks at different price levels, which helps you spot market depth and where the big institutional orders are hiding.
A delay of even half a second can mean the difference between nailing your entry and chasing a move that's already left the station. The best platforms know this and invest heavily in direct exchange connections to make sure their data is as pure and fast as possible.
This demand for speed and precision has exploded the market for day trading software to USD 1.2 billion globally in 2023, and it's projected to hit USD 2.5 billion by 2030. This isn't just about faster data anymore; it's about smarter tools. We've come a long way since the early days of algorithmic charting after the 2008 crisis, with new AI-enhanced tools helping traders spot potential breakouts. You can dig into the numbers in this market analysis of day trading software.
The Dashboard: Indicators And Custom Layouts
If the data feed is your engine, then your charts and layouts are the dashboard. This is where raw, chaotic data gets turned into clear, actionable intelligence. A clunky or rigid interface just creates mental friction, slowing you down right when you need to be sharpest.
Top-tier software gives you extreme control over your workspace. You're not just looking at one chart; you're building a command center tailored specifically to your strategy. That means you need the ability to:
- Create Multi-Chart Layouts: See the same stock across different timeframes—like the 1-minute, 5-minute, and daily charts—all at once.
- Access a Full Suite of Indicators: You need everything from the basics like Moving Averages and RSI to more advanced tools like Volume Profile and Fibonacci retracements.
- Save and Load Templates: Get your preferred set of indicators and drawing tools onto any new chart with a single click. Every second counts.
A well-designed interface doesn't just look pretty; it reduces the brainpower needed to process information. This frees you up to focus on analysis and execution instead of wrestling with your software.
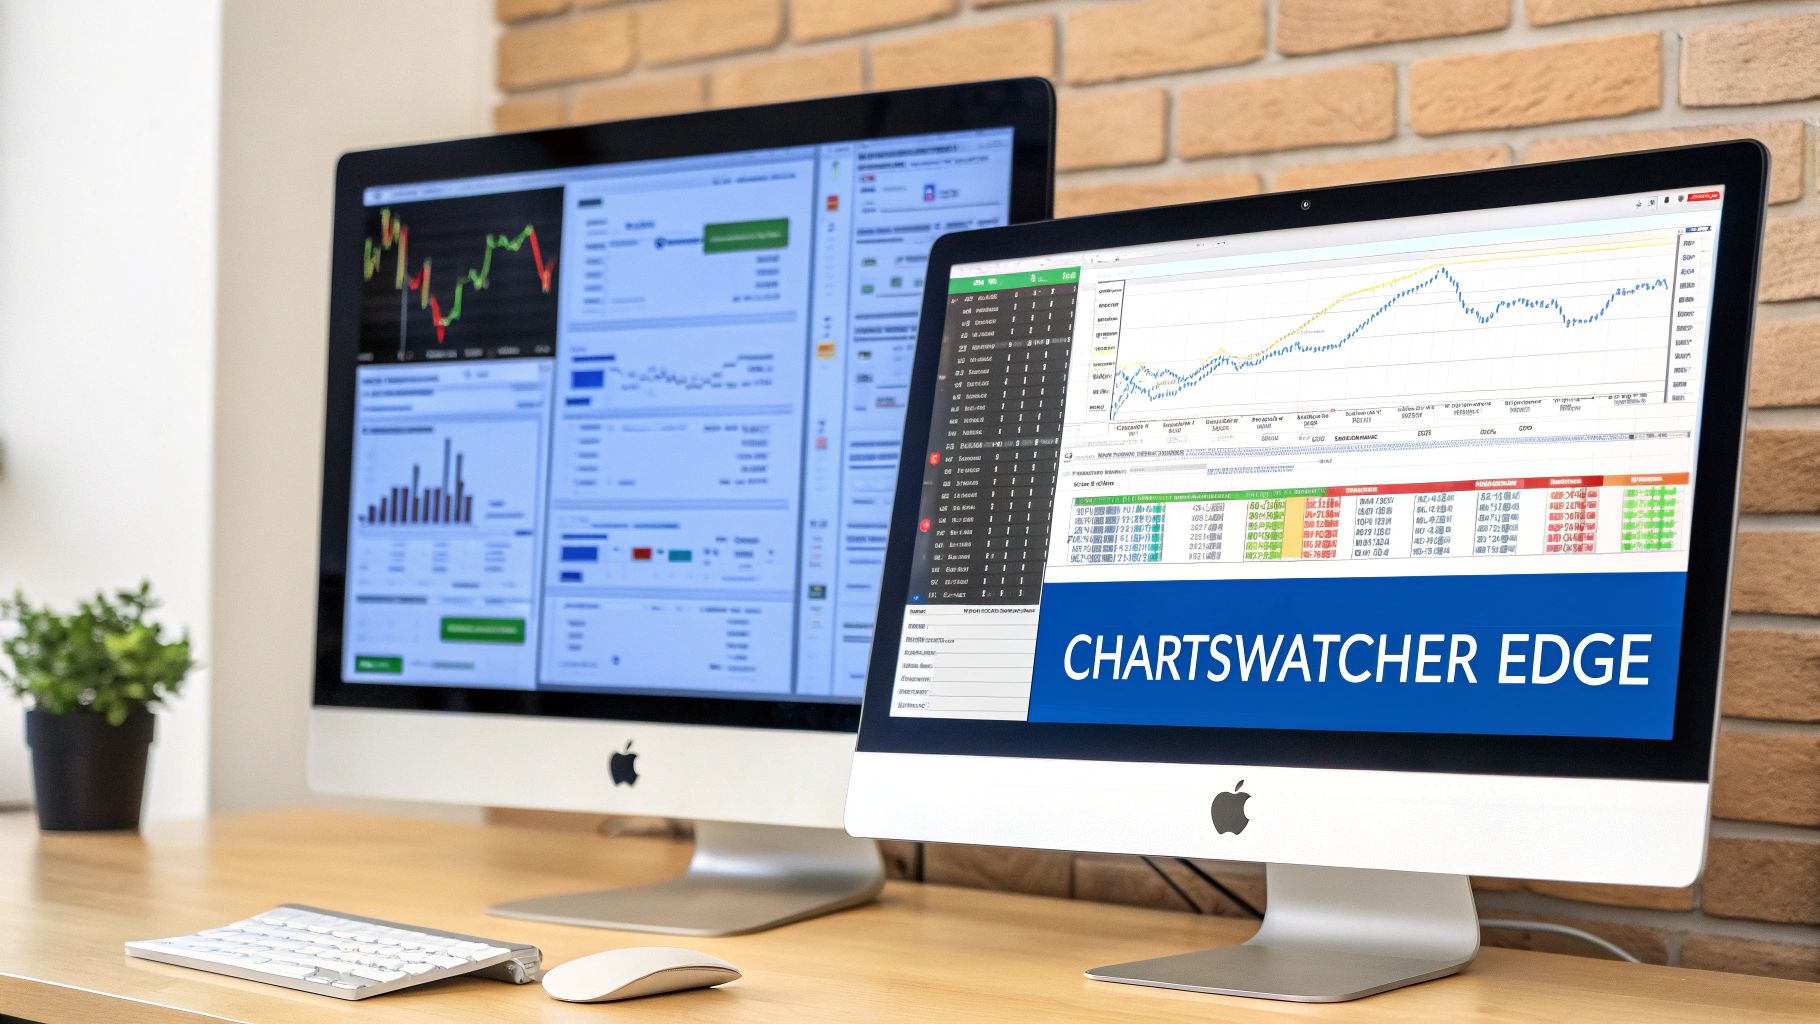
This screenshot from ChartsWatcher.com shows a clean, multi-window layout. Notice how a trader can keep an eye on several charts and data points at the same time without it feeling crowded or overwhelming.
The key takeaway here is how information is organized logically. Each window has a specific job, giving you a complete market overview at a glance.
The Navigation System: Scanners and Alerts
Finally, an elite platform needs a powerful navigation system. You can't possibly watch all 8,000+ stocks on the market by yourself. That’s where market scanners and alerts come in. They're your eyes and ears, constantly sifting through the noise to bring you high-probability setups that fit your exact criteria.
A professional-grade scanner is way more than a simple filter for "stocks up 5%." It lets you build complex, multi-layered rules. For instance, you could scan for:
- Stocks hitting new 52-week highs.
- With a trading volume over 2 million shares.
- And an RSI below 30 on the 15-minute chart.
- That are also approaching a key support level.
Alerts are the other half of the equation. Once your scanner flags a stock, you don't have to stare at it waiting for the perfect entry. You can set price-based or indicator-based alerts—like when a stock crosses a key moving average or breaks out of a price channel. This frees you up to manage your active trades while the software does the watching for you, making sure you never miss your shot.
Matching Your Trading Style To The Right Platform
Think of choosing charting software like a chef picking a knife. A sushi chef needs a razor-thin Yanagiba for precise cuts, while a butcher needs a heavy cleaver to power through bone. Using the wrong tool is frustrating and leads to bad results—and it’s no different in trading. The perfect platform for a lightning-fast scalper would be a complete nightmare for a patient swing trader.
The trick is to cut through the marketing hype and match the software’s core strengths to your specific trading strategy. Once you know what you truly need, you can ignore the distracting bells and whistles and focus on the tools that will actually make you money. It's about finding a platform that works with you, not against you.
This diagram breaks down the essential building blocks of any serious trading platform, which form the foundation for every trading style.
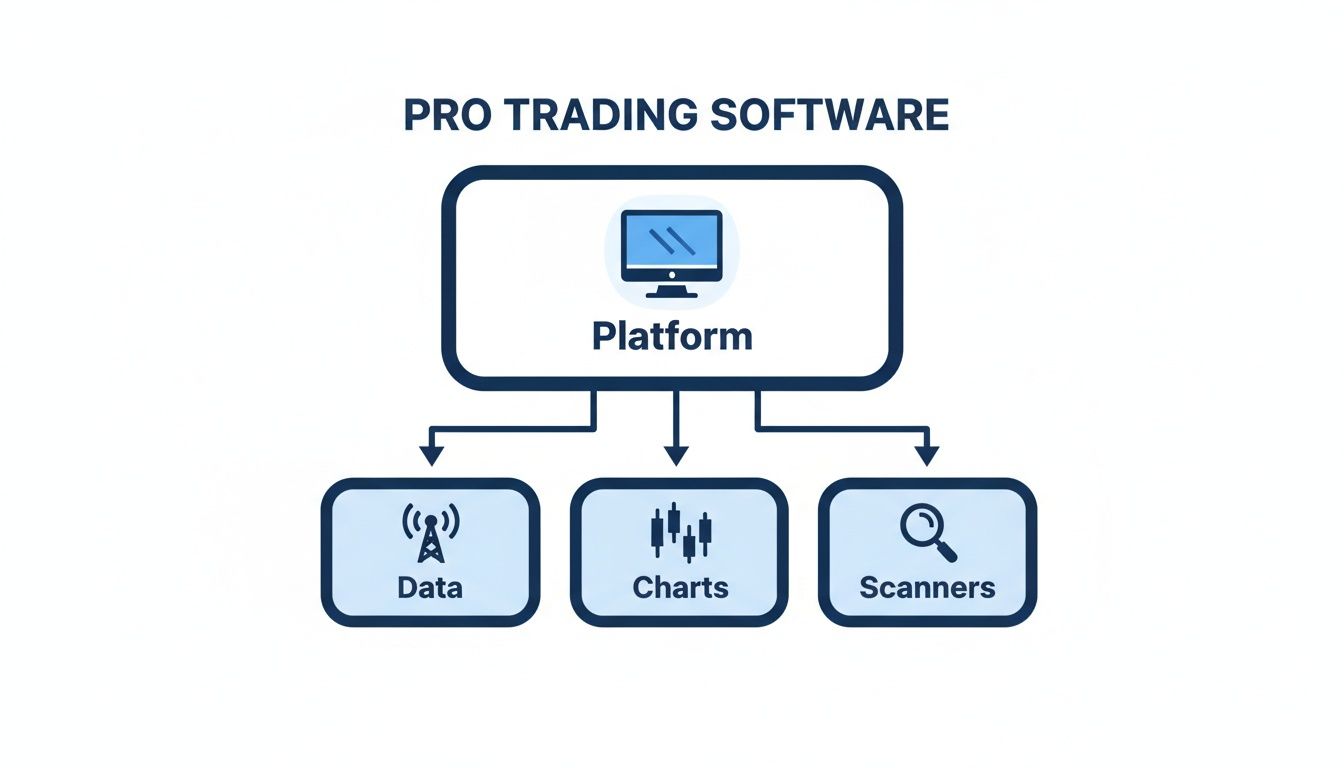
As you can see, everything from the charts on your screen to the scanners finding opportunities is built on one thing: fast, reliable data. Now, let’s dig into how different traders prioritize these components.
The Scalper's Toolkit For Speed
Scalpers are the sprinters of the trading world, holding positions for mere seconds or minutes. They aim to snatch tiny profits from small price flickers, repeating the process dozens or even hundreds of times a day. For them, speed isn't just a nice-to-have; it's the entire game.
Success is measured in milliseconds. Their software has to be a finely tuned machine built for instant reaction. There is zero tolerance for lag, clunky interfaces, or delayed data.
Here’s a scalper’s non-negotiable checklist:
- Level 2 Data and Time & Sales: This is their lifeblood. Scalpers practically live inside the order book, watching the real-time flow of bids and asks to predict the market’s next tiny move.
- Hotkey Execution: Clicking a mouse is ancient technology for a scalper. They need the ability to buy, sell, and cancel orders with single keystrokes to react instantly.
- Direct Market Access (DMA): Orders need to be sent to the exchange at the speed of light, bypassing any and all middlemen that could add latency.
- Low-Latency Data Feed: The data must be raw, unfiltered, and delivered in true real-time. Even a slight delay makes Level 2 analysis completely worthless.
For a scalper, charting software is less about deep analysis and more about being a high-speed command center for order execution. The entire focus is on seeing supply and demand right now and hitting the button.
The Momentum Trader's Engine Of Opportunity
Momentum traders are opportunity hunters. They search for stocks making big, decisive moves on heavy volume and ride the trend for minutes or hours. They’re less concerned with tiny price ticks and more focused on finding the "story of the day."
Their software needs to be an engine for discovery, capable of sifting through thousands of stocks to find the few that are truly in play. If you want to dial in your discovery process, you should learn how to find the best stock screener for day trading to pair with your platform.
This is what a momentum trader absolutely needs:
- Powerful Market Scanners: This is their number one tool. They need to build and run complex, real-time scans for things like "stocks hitting new highs on 3x average volume" or "stocks up more than 5% in the first hour."
- Integrated News Feeds: Big moves are often sparked by news. Having a live news feed right on the platform helps them connect a price spike to a catalyst in seconds.
- Advanced Charting with Indicators: They heavily rely on indicators like VWAP (Volume-Weighted Average Price), Moving Averages, and RSI to confirm trends and nail their entry and exit points.
- Customizable Alerts: They need to set multi-layered alerts for price levels, volume spikes, or indicator crossovers so they know the exact moment a stock meets their strict criteria.
The Professional's Analytical Powerhouse
The professional or institutional trader often takes a more systematic, data-driven approach. They might be developing complex algorithms, deploying significant capital, or running deep analytical models to validate an edge before risking a single dollar.
For them, the software isn't just a tool; it's an analytical laboratory for testing, refining, and executing sophisticated strategies.
Their checklist prioritizes depth, flexibility, and power:
- Robust Backtesting Engine: The ability to test a strategy against years of historical data is paramount. This is how they prove an idea has merit and understand its potential risk and reward.
- API Access: Many pros build their own tools. They need an API to plug custom algorithms or third-party software directly into the platform’s data and execution systems.
- Advanced Order Types: They need more than just simple market and limit orders. Access to complex orders like brackets, OCOs (One-Cancels-the-Other), and other conditional orders is essential for precise risk management.
- Multi-Asset Capabilities: Professionals don’t just stick to one market. They need a platform that seamlessly handles equities, futures, options, and forex all in one place.
Feature Checklist By Trader Profile
This table provides a comparative checklist showing feature priorities for different trading styles, helping you pinpoint what matters most for your strategy.
| Feature | Scalper Priority | Momentum Trader Priority | Pro Trader Priority |
|---|---|---|---|
| Level 2 Data | CRITICAL | High | High |
| Hotkey Execution | CRITICAL | Medium | High |
| Powerful Scanners | Low | CRITICAL | High |
| Integrated News Feed | Medium | CRITICAL | Medium |
| Advanced Charting | Low | High | CRITICAL |
| Backtesting Engine | Low | Medium | CRITICAL |
| API Access | Low | Low | CRITICAL |
| Customizable Alerts | High | CRITICAL | High |
| Direct Market Access | CRITICAL | Medium | High |
| Advanced Order Types | High | Medium | CRITICAL |
By identifying your own profile in this checklist, you can quickly filter out platforms that don't fit and zero in on the ones that will truly support and enhance your trading.
A Practical Framework For Evaluating Trading Software
Picking the right charting software can feel like cramming for a final exam. With so many options, it's easy to get lost in feature-for-feature comparisons. But if you have a solid framework, you can cut through the noise and make a confident, well-informed decision.
The goal here isn't just to find a tool that looks impressive. It's to find a partner that genuinely improves your trading—one that streamlines your workflow and boosts your bottom line, not just another monthly subscription to pay.
Define Your Non-Negotiables
Before you even start looking at platforms, grab a pen and paper. It's time to define your "must-haves." This isn't a wish list; it’s the bare minimum a platform needs to do for you to even consider it. Get this wrong, and you'll end up with a tool that fights you every step of the way.
Your list should be built around your specific trading style. A scalper’s deal-breakers are completely different from a momentum trader's.
- For a Scalper: Lightning-fast Level 2 data, one-click order execution, and direct market access are everything. If a platform lags here, it’s an immediate "no."
- For a Momentum Trader: The absolute must-have is a powerful, real-time market scanner with complex filtering capabilities and an integrated news feed.
Write these down. Having this list in front of you will keep you from getting distracted by flashy features that you’ll never actually use.
The Trial Period Stress Test
Almost every reputable software company offers a free trial or a demo account. This is where the rubber meets the road. Don't just poke around—put the platform through a real-world stress test without risking a single dollar.
The ultimate test for any platform? A major economic news event, like an FOMC announcement or a CPI data release. These high-volatility moments push data feeds to their absolute limits. You'll quickly see if the platform’s infrastructure can handle the heat or if it freezes up right when you need it most.
A platform that stays quick and responsive during peak chaos is a platform you can trust. To get a better sense of what's out there, check out our guide to other stock market analysis software.
Analyzing Cost Versus Value
Last but not least, let's talk price. It's a mistake to just look at the monthly fee. You need to analyze the true value you're getting for your money. The cheapest option is rarely the best, and the most expensive one isn't automatically superior.
Ask yourself these questions to nail down the real value:
- Does it save me time? If a powerful scanner finds you high-probability setups in 5 minutes instead of the 2 hours it takes you manually, that software is worth its weight in gold.
- Does it improve my execution? If faster data and better order types reduce your slippage by even a few cents per trade, the software can easily pay for itself over the course of a year.
- Does it enhance my risk management? Features that help you protect your capital are priceless. For more on this, check out this complete guide to risk management in trading, which outlines principles your software should help you implement.
By following this three-step process—defining your needs, stress-testing your options, and analyzing true value—you can turn a confusing decision into a clear, logical choice.
How ChartsWatcher Delivers a Professional Trading Edge
There's a world of difference between a feature list on a website and what actually works when the market is moving and your capital is on the line. This is where a platform like ChartsWatcher stops being just another charting tool and becomes a true command center, built from the ground up for traders who need more than the basics.
The entire platform is designed around one core idea: to cut through market chaos and deliver actionable clarity.
It’s engineered to give you the complete market overview needed to run complex strategies. Every piece of the system serves a specific, performance-driven purpose, helping you make data-driven decisions instead of emotional ones.
Dynamic Dashboards For Total Market Awareness
A single chart tells only a fraction of the story. Professional traders need to see how different assets, timeframes, and indicators are interacting, all in real-time. ChartsWatcher nails this with fully dynamic, multi-window dashboards that you can build, customize, and save.
Imagine a single workspace where you’ve got:
- A 1-minute chart of SPY to track the day's momentum.
- A daily chart of the same ticker to keep the bigger picture front and center.
- A live news feed, filtered to show only market-moving headlines.
- A custom toplist scanner hunting for stocks breaking out on high volume.
This isn't just about throwing data on a screen; it's about building your personalized analytical cockpit. Symbols can be synced across all windows, so one click on a stock in your scanner instantly updates every single chart. That seamless workflow is non-negotiable when opportunities appear and disappear in a heartbeat.
Precision Tools For Flawless Execution
Emotion is the enemy of a consistently profitable trader. Even the best-laid plans can crumble in a moment of panic or greed. The best charting software for day trading should act as a safeguard, helping you stick to your strategy with disciplined, logic-based tools.
ChartsWatcher’s advanced alerts and filters are a perfect example. Forget simple price alerts. Here, you can create complex, multi-conditional triggers that do the hard work for you. For instance, you could set an alert for when a stock not only crosses its 50-day moving average but does so with a volume spike of over 300% of its average.
This level of precision automates your entire opportunity-spotting process. The platform does the heavy lifting, freeing you up to focus on high-level analysis and execution. You only get pulled in when your strictest criteria are met.
Validating Strategies With A Robust Backtesting Engine
Guesswork has no place in a professional trading operation. Before you risk a single dollar of real capital, every strategy needs to be battle-tested against historical data. ChartsWatcher gives you a powerful backtesting engine to do just that.
This feature lets you finally get answers to critical questions:
- How would my breakout strategy have performed during last year's brutal bear market?
- What is the actual win rate and profit factor of my moving average crossover system?
In a world where some trader surveys show that 70% of day trades rely on visual pattern recognition, having elite-level charting is essential. Innovators like ChartsWatcher are changing the game with features like exportable configurations and multi-window alerts, helping traders slice through the noise of over 10,000 daily tickers to find high-probability setups. You can dive deeper into the trends in this market report on day trading software. This data-first approach builds the statistical confidence you need, turning a hopeful guess into a proven edge.
So, how do you finally pull the trigger with confidence?
After everything we've covered, the path to finding the right charting software boils down to one simple truth: the best platform is just an extension of your mind and your strategy. It shouldn't feel like a clunky tool you have to wrestle with, but more like a partner that speaks your language and sharpens your edge.
We’ve cut through the marketing noise to focus on what actually matters—raw speed, deep customization, and rock-solid reliability. You now have a solid framework for making a smart choice. The final, most important step is to actually put that knowledge to the test.
The goal isn't just to find software that shows you charts. It’s to find a platform that helps you see the story the market is telling, with total clarity. That's where a real trading advantage is born.
This is precisely why we built ChartsWatcher. It was designed from the ground up for traders who are obsessed with precision and need total control over every part of their workflow.
The most logical next step? Take it for a spin. Starting with a free plan lets you experience the difference for yourself. You can put our features through their paces and see if it truly fits your style, all before you ever have to make a commitment.
A Few Final Questions You're Probably Asking
As you get closer to making a decision, a few key questions always seem to pop up. It makes sense—choosing the right charting software is a serious commitment. Let's tackle some of the most common ones head-on so you can move forward with confidence.
These are the practical, real-world answers traders need to hear before they invest in a platform that will shape their trading career.
Can I Get By With Free Charting Software For Serious Day Trading?
While free tools are a great place to start and learn the basics, trying to use them for serious day trading is like showing up to a Grand Prix in a rental car. Sure, you're on the track, but you’re not built to compete. The biggest killer is delayed data.
For a day trader, even a few seconds of delay is an eternity. It's the gap between catching a breakout and chasing it, between a clean entry and a costly mistake. Most free platforms serve up data that's 15-20 minutes old, which is completely useless for making decisions in the heat of the moment.
The second you need to act on real-time price changes, order flow, or momentum, a professional platform with a direct data feed is no longer a luxury—it's the cost of doing business.
How Important Is Backtesting, Really?
Backtesting isn't just another bell or whistle; it's how professional traders build a genuine statistical edge. It’s the process of running your strategy against historical market data to see how it would have performed, all without risking a single penny of your actual capital.
Think of it as a flight simulator for your trading system. It forces you to answer the tough questions:
- Does this idea actually have a positive expectancy over hundreds of trades?
- How does it hold up in different market environments, like a raging bull market versus a choppy, sideways grind?
- What's the worst-case scenario? (This is known as the maximum drawdown).
A robust backtesting engine is what turns a gut feeling into a data-driven strategy. It builds the confidence you need to pull the trigger without hesitation, separating a proven system from a lucky streak before your money is on the line.
What Matters More: Data Feed Quality Or The Number Of Indicators?
This debate comes up a lot, but the answer is crystal clear: data feed quality is infinitely more important than the number of indicators a platform offers. Your data feed is the bedrock of your entire trading operation. Everything else is built on top of it.
An indicator, no matter how complex or "advanced," is just a mathematical formula that runs on price and volume data. If the data it's receiving is slow, glitchy, or incomplete, the indicator's output is garbage. It’s a classic "garbage in, garbage out" problem.
Any platform built for serious traders prioritizes data integrity and speed above all else. A huge library of indicators is nice to have, but even the most sophisticated tool is worthless if it's running on a faulty engine.
Ready to see how a professional-grade platform can transform your trading? ChartsWatcher provides the real-time data, advanced charting, and robust backtesting tools you need to build a true market edge. Explore our features and start with a free plan today.
