A Guide to Stock Market Analysis Software
Think of stock market analysis software as a sophisticated GPS for your investment journey. You wouldn't navigate a cross-country road trip with a folded paper map from a gas station, right? These tools give you a dynamic, real-time view of the market landscape, alerting you to potential traffic jams (downturns) and pointing out faster routes (emerging trends).
How Stock Market Analysis Software Works
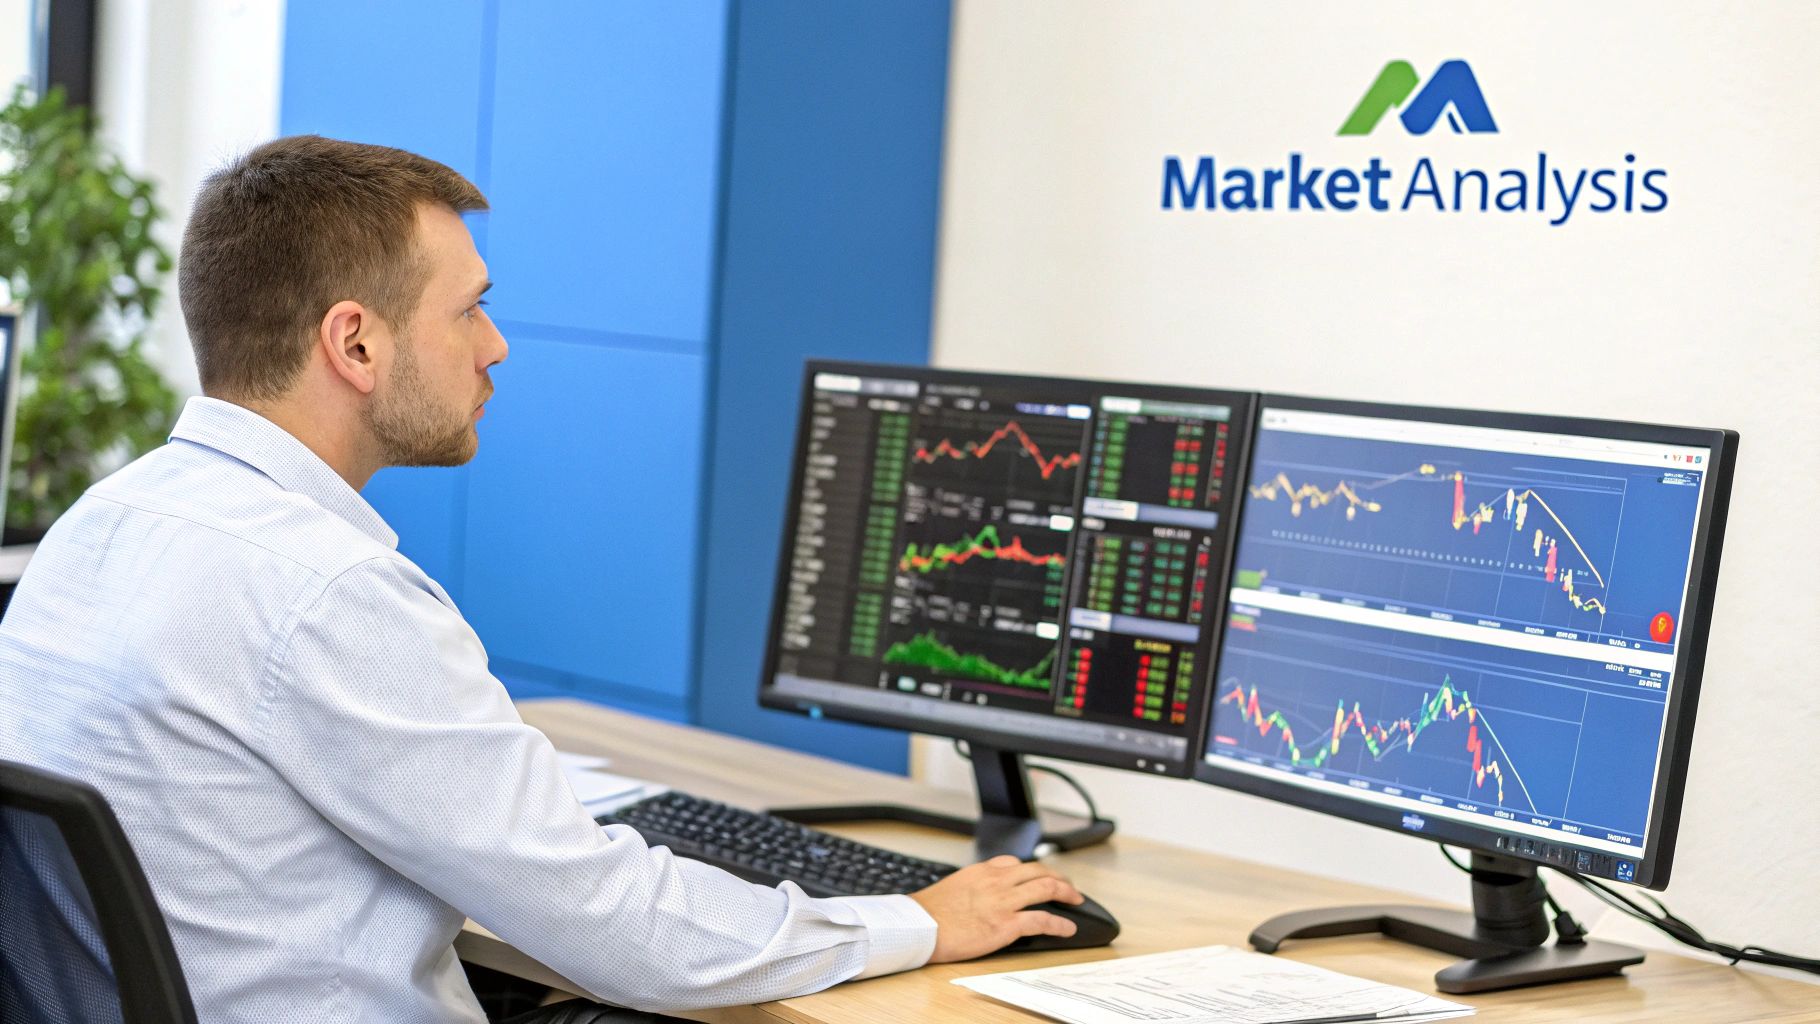
At its heart, this kind of software takes overwhelming streams of data—stock prices, trading volumes, financial reports—and translates them into clear, visual formats. It’s all about spotting patterns and making confident, evidence-based decisions instead of trading on gut feelings or emotional whims.
The goal is simple: move beyond guesswork and anchor your strategy in solid, objective analysis.
Core Functions and Purpose
The main job of this software is to cut through the noise. It does this by handling a few critical functions that every trader, new or experienced, needs.
- Visualize Data: Raw numbers are boring and hard to interpret. These tools turn them into intuitive charts, graphs, and heatmaps that instantly show you what’s happening with market sentiment and momentum.
- Identify Opportunities: Instead of digging through thousands of stocks manually, you can use powerful filters and scanners to pinpoint companies that meet your exact criteria. This can save you countless hours of tedious research.
- Manage Risk: By analyzing a stock's historical volatility and price action, these platforms help you figure out where to set your stop-losses and understand the potential downside of a trade before you put your capital on the line.
By turning raw data into strategic intelligence, stock market analysis software equips traders with the clarity needed to navigate market uncertainty and execute their plans with precision.
In today's fast-paced markets, these platforms are no longer a "nice-to-have"—they're a fundamental part of the modern investor's toolkit. They provide the analytical horsepower required to find an edge and compete effectively.
Why Modern Investors Need These Tools
Let's be honest, the days of making investment decisions based on a gut feeling or a hot tip from a friend are long gone. Today’s markets move at the speed of light, and the good news is that individual investors now have access to the kind of analytical power that was once the exclusive domain of big Wall Street firms.
This shift is precisely why stock market analysis software has become a non-negotiable part of any serious trader's toolkit. These tools do the heavy lifting, automating the painstaking research that used to take hours of manually sifting through financial reports and price charts.
By serving up clear, objective data, they help you sidestep the single biggest obstacle to consistent profits: emotional bias. Fear and greed have a nasty habit of clouding judgment, but cold, hard data provides a stable anchor in a volatile sea. This is the core of any solid data-driven decision making framework.
Gaining a Competitive Edge
In a world where market conditions can flip in a matter of seconds, speed is everything. Stock analysis software gives you a real competitive advantage with real-time alerts and powerful scanning capabilities. This means you can react instantly to volatility, protect your portfolio from sudden drops, and pounce on opportunities the moment they appear.
Here’s what that looks like in practice:
- Time Efficiency: What once took hours of manual research can now be done in minutes.
- Emotional Discipline: Grounding your decisions in data helps you avoid those impulsive trades driven by market hype or panic.
- Smarter Risk Management: Tools for backtesting strategies and analyzing historical data let you make more calculated moves.
The real power here isn't just seeing the market as it is right now. It's about understanding the forces shaping where it's headed next. It empowers you to build a proactive strategy instead of just reacting to whatever the market throws at you.
The market itself tells the story. The global stock analysis software market, valued at USD 1.5 billion in 2024, is on track to hit USD 3.1 billion by 2033. This massive growth isn't just a random trend; it shows a clear shift where data-driven tools are becoming the standard for anyone who wants to succeed.
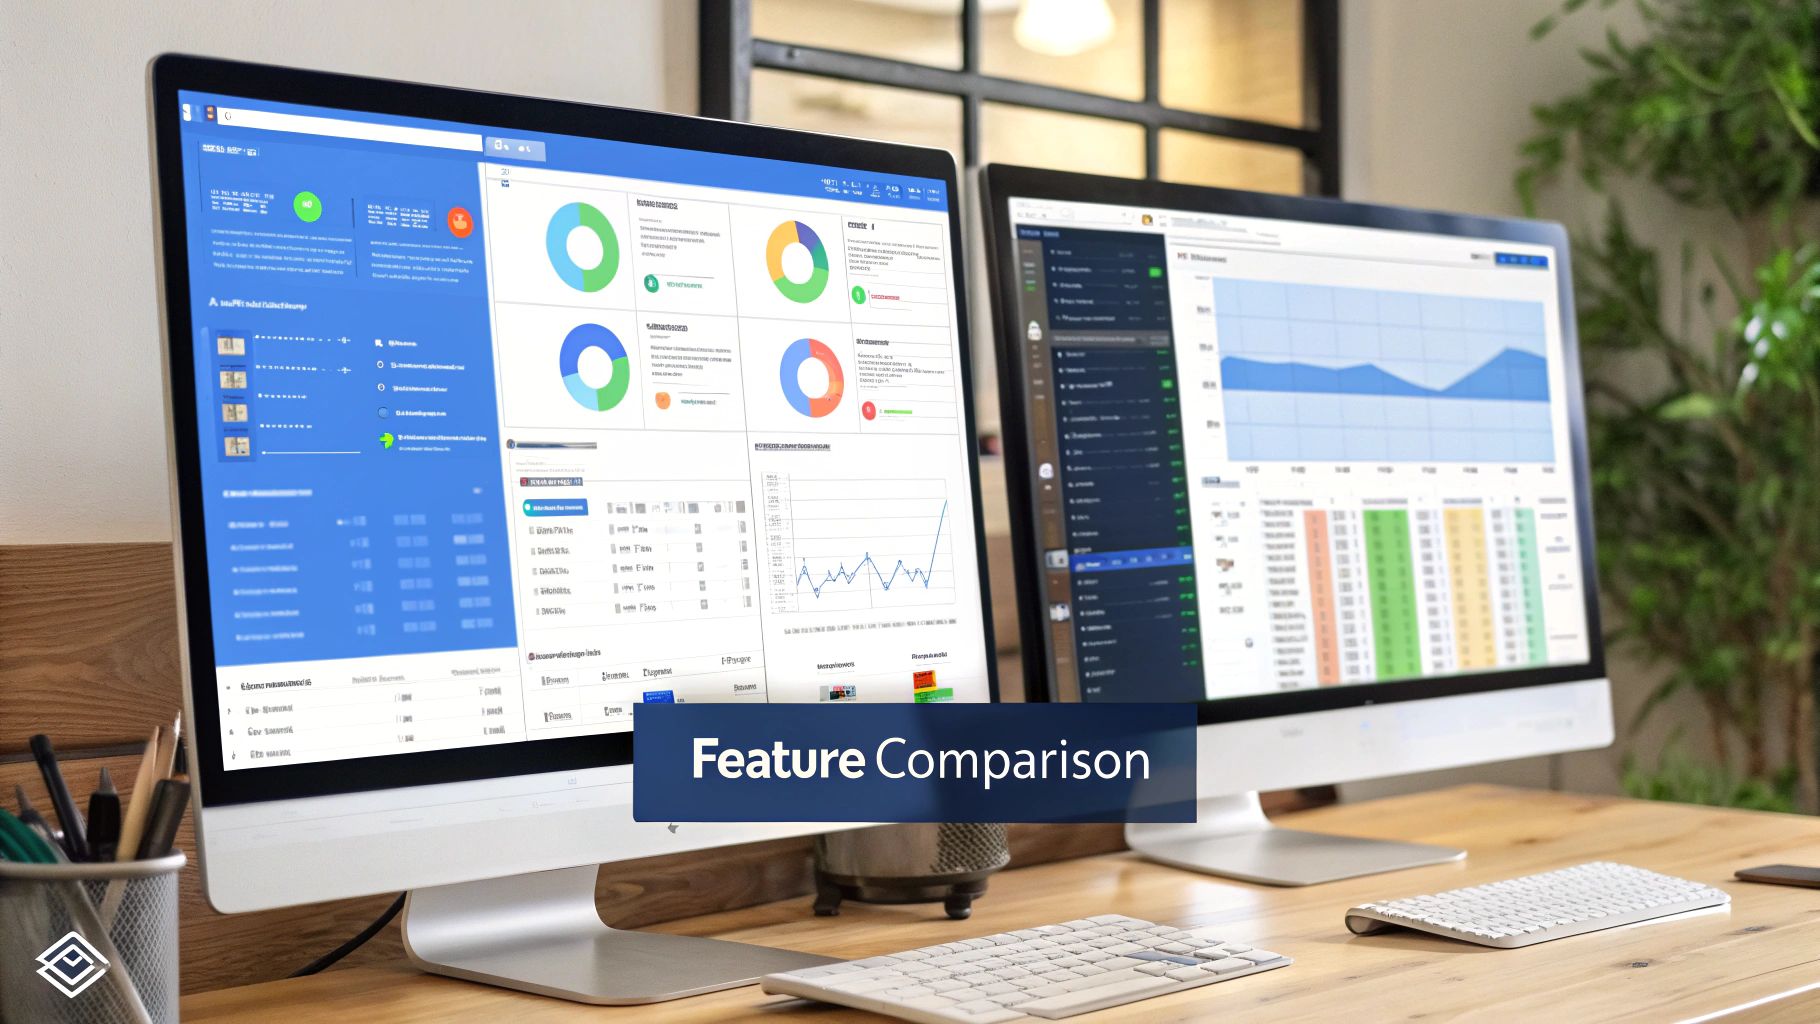
What Are the Must-Have Features in Stock Analysis Software?
Choosing the right stock market analysis software can feel a bit like staring at a wall of TVs in an electronics store—they all promise the best picture, but the specs can be overwhelming. To cut through the noise, it helps to focus on a core set of features that form the engine of any powerful trading toolkit.
These aren't just flashy add-ons; they are the essential components that turn raw data into clear, actionable decisions. You wouldn't buy a car without checking its engine, brakes, and steering. In the same way, certain features are simply non-negotiable for navigating the markets.
The goal of this software is simple: to help you make better decisions, work more efficiently, and manage your risk.
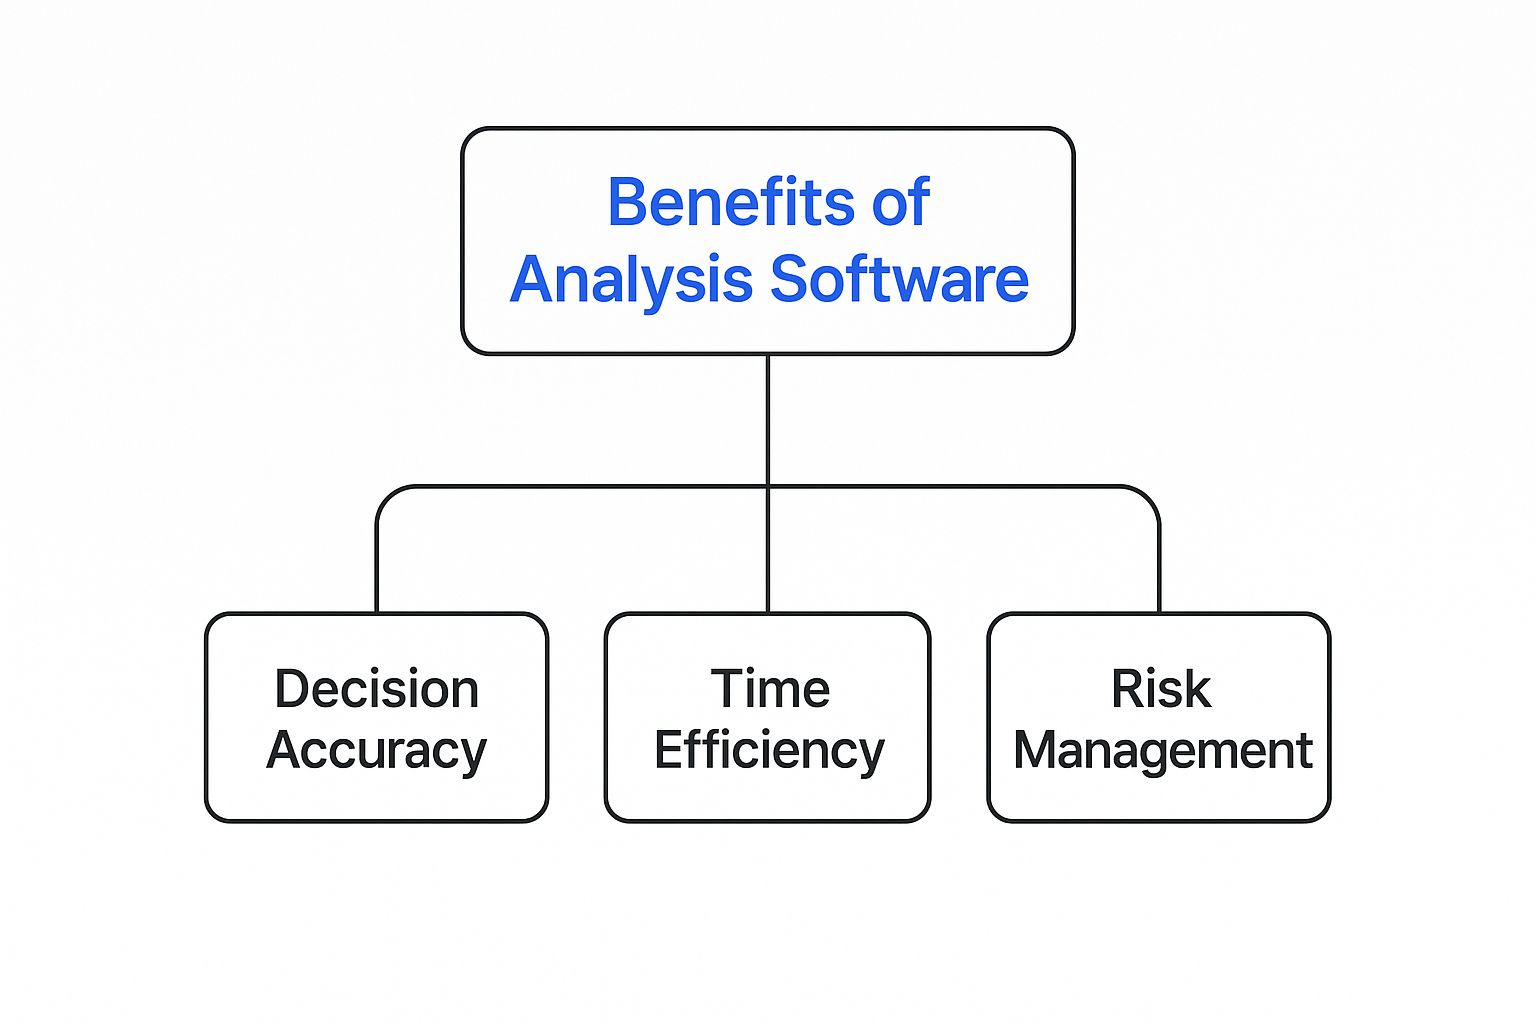
As you can see, every core function is designed to sharpen your decision-making, save you time, or protect your capital.
Let's break down the most important features to look for. Think of this as your personal checklist for finding a tool that actually helps you trade smarter.
Table: Essential Features in Stock Analysis Software
Before we dive into the details, here's a quick look at the key features and why they matter. Each one plays a unique role in helping you build and execute a winning strategy.
| Feature | Primary Benefit |
|---|---|
| Real-Time Data | Ensures your decisions are based on the latest market action, not delayed information. |
| Advanced Charting | Allows for deep technical analysis to identify patterns, trends, and trade signals. |
| Stock Screener | Filters thousands of stocks to find the few that match your specific criteria. |
| Backtesting | Lets you test strategies on historical data to see how they would have performed. |
| Alerts & Notifications | Monitors the market for you and signals when your conditions are met. |
These tools work together to create a complete system for spotting opportunities and managing trades from start to finish.
Data and Charting Capabilities
The foundation of any good analysis is high-quality data. Real-time data feeds are absolutely critical—a few seconds of delay can mean the difference between snagging a great entry and chasing a missed opportunity. This data is the fuel for the most important visual tool in your arsenal: the charts.
Advanced charting tools are the bread and butter of technical analysis. You're looking for software that offers:
- A wide range of technical indicators (like Moving Averages, RSI, and MACD).
- Multiple chart types (candlestick, bar, line) to view price action in different ways.
- Drawing tools to map out trendlines, support, and resistance levels with your own hands.
These features let you dissect price movements and spot potential entry and exit points with a level of precision that a basic line graph could never offer.
Finding and Testing Opportunities
Once you have solid data and charts, how do you find stocks that fit your strategy? This is where a customizable stock screener becomes your best friend. A good screener lets you filter thousands of stocks based on metrics like market cap, P/E ratio, dividend yield, or specific technical signals, narrowing the entire market down to a manageable list of contenders.
After you’ve pinpointed a promising stock and built a strategy around it, how do you know if it even has a chance of working? Backtesting is the answer. This feature lets you test your trading ideas against historical data, running your strategy through past market conditions to see how it would have performed.
It's your simulator for the market, helping you refine your approach and build confidence without risking a single dollar. Think of it as an essential safety check before you put real capital on the line.
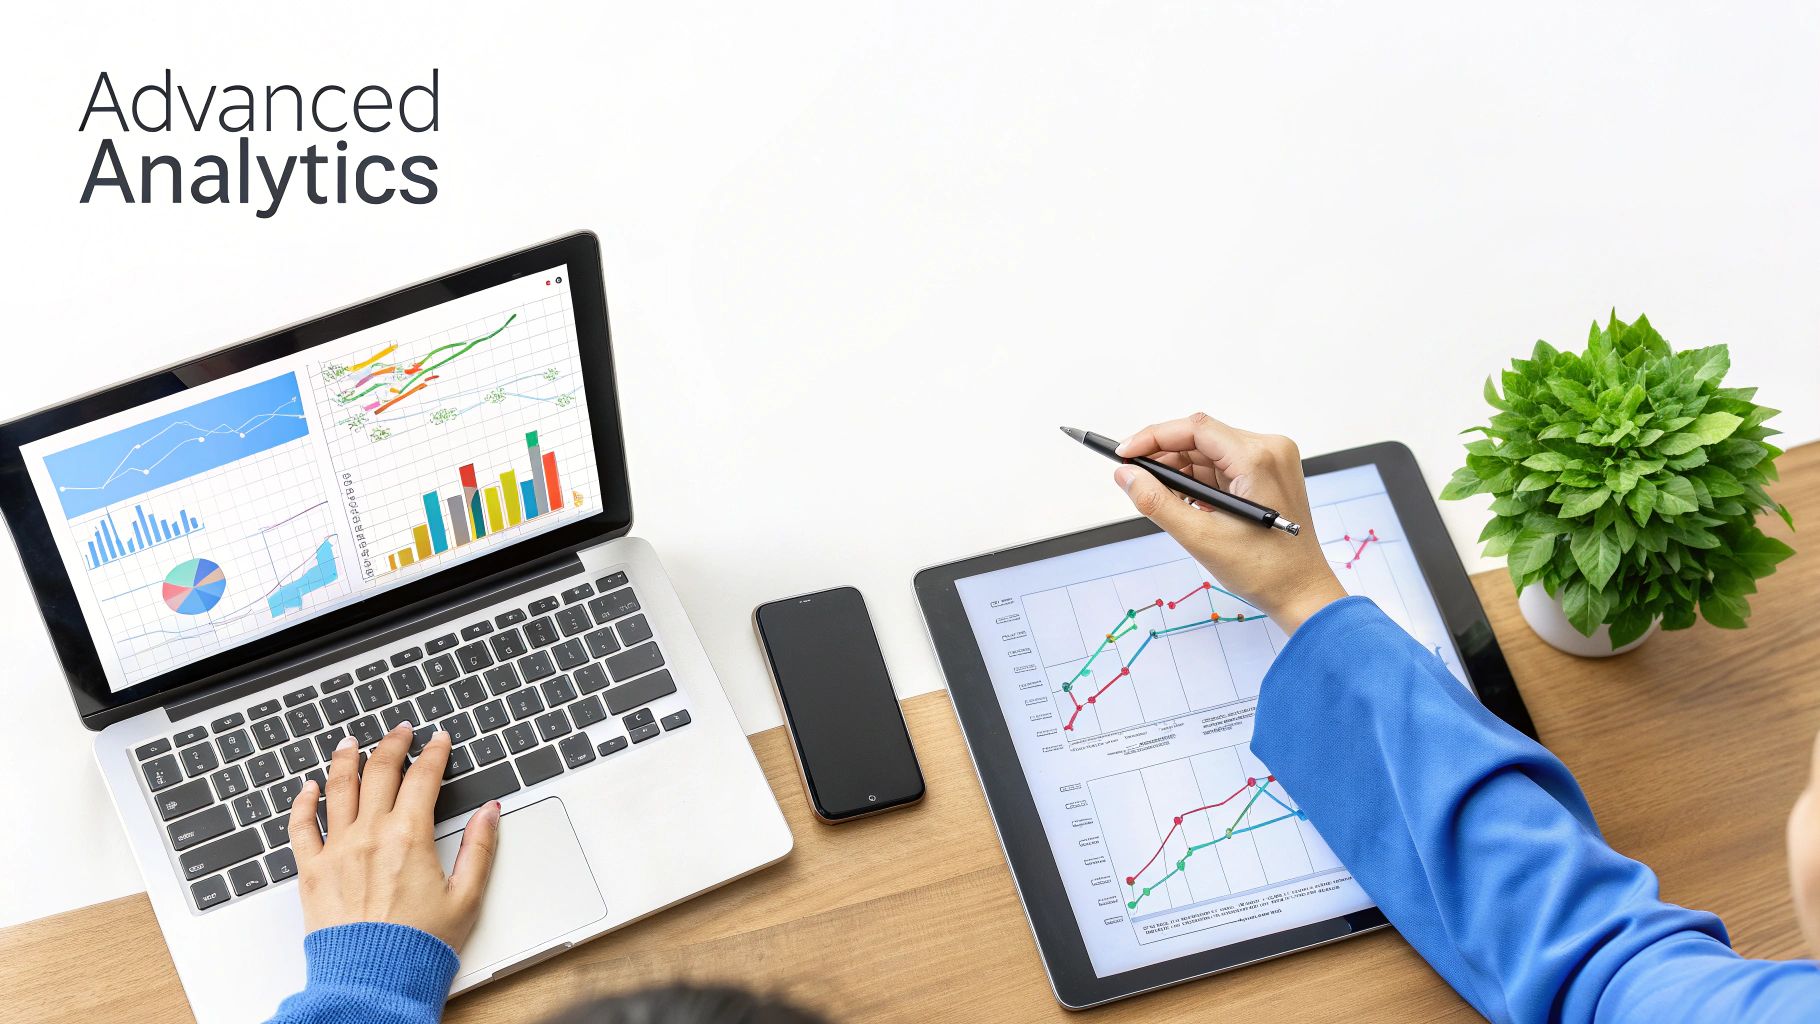
How AI Is Revolutionizing Stock Analysis
Artificial Intelligence (AI) and Machine Learning (ML) aren't just buzzwords; they're fundamentally changing the game for stock market analysis software.
Think of it this way: traditional analysis is like using a high-powered telescope to spot patterns in the stars. It's powerful, but you're still just one person looking. AI, on the other hand, is like having an entire observatory that not only sees the stars but also calculates their trajectories, predicts future alignments, and spots faint anomalies completely invisible to the human eye.
This intelligent layer allows modern software to move from simply showing you what already happened to offering calculated insights on what might happen next. AI algorithms can churn through immense datasets in seconds, identifying complex correlations and subtle market shifts that would take a human analyst weeks to find—if they could find them at all.
From Data to Predictive Insights
The real magic of AI is its ability to learn and adapt. It's not just following a fixed set of rules; it’s constantly refining its models based on new information flowing into the market. This opens up some incredible capabilities for today's traders.
- Algorithmic Trading: This is where software executes trades automatically based on a set of predefined criteria and AI-driven signals. The goal? Remove emotion from the equation and ensure lightning-fast execution.
- Sentiment Analysis: AI can scan millions of news articles, social media posts, and financial reports to gauge the overall mood or market sentiment around a stock. This can be an incredibly powerful leading indicator, telling you what the crowd is thinking before it shows up in the price.
By detecting patterns that are too complex or subtle for human perception, AI gives traders a significant analytical edge. It turns the art of trading into more of a science, backed by powerful computational models.
This technological leap is a key reason the market for these tools is exploding. The stock analysis software market is projected to grow from USD 1.2 billion to around USD 3.5 billion by 2032, largely fueled by the rising adoption of AI. It’s becoming an indispensable tool for processing today's massive influx of financial data.
To see how these advanced tools fit into a complete trading plan, check out our guide on the top stock market analysis techniques for savvy traders.
Choosing the Right Software for Your Strategy
Here’s a hard truth: the most powerful stock analysis software isn’t the one with a million bells and whistles. It’s the one that feels like a natural extension of your own mind and trading style. Picking the right platform is deeply personal, not a one-size-fits-all problem.
The real goal is to find a tool that clicks with how you see the markets.
So, the first step is a gut check. Who are you as a trader? If you’re a day trader, you live and die by instant data and razor-sharp charting tools that help you scalp tiny price moves. On the other hand, if you’re a long-term investor, you’ll probably care more about deep fundamental data and portfolio analysis than what the price is doing this exact second.
Aligning Tools with Your Trading Needs
Once you've figured out your style, be honest about your comfort level with technology. Some platforms are so packed with advanced functions they can feel like the cockpit of a fighter jet—overwhelming if you’re just learning to fly. If you're new, look for a clean interface and good customer support. You want to avoid analysis paralysis.
From there, it’s about the practical stuff:
- Budget: You can find everything from free, ad-supported tools to premium subscriptions that run hundreds of dollars per month. Figure out what you’re willing to spend and make sure the features actually justify the cost for your strategy.
- Brokerage Compatibility: Does the software play nice with your current brokerage account? Seamless integration means you can execute trades directly from your analysis screen, which is a huge deal for active traders where every second counts.
- Trial Periods: Never, ever commit without a test drive. The best way to know if a tool works for you is to get your hands dirty with a free trial. See if the workflow actually makes your life easier.
The right software should reduce friction, not create it. It should feel intuitive and empower you to execute your strategy with confidence and clarity, effectively becoming your co-pilot in the market.
Ultimately, this whole process is about finding that perfect fit. By taking the time to understand your needs and test-drive a few options, you can land on a platform that truly acts as an asset.
For a closer look at some of the top contenders, check out our breakdown of the top stock market analysis tools for pro traders. Making a smart choice now will save you a ton of time and headaches down the road.
Putting It All Together with ChartsWatcher
It’s one thing to talk about features in theory, but it’s another to see how they actually work together in the real world. Let’s take a look at a platform like ChartsWatcher to see how a modern stock market analysis software pulls all these essential tools into one powerful, easy-to-use package.
Instead of flipping between a charting program, a separate stock scanner, and a news feed, ChartsWatcher brings it all under one roof. Think of it as your trading command center. This unified dashboard is designed to solve the biggest headaches for traders: inefficiency and information overload. You can watch real-time charts loaded with technical indicators, run a custom scan for fresh opportunities, and keep an eye on breaking news that might rock your positions—all at the same time.
A Practical Example in Action
So, how does this play out during a trading day?
Imagine you’re waiting for a stock to break out of a key resistance level. With ChartsWatcher, you can set a specific alert for a price and volume combination. While the market does its thing, you can use the backtesting tool to run your breakout strategy against historical data, giving you confidence that your plan is solid. This kind of seamless workflow is what separates a good tool from a great one. It removes the friction so you can act decisively the moment your conditions are met.
A truly effective platform doesn't just provide data; it organizes that data around your unique strategy, transforming market noise into actionable signals.
This level of integration is absolutely critical in today's market. North America and Europe, which together made up over 42% of the $948 million global market in 2021, are incredibly competitive financial arenas. In these hubs, having top-tier software isn't just an advantage; it's essential for staying in the game. You can check out the full research on the global market to see just how fast this space is growing.
Have Questions? We Have Answers.
Jumping into the world of stock market analysis software can feel like learning a new language. You're bound to have questions. Here are a couple of the most common ones we hear from traders just like you.
Is This Stuff Too Complicated for a Beginner?
Not at all. In fact, many of the best platforms today are built with newcomers in mind. Forget the intimidating, cluttered screens you might be picturing from old trading movies.
The key is to find software that offers a demo account, easy-to-follow tutorials, and clean charts. Start simple. Learn to read a basic chart and set up a price alert. Once you get comfortable, you can start dipping your toes into more advanced tools like custom screeners and backtesting. The learning curve is what you make it.
So, Does This Software Just Print Money for Me?
If only it were that easy! No piece of software on earth can guarantee profits—every single trade comes with risk. The point of these tools isn't to give you a magic crystal ball that predicts the future with 100% accuracy.
Instead, think of it as a way to stack the odds in your favor. Good software gives you the data to build a solid strategy, manage your risk, and make decisions based on evidence, not emotion. It’s about trading smarter, not harder.
Stock market analysis software is a tool for enhancing your skill and strategy, not a replacement for them. It empowers sound judgment but doesn't eliminate the natural risks of trading.
By grounding your decisions in objective data, you give yourself a much better shot at building consistency and finding success over the long run.
Ready to see how a clear, powerful tool can sharpen your trading edge? Explore ChartsWatcher and take control of your market analysis today. Start your free trial at chartswatcher.com.
